( Gold Protocol ) Bullish & Bearish Reversal DetectedStatus: Active Reversal Protocol
Symbol: Gold
Session: London–New York Overlap (Smart Exit Window)
Bullish Reversal Zone : 3980 : 3962
Bearish Reversal Zone : 4055 : 4070
Bias: Bullish & bearish Reversal
☄️ Volume Surge Confirmed — Sellers dominate exhausted highs
☄️ Session Aligned — Smart money exit window open
☄️ Cluster Shield Active — Supply imbalance verified
☄️ Delta Shift Negative — Buyers trapped above
☄️ POC Retest Completed — Liquidity absorbed at resistance
☄️ Structure Break Pending — Bearish bias confirmed
Goal: Controlled with minimal drawdown
Tactical Edge: Reversal Protocol through liquidity engineering
Confidence Level: ★★★★★ (Smart Money Aligned)
⤵️Every like & comment on our TradingView posts helps us grow. More engagement means more exposure, which benefits everyone in the community!
Trade ideas

XAU/USD | Gold Setup Before FOMC – Big Move Coming Soon!By analyzing the Gold (XAUUSD) chart on the 2-hour timeframe, we can see that after the previous analysis, gold rose to $3,970 before facing heavy selling pressure that pushed it down to $3,908. Once price entered this demand zone, buyers stepped in again, driving gold back above $4,000.
As we marked on the chart, the $4,015–$4,050 range is a key supply zone, and today the price climbed to $4,030 before pulling back again. Gold is currently trading around $4,005, and if it holds below $4,014, we can expect a deeper decline.
Alternatively, if price breaks above $4,030, gold could aim for higher targets near $4,055 and beyond.
Keep in mind that tonight’s FOMC meeting could bring strong volatility — a rate cut of 25 basis points (to 4%) may cause short-term fluctuations, but a larger cut could trigger a sharp gold rally.
Stay cautious with your trades — I’ll update you after the FOMC results. Happy trading, guys! 💛
THE LATEST ANALYSIS :
Please support me with your likes and comments to motivate me to share more analysis with you and share your opinion about the possible trend of this chart with me !
Best Regards , Arman Shaban

Gold Before the Storm: Calm Silence or a Brewing Wave?Hello everyone,
Gold (XAU/USD) is holding steady around $3,938/oz, as global investors pause ahead of key policy announcements from both the Fed and ECB. After several volatile sessions, the market has entered a phase of quiet consolidation — a tension-filled calm before the next move.
The Fed kept rates unchanged at 4.00%, as widely expected. However, it was the silence that spoke volumes. With no clear timeline for rate cuts and an intentionally neutral stance, the Fed left traders uncertain. This ambiguity has supported the USD, placing mild pressure on gold in the short term.
Across the Atlantic, the ECB’s upcoming rate decision could set the tone for the next directional move. A dovish stance—signaling concern over growth—could strengthen the USD and pull gold toward $3,910–$3,880. Conversely, a hawkish ECB, emphasizing inflation risks, could weaken the dollar and lift gold back toward $4,020–$4,050.
From a technical perspective, the short-term structure remains bearish with a clear series of lower highs. Resistance lies near $3,960–$3,990, overlapping with an unfilled Fair Value Gap (FVG). The Ichimoku Cloud remains above price action, confirming bearish control. However, the $3,910–$3,880 zone has emerged as a potential battleground, where buy-side liquidity could trigger a short-term rebound.
Personally, I believe this calm is strategic — a phase of accumulation before volatility returns. The current range of $3,900–$3,970 resembles a stretched spring, ready to snap once new macro data hit the market. For now, the base case is a test of $3,880, followed by a rebound if the ECB sounds dovish or if the USD weakens.
Is this the calm before the storm—or the start of a new bullish reversal? What’s your take: will gold break lower, or surprise everyone with a rebound?

Gold Pauses After Sharp Selloff as Buyers Quietly ReturnHello everyone,
Gold has just experienced a rare deep sell-off, dropping from $4,380 to $3,980 – a nearly $400/oz loss in just a few sessions, equivalent to more than 9% of its value. Following this sharp decline, the price is now hovering around $4,010 and showing early signs of stabilising near the psychological support at $4,000 – a key area for the next directional move. This phase represents the market temporarily “catching its breath” to absorb liquidity after the large sell-off and prepare for the next step.
From the news perspective, the primary driver behind gold’s slump is the return of global “risk-on” sentiment after a preliminary US–China trade agreement. Capital promptly shifted away from safe-haven assets like gold into equities, crude oil, and other riskier assets. Yet the outlook is not entirely negative: US CPI data came in below expectations, reinforcing the potential for the Fed to cut rates by 25 basis points on 29/10. Lower rates continue to support gold in the medium term by making the precious metal more attractive.
Technically, the $3,980–$4,000 zone acts as strong support, coinciding with September’s low and containing unfilled liquidity gaps (FVG). After the steep drop, multiple FVG zones above remain – $4,120–$4,180 and $4,260–$4,320 – which could serve as recovery targets in upcoming sessions. Selling volume is weakening, and H4 candles show consistently long lower wicks – a clear indication that buyers are quietly absorbing selling pressure.
Personally, I believe gold has reached an important technical support and is likely to see its first technical rebound after this shock decline. The nearest target lies between $4,100–$4,200, overlapping the first FVG resistance. However, this recovery will likely be technical in nature until the market interprets the Fed’s post-29/10 policy message.
Do you see this as a buying opportunity at the bottom, or merely a trap rally before further declines?

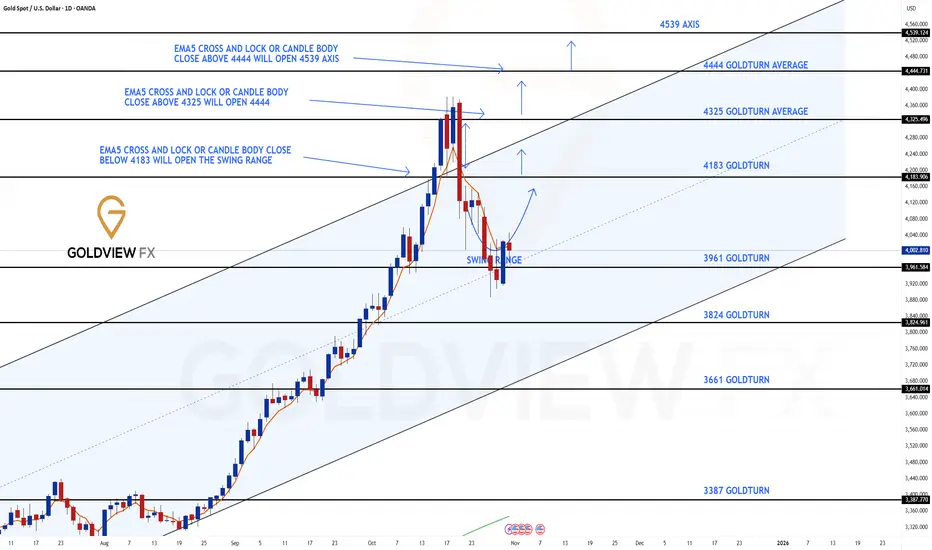
GOLD DAILY CHART ROUTE MAP Hey everyone,
Please review our Daily Chart Route Map, now featuring updated levels for tracking Golds movement.
We continue to track our refreshed proprietary Goldturn Channel, our unique method for constructing ascending channels. Price action is now testing the swing range and the swing range seems to be holding support as expected. This swing range support also falls inline with the channel half line providing stronger support.
As long as ema5 remains above the swing zone we expect price to play between this range until the full long term swing is completed into 4183. An ema5 break below the swing range will open the lower channel floor for test, currently sitting at 3824
As always, we will keep you all updated with regular updates throughout the week and how we manage the active ideas and setups. Thank you all for your likes, comments and follows, we really appreciate it!
Mr Gold
GoldViewFX
XAUUSD Crashes 1500 Pips — Key Supports Gone!Gold started the week poorly, dropping around 1500 pips and, more importantly, breaking three key support levels:
• the rising trendline that started back in August,
• the 4020 horizontal support zone,
• and even the psychological 4000 level.
Overnight, the price attempted to reclaim 4000, but failed — currently trading around 3965.
The next immediate support sits at 3945, and even if we see a rebound from here, bulls will need to hold the price firmly above 4000 to have any chance of a reversal.
If this level also fails, the next obvious medium-term target is the 3720–3750 zone.
I m bearish for now, but there isn’t a clean or logical entry point at the current levels — I will wait until a clearer setup forms.

Gold Rebound: Bulls Target 4,130 ResistanceHello, traders, I want share with you my opinion about Gold. Gold has been trading within a broad technical structure, evolving from a strong bullish phase into a corrective descending channel. The previous uptrend was clearly defined by an ascending channel, which guided the price through multiple impulsive rallies and pullbacks. However, after forming a double-top pattern near the 4320 resistance level, buyers began to lose momentum, resulting in a sharp decline. Currently, the price is trading within a well-defined descending channel, where sellers have been maintaining short-term control. After a deep test of the Buyer Zone around 3920, the market has shown early signs of a potential rebound. The asset is now pulling back from this support area and is approaching the resistance line of the descending channel. In my opinion, this upward correction represents a short-term recovery within a larger bearish context. I expect that the price will rally towards the Resistance Level near 4130–4140, where strong selling pressure may reappear. This area is also aligned with the upper boundary of the descending channel, creating a strong confluence zone. A rejection from this resistance line would confirm the continuation of the bearish structure. The next potential move could be a rotation back down towards the Buyer Zone, or even a deeper retest of the Support Line around 3920. My take-profit (TP1) for the corrective rally is placed at 4108, targeting the upper range of the structure before the next potential reversal. Please share this idea with your friends and click Boost 🚀

30.10.25 Morning ForecastPairs on Watch -
FX:XAUUSD
FX:EURCAD
FX:EURAUD
A short overview of the instruments I am looking at for today, multi-timeframe analysis down to what I will be looking at for an entry. Enjoy!

( Gold Protocol ) Bearish Reversal Detected( Gold Protocol ) Bearish Reversal Detected
Bearish Reversal : 3978
Status: Active Reversal Protocol
Symbol: Gold
Session: London–New York Overlap (Smart Exit Window)
➕Bias: Bullish & bearish Reversal
☄️ Volume Surge Confirmed — Sellers dominate exhausted highs
☄️ Session Aligned — Smart money exit window open
☄️ Cluster Shield Active — Supply imbalance verified
☄️ Delta Shift Negative — Buyers trapped above
☄️ POC Retest Completed — Liquidity absorbed at resistance
☄️ Structure Break Pending — Bearish bias confirmed
Goal: Controlled with minimal drawdown
Tactical Edge: Reversal Protocol through liquidity engineering
Confidence Level: ★★★★★ (Smart Money Aligned)
PRICE ACTION – The True Language of the MarketIn the noisy world of trading, filled with indicators, signals, and formulas, Price Action brings you back to the core: price. When you remove all indicators, erase moving averages, and forget RSI, the only thing left on your chart is the footprint of the market – the candles telling their story.
What is Price Action – and why is it the “true language”?
Price Action is not a “magic trick” or an infallible trading system. It is the art of listening to the market, the ability to read the rhythm of money flow and human emotions reflected in every price movement. Each candle is not just data – it is a story of hope and fear, of buyers and sellers, of greed and doubt. A Price Action trader does not predict the market – they observe how the market reacts.
Price – where emotions are written in candles
Price never moves randomly. Every high and low is the result of millions of human decisions.
When price breaks a high: it’s confidence and euphoria.
When price breaks a low: it’s fear and panic.
When price moves sideways: it’s waiting and doubt.
Price Action teaches you to read the emotions behind each click, not just the shape of the candle.
Market structure – the backbone of Price Action
Behind every trend lies a clear structure. The market cycles through three phases:
Accumulation – buyers and sellers struggle, price moves sideways.
Expansion – one side dominates, trend forms.
Distribution – winners take profits, losers retreat.
Understanding market structure means knowing where you are in the cycle, avoiding blind trades, and acting with purpose.
Every candle – a small story in the bigger picture
A long lower shadow signals strong buying pressure.
A pinbar at resistance shows price rejection.
A series of small candles indicates accumulation and an impending breakout.
A Price Action trader does not see candles individually but connects them into the full story – where every move has a reason.
The power of simplicity
Price Action is simple, yet far from simplistic. It is not lagging like indicators, not dependent on false signals, and can be applied across all markets – from Forex and gold to crypto. When you read price action, you are no longer passive, waiting for a signal; you become the navigator, following the market’s heartbeat.
The mindset of a professional Price Action trader
A professional Price Action trader doesn’t ask, “When should I enter?” Instead, they ask:
Who is controlling the market?
Where is the money flowing?
Has this price area reversed before?
Am I moving with the money or against it?
The difference lies not in technique, but in mindset and reaction. The market doesn’t need you to win. It rewards those who understand how it operates.
When you read price, you understand people
Price Action is not a tool; it is a living perspective on market psychology. It doesn’t promise perfection, but it gives you profound understanding. When you read price – you are reading human psychology. When you understand structure – you grasp the rhythm of emotional cycles. And when you immerse yourself in Price Action, you are no longer guessing prices – you move with the market, heartbeat by heartbeat, move by move, opportunity by opportunity.

GOLD → Sell-off due to uncertainty FX:XAUUSD is falling, the trend is downward, and we have confirmation of this. Profit-taking is leading to a decline, which is causing buyers to exit the market...
Caution ahead of the Fed: Markets are pricing in a 25 bp rate cut, but the main thing is the tone of the statement and Powell's comments on further steps. The USD is not ready to continue its growth and is starting to look downwards. The US government shutdown continues, adding uncertainty, which supports gold.
However, an important issue is the trade deal between the US and China; a positive outcome could put pressure on gold.
Gold is balancing between hopes for a trade truce and risks from Fed policy.
Support levels: 3895, 3820
Resistance levels: 3943, 3975, 4015
Since the opening of the session, the price has fallen by 2.3%, which is an intraday range. The 3900-3895 area may see a reaction in the form of a false breakdown and a correction to the imbalance zone before a possible further decline.
Best regards, R. Linda!

Gold A waiting for rebound raising hopes for a potential tradeGold prices regained some lost ground on Tuesday after breaking below the key 4,000 support level. Following a sharp 32% decline in the previous session, the market is showing signs of stabilization. The rebound was supported by encouraging progress in U.S.–China trade negotiations, as both countries agreed to withdraw threats of 100% tariffs. Additionally, optimism has increased ahead of Thursday’s meeting between U.S. President Donald Trump and Chinese President Xi Jinping, raising hopes for a potential trade deal.
Technical Outlook:
From a technical perspective, the recent decline suggests that gold prices may retest the 3,925 / 3,900 support zone. It’s important to monitor this area closely — a clear break below could open the door for deeper downside movement. On the upside, if the bulls manage to reclaim and hold above 4,050, the market could see a short-term recovery toward the 3,985 / resistance area.
You may find more details in the chart.
Trade wisely best of Luck Buddies.
Ps; Support with like and comments for better analysis Thanks for Supporting.

GOLD: Waiting For the Bulls To Join the PartyGOLD: Waiting For the Bulls To Join the Party
From our previous analysis, gold reached the same target twice. The bullish momentum is low, but it could increase over time.
The prevailing trend is evident, which is intact and remains bullish.
Today on the US economic calendar, the PCE data was expected to be reported.
Given that we have a data shortage due to the US government shutdown, this could raise questions again and could help gold to rise.
You may find more details in the chart!
Thank you and Good Luck!
❤️PS: Please support with a like or comment if you find this analysis useful for your trading day❤️
Previous analysis:

XAUUSD – After Powell’s Speech, Gold Is Losing Its Shine!The gold market has entered a tense phase after Fed Chairman Jerome Powell’s remarks on October 29. Although the Fed cut rates by 0.25% as expected, Powell maintained a cautious and slightly hawkish tone, leading investors to doubt the possibility of an aggressive easing cycle ahead. As a result, the USD strengthened while gold lost its upward momentum — a clear signal that the bearish trend is taking control.
On the H2 chart, gold is moving within a well-defined descending channel , consistently forming lower highs and lower lows. Each attempt to retest resistance has been met with strong rejection, confirming that sellers remain in control.
The 3,960,000 zone is acting as a key resistance level where price could bounce slightly before continuing its decline. If this level fails to break, the next bearish targets lie around 3,850,000 and deeper towards 3,790,000, aligning with the lower boundary of the channel.
With the current technical setup and market sentiment favoring the USD, every pullback in gold is merely an opportunity for sellers to take action.
When Powell says “cautious,” the market hears “sell gold!”

XAU/USD Strong Rally: Will Gold Continue Its Upward Trend?XAU/USD has experienced a strong recovery , bouncing back from the key support zone around 3,950,000. This short-term rebound is driven by a combination of factors, especially the positive market sentiment following expectations that the Federal Reserve (Fed) may cut interest rates. Hopes for economic stimulus measures have increased demand for gold as a safe-haven asset, particularly in the context of economic and geopolitical instability .
Looking at the chart, we can see that the price of gold is respecting an upward trendline, creating higher lows. This indicates that the bullish momentum remains intact after recent pullbacks. The price is currently hovering around 4,018,210, near a short-term resistance zone.
Support Zone: The most recent low near 3,950,000 has held strong, acting as a key support level.
Resistance Zone: The short-term resistance lies around 4,080,000, which is a critical level to watch if the upward momentum continues. A break above this level could lead to further upward movement.
The next market move will depend on whether the price can maintain the 4,000,000 level. Traders should monitor price action around these key levels to confirm a breakout or a correction.

THE KOG REPORT - FOMCTHE KOG REPORT – FOMC
This is our view for FOMC, please do your own research and analysis to make an informed decision on the markets. It is not recommended you try to trade the event if you have less than 6 months trading experience and have a trusted risk strategy in place. The markets are extremely volatile, and these events can cause aggressive swings in price.
We’ve done pretty well this week so we’ll only share the levels and potential path but say that it’s really not worth getting involved in the FOMC move itself. We’d rather wait for them to move the price and then look for a set up to get a trade due to the extreme volatility on gold this month.
Below, we have the support level 3965-75 which needs to hold us up in order for this daily candle to close bullish and attempt to target the higher liquidity regions of 4050 and above that 4095. A break above which is very possible will take us into our area or interest which is around the 4150 region. It’s that region we will want to watch, if approached and we get a reaction, an opportunity to short from there may be available to traders.
Because we’re already in long from the swing, there is no point attempting to short it from here, instead, if we do go downside into the lower levels, we will be looking at the 3840-60 regions for a reaction in price to then attempt the scalp long.
RED BOXES:
Break below 3985 for 3955 and 3938 in extension of the move
Break above 4003 for 4020, 4030 and 4061 in extension of the move
Please do support us by hitting the like button, leaving a comment, and giving us a follow. We’ve been doing this for a long time now providing traders with in-depth free analysis on Gold, so your likes and comments are very much appreciated.
As always, trade safe.
KOG

XAU/USD (Gold vs USD) chart on the 4-hour timeframe..XAU/USD (Gold vs USD) chart on the 4-hour timeframe, here’s the analysis based on what’s visible:
My drawn a rising trendline that has been broken to the downside — suggesting a bearish breakout.
The price is currently trading around $4,035, below the Ichimoku cloud (which adds to bearish confirmation).
I have two target points already marked on the chart, showing potential downside levels.
Based on my chart markings:
🎯 Target 1: Around $3,960
🎯 Target 2: Around $3,780 – $3,800
These targets match the measured move from the range of the consolidation (roughly $150–$200) projected downward from the breakout level.
✅ Summary:
Current price: ~$4,035
First target: ~$3,960
Second target: ~$3,780
Bearish bias remains valid while price stays below ~$4,150–$4,200 (the resistance and cloud zone).

XAUUSD Long: Demand Zone Holding, Eyes on $4,080Hello traders! Gold (XAUUSD) is currently showing a corrective phase within its broader bullish trend. After a strong rally from the $3,850 Demand Zone, price climbed steadily along the ascending Trend Line, forming higher highs and higher lows until reaching the $4,150–$4,180 Resistance Area. This zone acted as a key pivot point, where buyers lost momentum and sellers initiated a retracement.
Following this, the market broke below the Trend Line, signaling the start of a short-term correction. The correction found temporary support near the $3,950 Demand Zone, where buyers have recently stepped in again. This level coincides with a previous pivot and a key structural support area, suggesting a potential rebound setup. At the moment, price is consolidating between the $3,950 Demand Zone and the $4,080–$4,150 Resistance Area, indicating indecision before the next move.
From my perspective, Gold is likely to attempt a bullish correction toward the $4,080–$4,150 Resistance Zone, which aligns with both the previous Trend Line and recent pivot structure. A successful break and close above $4,150 would confirm a trend continuation toward higher levels. However, if the price fails to break above this resistance area and gets rejected, sellers could regain control, pushing the market back down toward $3,950 or even lower. For now, I’ll be watching for confirmation of a bullish reaction from the $3,950 Demand Zone to validate a short-term long setup targeting $4,080. Manage your risk!

GOLD WEEKLY CHART MID/LONG TERM ROUTE MAPHey everyone,
Please check out our updated Weekly Chart Route Map, featuring updated revised key levels after completion of our last long term weekly chart idea for precise level-to-level tracking.
Price action has successfully filled EMA5 detachment (highlighted with a circle) and we are now seeing price play between 4059 (resistance) and 3821(support).
To determine the next directional move, we’ll need a decisive test and break of either boundary level. On the broader horizon, 3006 stands as the long-range pivotal swing zone, which may come into play if a major correction unfolds.
🔹 Note: The key distinction between a retracement range and a swing range is that swing ranges typically produce larger bounces and wider price reactions compared to standard retracement ranges.
We’ll continue to update this outlook throughout the week as the structure develops. Thank you all for your likes, comments and follows, we really appreciate it!
Mr Gold
GoldViewFX

Latest Gold Price Update: Buy or Sell?👋Hello everyone , great to see you again in today’s discussion about OANDA:XAUUSD !
Last week, gold traded under strong bearish control, pressured by a series of negative headlines including the U.S.–China trade developments and cautious remarks from Fed Chair Jerome Powell. Entering the new week, the downtrend still shows no signs of reversal, with prices hovering around $4,025 at the time of writing.
Another noteworthy factor comes from China, the world’s largest consumer of gold. The Chinese government has just announced a new policy canceling the VAT deduction for gold trading companies. This change means higher domestic purchase costs, which could significantly dampen gold demand within the country. Analysts believe this policy will add downward pressure on international gold prices, given China’s critical role in global physical demand.
Meanwhile, the strong U.S. dollar and rising Treasury yields continue to act as the two “clamps” squeezing gold’s recovery momentum. The combination of a firm USD and higher yields has dragged gold back below the $4,000/oz level. Previously, gold had surged to record highs fueled by expectations of Fed rate cuts, geopolitical tensions, global slowdown fears, and robust central bank gold buying. But now, those catalysts appear to be losing their grip, with markets returning to a more balanced state.
From a technical perspective, gold has weakened after reaching the short-term resistance zone at $4,045–$4,050, which also aligns with the key confluence area between resistance and the EMA 89 line. It’s likely that prices will form a short-term top around this region and then reverse lower, with the next target heading toward the strong support zone marked — an area where the market previously saw notable buying reactions last week.
The key question now is: Will gold manage to rebound from here or continue its decline in the coming sessions?💬 Share your thoughts in the comments below!

GOLD 4H CHART ROUTE MAP UPDATE & TRADING PLAN FOR THE WEEKHey Everyone,
Please see our updated 4h chart levels and targets for the coming week.
We are seeing price play between two weighted levels with a gap above at 4079 and a gap below at 3985. We will need to see ema5 cross and lock on either weighted level to determine the next range.
We will see levels tested side by side until one of the weighted levels break and lock to confirm direction for the next range.
We will keep the above in mind when taking buys from dips. Our updated levels and weighted levels will allow us to track the movement down and then catch bounces up.
We will continue to buy dips using our support levels taking 20 to 40 pips. As stated before each of our level structures give 20 to 40 pip bounces, which is enough for a nice entry and exit. If you back test the levels we shared every week for the past 24 months, you can see how effectively they were used to trade with or against short/mid term swings and trends.
The swing range give bigger bounces then our weighted levels that's the difference between weighted levels and swing ranges.
BULLISH TARGET
4079
EMA5 CROSS AND LOCK ABOVE 4079 WILL OPEN THE FOLLOWING BULLISH TARGETS
4173
EMA5 CROSS AND LOCK ABOVE 4173 WILL OPEN THE FOLLOWING BULLISH TARGET
4264
EMA5 CROSS AND LOCK ABOVE 4264 WILL OPEN THE FOLLOWING BULLISH TARGET
4340
EMA5 CROSS AND LOCK ABOVE 4340 WILL OPEN THE FOLLOWING BULLISH TARGET
4422
EMA5 CROSS AND LOCK ABOVE 4422 WILL OPEN THE FOLLOWING BULLISH TARGET
4494
BEARISH TARGETS
3985
EMA5 CROSS AND LOCK BELOW 3985 WILL OPEN THE FOLLOWING BEARISH TARGET
3873
EMA5 CROSS AND LOCK BELOW 3873 WILL OPEN THE SWING RANGE
3741
3632
As always, we will keep you all updated with regular updates throughout the week and how we manage the active ideas and setups. Thank you all for your likes, comments and follows, we really appreciate it!
Mr Gold
GoldViewFX

( Gold Protocol ) Bearish After Break Detected( Gold Protocol ) Bearish After Break Detected
Status: Active Reversal Protocol
Symbol: Gold
Session: London–New York Overlap (Smart Exit Window)
Confidence Level: ★★★★★ ( Hanzo Volume Detected )
☄️ Bearish After Break Out 3948
Reasons
1. Alpha Sequence Engaged — Smart flow detected within Hanzo precision range.
2. Volume Window Synced — Session energy aligns with internal volume pulse.
3. Liquidity Cycle Active — Engineered sweep confirms smart money transition.
4. Time Lock Confirmed — Market phase locked with directional intent.
5. Volume Map Aligned — Cluster balance reveals real directional flow.
6. Hanzo Wick Detected — Manipulation wick verified under Alpha filter.
⤵️Every like & comment on our TradingView posts helps us grow. More engagement means more exposure, which benefits everyone in the community!
GOLD → The market is testing 4K ahead of the Fed's decision FX:XAUUSD is testing $4,000 ahead of the Fed's decision, partially recovering from a 3.5% drop this week. The fundamental backdrop is mixed, but technically, the signs of a bull market are positive.
Key factors : Fed decision (today): A 25 bps rate cut is expected, but the main focus is on the vote count and Powell's comments.
A dovish scenario (emphasis on risks to the labor market) will support gold. A hawkish surprise will reinforce the correction. Trump-Xi meeting (tomorrow): Statements about lowering tariffs weaken demand for defensive assets.
Gold is in limbo; in the second half of the European session and the beginning of the US session, the market may enter a phase of stagnation. Growth is only likely if the Fed takes a soft tone, while progress in trade negotiations or a hawkish surprise from the Fed will prolong the correction.
Resistance levels: 4015, 4050, 4085
Support levels: 3975, 3945, 3900
If the bulls can hold their ground above 4K, we will see strong support, in which case growth to 4050-4100 may be triggered. Otherwise, the market may form a correction to 3975-3945. It is worth keeping an eye on comments from Powell and Trump... Volatility will be high...
Best regards, R. Linda!
