GOLD XAU/USD: Wave ((1)) Near Completion - Wave 2 Zigzag vs Flat GOLD: WAVE ((1)) COMPLETE - WHAT'S NEXT?
Wave ((1)) nearly finished at ~$3,989. Next: Wave ((2)) correction
to the $4,250 area. But which pattern?
━━━━━━━━━━━━━━━━━━━━━━━━━━━━━━━━━━━━
ZIGZAG (60% Probability) Pattern: A-B-C (sharp, V-shaped)
• Wave (A): Sharp 1-2-3-4-5 impulse
• Wave (B): Brief recovery (~30-40% of wave A)
• Wave (C): Sharp impulse (~equal to A or 1.618x A)
━━━━━━━━━━━━━━━━━━━━━━━━━━━━━━━━━━━━
FLAT (40% Probability) Pattern: A-B-C (sideways consolidation)
• Wave (A): Moderate move
• Wave (B): Recovery that reclaims wave A (~80-120% of A)
• Wave (C): Normally sharp 1-2-3-4-5 impulse (~50-120% of A)
If price retraces 100% of wave 1 (above $3,956) Structure INVALID
MY BIAS: ZIGZAG
Wave 1 was powerful → Sharp corrections follow
Support: $3,956 (invalidation level)
Resistance: $4,150 - $4,200 - $4,250
IMPORTANT ELLIOTT WAVE RULES FOR WAVE 2:
━━━━━━━━━━━━━━━━━━━━━━━━━━━━━━━━━━━━━━━━
✓ Wave 2 CANNOT retrace more than 100% of wave 1 (invalidation rule)
✓ Wave 2 CANNOT be a triangle (only B and (iv) can be triangles)
✓ Wave 2 CANNOT be a combination beginning with a zigzag
(combinations only if starting with a flat)
These rules help us eliminate possibilities and confirm structure.
Trade ideas

Gold Trading Strategy for Monday
News:
Gold (XAU/USD) remained under pressure this week, falling below $4,000 at one point and hitting its lowest level since early October, influenced by Federal Reserve Chairman Jerome Powell's cautious remarks and easing US-China trade tensions.
Considering all factors, future US economic data and speeches by Federal Reserve officials will be key catalysts in determining the direction of gold prices.
Specifically:
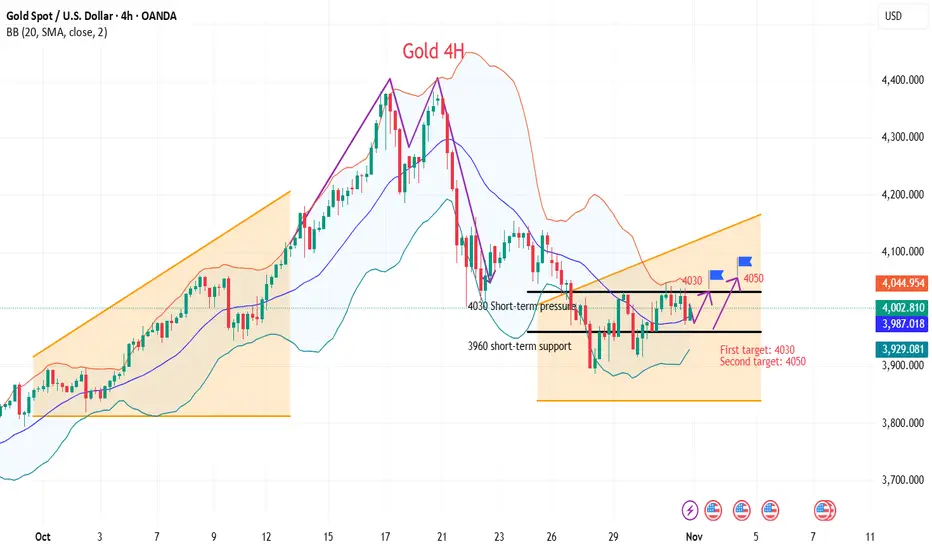
From the 4-hour chart, the current short-term resistance level to watch is 4035-4030, with a key resistance level at 4055. Short-term support is around 3960. The overall trend remains upward, so the recommended strategy is to buy on dips and patiently wait for key entry points.
Specific trading strategies will be provided in the channel; please pay attention.
I believe the overall market will maintain a period of fluctuation before continuing its upward trend. Judging from the current market situation, the bottom has been established, but the upward trend has not yet started. In particular, the repeated fluctuations and shakeouts on Friday have added more uncertainty to the market.
This is mainly because market sentiment is currently quite divided. The US-China trade tariff issue is in a tug-of-war, and the Russia-Ukraine situation has begun to ease, but these remain unresolved issues. Although bullish momentum has slowed, it's not enough to reverse the bull market trend. The more important factors are US Treasury bonds, the Fed's interest rate cuts, and the cessation of balance sheet locking.
Therefore, after a short period of tug-of-war between bulls and bears, the market will likely rise again later.
Trading strategy:
Buy:3980-3975, SL: 3960, TP: 4000-4030-4060
GOLD: HAWKISH FED Pushing the Market? $4,085 is the Test!Hey community, Gold is sitting at a critical junction. The alignment of the Fed’s pressure and a key Supply Zone is creating a high-conviction trade setup. Let's break it down.
I. FUNDAMENTALS: The Macro Headwinds 📰
Key Driver (The Bears' Argument): The Fed’s latest "hawkish" signals, with regional Presidents opposing further rate cuts, have significantly cooled market easing expectations. This solidifies the strong USD, creating heavy short-term pressure on non-yielding Gold.
Performance & Record High: Despite the immediate pressure, Gold surged 53% this year, hitting an all-time high of $4,381.21/oz on October 20th, showcasing underlying bullish demand.
Long-Term View: Morgan Stanley still supports Gold’s long-term climb (targeting $4,300/oz average by H1 2026), driven by expected rate cuts and economic instability.
Geopolitics: Trade news (e.g., discussions on US-China tariffs) adds noise, but the Fed's interest rate stance remains the dominant factor.
II. TECHNICAL ANALYSIS: The Supply & Demand Zones 🎯
The prevailing structure on the H4 chart confirms a strong DOWNTREND (Bearish Bias). The recent rally is a correction, necessary to retest key supply before the next decline.
1. The Primary SELL Setup (Following the Trend)
Optimal Supply Zone: $4,059 - $4,085. This is the key reversal zone where smart money is likely waiting to fill sell orders (discount zone for shorts).
Strategy: Wait for price to reach the $4,059 - $4,085 zone. Look for a strong rejection or pattern shift on lower timeframes to confirm the SHORT entry.
Ultimate Target (TP): The strong Demand Zone at $3,939 - $3,952.
2. The Counter-Trend BUY Zone (Bounce Potential)
Strong Demand Area: $3,939 - $3,952. This is a major structural level where Gold is likely to find strong support.
Strategy: If Gold sells off into this area, watch for buying pressure to catch a potential bounce.
🔑 FINAL TRADE CONCLUSION
Best Strategy: Wait and SHORT at the $4,059 - $4,085 Supply Zone. This is where fundamental pressure (Fed) and technical resistance perfectly align.
What's your take? Will the strength of the USD hold Gold down from here? Drop a comment! 👇
#XAUUSD #GOLD #FED #TechnicalAnalysis #ForexTrading #SupplyAndDemand #Bearish #TradingStrategy #PriceAction #MarketAnalysis

XAU ShortsGold here, can do the job from 25x… hold weight..
And still. She wants back $3983…
Targets here dipping for 3975 and look if can pop back to sustain $3983.
Super handle. 👏
Also can be extended into $3940 pending….
We don’t want to see this hold above 31
Longer Term!!! $3983 is the ticket I believe to ripping back into $4300+…
Let’s see Traders. 💃

XAU/USD Intraday Plan|Fed Cut Fails to Lift GoldGold broke above the 3987 resistance yesterday but failed to reach the 4042 resistance level, reversing sharply after the FOMC announcement and dropping back below 3944. The move reflected post-event volatility as markets reacted to the Fed’s cautious tone.
Price is currently trading around 3964, trending just above the MA50 but still below the MA200, suggesting early signs of stabilization while the broader short-term outlook remains uncertain. A confirmed break above 3987 could open the way toward 4042 and 4095, while failure to stay above 3944 may lead to another drop toward 3884–3820, where dip-buyers may look to step in.
📌 Key levels to watch:
Resistance:
3987
4042
4095
4137
Support:
3944
3884
3820
3781
🔎 Fundamental Focus:
The Federal Reserve cut rates by 25bps, bringing the Federal Funds Rate to 4.00%, but Chair Powell’s cautious tone during the press conference dampened market optimism.
Markets reacted with volatility as traders weighed the potential for further easing later this year. Meanwhile, the ongoing U.S. government shutdown and lingering U.S.–China trade tensions continue to cloud sentiment, keeping gold supported on dips as uncertainty remains elevated.

Gold Price Outlook – Trade Setup (XAU/USD)📊 Technical Structure
OANDA:XAUUSD Gold is consolidating near $4,000, following a rebound from the $3,948–3,957 support zone. The price faces strong resistance between $4,008–4,016, where there is a possibility to retrace back to the trendline. A rejection from this zone could confirm a short-term pullback toward support, while a decisive breakout above $4,023 may open the door to $4,050 and beyond.
🎯 Trade Setup
Entry: $4,008 – $4,016 (resistance retest)
Stop Loss: $4,023
Take Profit: $3,957 / $3,948
Risk-Reward Ratio: ≈ 1 : 3.8
🌐 Macro Background
Gold extended its recovery for the second consecutive day amid renewed safe-haven demand, but the upside remains capped by the Fed’s hawkish stance. As FXStreet’s Haresh Menghani noted: “Gold trades with a positive bias for the second straight day, though remains capped below $4,050 amid mixed fundamental cues.” 【FXStreet】
The U.S. government shutdown concerns continue to weigh on sentiment, softening the Dollar slightly and supporting gold’s defensive bid. However, Fed Chair Powell’s hawkish tone—stating that another December rate cut “is not a foregone conclusion”—keeps the USD underpinned and limits further gold gains.
In addition, the de-escalation in U.S.–China trade tensions has improved risk appetite, reducing safe-haven flows. This mixed backdrop leaves gold oscillating within a tight range ahead of key FOMC member speeches and month-end flows.
🔑 Key Technical Levels
Resistance: $4,008 – $4,016
Support: $3,948 – $3,957
Psychological Level: $4,000
📌 Trade Summary
Gold trades near $4,000, balancing safe-haven support and Fed-driven headwinds. The short-term bias favours selling near resistance ($4,008–4,016) targeting the $3,957 zone, with stops above $4,023. A sustained close above $4,023 would invalidate this bearish bias.
⚠️ Disclaimer
This analysis is for reference only and does not constitute trading advice. Trading involves significant risk, and proper risk management is essential.

xauusd today 💡 What to watch now:
If price spikes above 4020 and then closes below 4010, that would be a classic manipulation wick, potentially followed by a drop.
If the USDX starts breaking above 99.25, that would confirm the short bias on gold.
I’m not entering yet — it looks promising, but we’re still waiting for a clearer picture. Definitely worth keeping an eye on though!

XAUUSDhi everyone,.
here i just share about my idea
i think the price will make a small correction before make a strong bullish.
disclaimer
this is not a signal
be smart
save your money.

GOLD XAUUSD IF buyers fails to reclaim 4030 ,it could be a technical sell continuation, however if the break out of 4030 we a heading to 4130 ASAP
DEMAND FLOOR ON 3945-3940 WILL BE WATCHED.
THE RATE CUT ,OR HOLD WILL BE THE NEXT VOLATILITY.
#GOLD

XAU USD Last bullish leg ?Price has broken short-term bearish structure and moved above the moving-average channel with strong momentum, indicating a shift toward bullish control. The rising trendline is holding as support, confirming structural reversal.
Fibonacci levels provide clear upside targets, with 38.2% at 4040–4050 as the first objective, followed by a constrained upper target near 4070, just below the 61.8% retracement and prior supply zone.
As long as price holds above the breakout zone and trendline, continuation toward 4040–4070 remains the most probable outcome.

XAU/USD | Testing Deeper Support ZoneYesterday’s analysis is playing out as expected — the first support zone has failed, and price is now testing the Deeper Support Zone (3,944–3,884). The continued downside momentum confirms that sellers remain firmly in control, with short-term sentiment still leaning strongly bearish.
Gold is currently trading around 3,930, holding well below both the MA50 and MA200, reinforcing ongoing downside pressure. If buyers can defend this zone and push price back above 3,987, a corrective rebound toward 4,042 and 4,095 could follow.
However, a clean break below 3,884 would likely open the door for a deeper decline toward 3,820–3,781, where dip-buyers may look to re-enter the market.
📌 Key levels to watch:
Resistance:
3944
3987
4042
4095
4137
Support:
3884
3820
3781
Despite the current correction, the overall bullish trend remains intact, with the recent sell-off seen as a healthy correction within the broader bullish trend.
🔎 Fundamental Focus:
It’s a big week for the U.S., with the FOMC rate decision and press conference on Wednesday expected to draw most of the market’s attention.
Before that, traders will be watching Consumer Confidence and Pending Home Sales data today.
The backdrop remains tense with the U.S. government shutdown still unresolved, keeping overall sentiment cautious across markets.


GOLD | Bearish Momentum Below 4,053GOLD | Bearish Momentum Below 4,053 ⚠️
Gold currently shows bearish momentum while trading below 4,053, with potential to extend losses toward 4,011.
A confirmed break below 4,011 would signal continuation of the bearish trend toward 3,944.
However, if the price stabilizes above 4,011, a bullish reversal is possible.
A close above 4,053 would confirm bullish momentum toward 4,074 → 4,124.
Pivot Line: 4,053
Resistance: 4,074 – 4,101 – 4,124
Support: 4,011 – 3,978 – 3,945

XAU / USD 30 Minute ChartHello traders. Taking a look at the 30 min. chart, I have marked my current area of interest for a potential scalp buy/sell trade. Just looking to grab a few pips. Let's see if we push up a bit, or keep moving down some more. Checking the 4 hour and other time frames. I am not trying to force or rush a trade. Shout out to Big G. Let's see how the hourly closes.

Liquidity’s Loading… Choose Your SideVANTAGE:XAUUSD Outlook 🧐
We got an X formation right on the chart and price is chilling above the pilot line, the line between calm and chaos.
📊 Short-term: Liquidity sweep still in play
Break it, and we could dive to 3,940s.
📈 Mid-term : Pilot line holds → bulls reload
Hold it, and Gold might wake up swinging back to 4,180+.
🔻 Short-Term Bias:
Still leaning bearish, expecting possible sweeps above 4,020 before a pullback toward 3,980–3,940 OG zones.
Mid-Term View:
If price holds above those green zones and the daily trendline, momentum could shift back up toward 4,120–4,180
📅 Macro Watch:
This week’s NFP & Core PCE data will likely move Gold
Strong numbers → USD up, Gold pressure
Weak data → USD down, Gold bounce potential
Market is coiling before the storm🥶stay patient, trade levels, not emotions.

StevenTrading - $XAUUSD$: New Week Perspective – Prioritize...StevenTrading - OANDA:XAUUSD $: New Week Perspective – Prioritize BUYING According to Elliott Wave 5, Awaiting Range $3961$
Hello everyone, StevenTrading is back with the Gold scenario for the new trading week!
After a period of strong volatility, I am leaning towards more buying scenarios according to Elliott Wave 5.
Although retesting deeper support levels is possible, the technical structure still shows potential for price increase.
Initially, the structure on H1 is showing that the price is moving sideways within a wide range.
We will watch the price range to trade before Gold officially breaks the barrier!1.
📊 TECHNICAL STRUCTURE ANALYSIS
Elliott Wave: Prioritize the development scenario of Wave 5. This reinforces the medium-term upward trend.
H1 Structure: The price is fluctuating within a wide range, creating opportunities for Scalping/Day Trade at the upper/lower boundaries.2.
🎯 DETAILED TRADING PLAN (ACTION PLAN)
Our trading strategy this week is to actively buy at the lower boundary and defensively sell at the upper boundary to maximize the price range.
Primary BUY Scenario (BUY Primary):
We will patiently wait for Gold to adjust to the $3961$ area, an important liquidity support zone (near the Buy Liquidity/Buy Zone on the charts).
This is an ideal entry point to join the upward momentum according to Elliott Wave 5.
The Buy order will be activated at $3961$ with a stop loss SL $3950$ (set below support $3954$) to preserve capital.
Profit targets are divided into ascending levels: TP1 $3975$, TP2 $3990$, TP3 $4012$, and the final target is $4035$ as the price approaches the upper boundary.
SELL Scalping Scenario: To defend and take advantage of the adjustment, we will watch to Sell just below the strong resistance area at $4050$ (near old resistances and barrier zones). The Sell order will be placed with a tight stop loss SL $4060$. Profit targets will be prioritized for short-term (Scalping) to quickly secure profits.3.
📌 SUMMARY & DISCIPLINE (Steven's Note)The goal is to patiently wait for $3961$ to execute the BUY position with the lowest risk, pursuing the Elliott Wave 5 target. Capital management discipline and compliance with SL are mandatory in this wide range trading phase.
Are you ready to take advantage of this price range?

The gold-driven logic behind the US attack on VenezuelaThe "black swan" shock in the global crude oil market: Venezuela, as an important member of OPEC, produces 1.2 million barrels of oil per day (accounting for 1.3% of global crude oil supply), and controls 18% of the world's proven oil reserves. If the US military strike causes the paralysis of its oil facilities (such as the Maracaibo Lake oil field and the Caribbean Sea ports being bombed), global crude oil supply will instantly decrease by 1.2 million barrels per day. Coupled with the fact that the situation in the Middle East has not yet eased, the Brent crude oil price may soar from the current $85 per barrel to $120-130 per barrel, reaching a new high since 2022.
The signal of restarting the inflation spiral: For every $10 increase in crude oil price per barrel, it will push up the US core CPI by 0.3-0.4 percentage points. If the oil price exceeds $120, the US CPI may return to above 4% in December 2025. This will completely reverse the market's expectation of "inflation moderation", and the demand for gold as an "inflation-resistant hard asset" will experience an explosive growth - during the 2022 Russia-Ukraine conflict, the inflation concerns triggered by the oil price increase led to a 5.8% weekly increase in gold prices. This scenario shock is even stronger, with a weekly increase of over 7%.
Next week's trading strategy and analysis
buy:4000-4010
tp:4025-4035-4100
sl:3995
Emotional Debt: The Hidden Cost of Revenge Trading“You don’t lose the most money when you lose a trade.
You lose it when you try to get it back.”
Every trader has felt it — that sudden urge to “win it back.”
You take one loss, then another, and before logic can speak,
you’re already in a new position — not to trade, but to heal.
That’s emotional debt —
The invisible weight carried from one mistake into the next.
What Is Emotional Debt?
Just like financial debt, it compounds.
A small emotional reaction today becomes a bigger one tomorrow.
You start trading your frustration, not your system.
You stop managing risk — because ego takes over management.
You don’t see charts anymore. You only see revenge.
How It Builds Up
Ignoring losses instead of reflecting on them
Measuring self-worth by daily profit or loss
Forcing trades to “prove” something to yourself
Confusing emotional recovery with market opportunity
The Interest You Pay
Emotional debt doesn’t just cost money — it costs focus.
It clouds your judgment, narrows your vision,
and pushes you further from the patience that once made you consistent.
Breaking the Cycle
Pause after every loss. Step away.
Write what triggered your next impulse.
Accept that no single trade can fix an emotional imbalance.
Remember: You are not your last trade.
When you clear emotional debt, you stop trading to recover —
and start trading to understand.
Let go of the need to get it back.
The market gives clarity only to those who stop chasing closure.
📘 Shared by @ChartIsMirror
Have you ever caught yourself trading from emotion instead of structure?
Share your thoughts — awareness begins with honesty.

GoldXAUUSD
- Resistance Level
- Bullish Channel as an corrective pattern in Long Time Frame
- RSI - Divergence
- Symmetrical Triangle as an corrective pattern in Short Time Frame
- Completed " 12345 " Impulsive Waves and " ABC " Corrective Waves

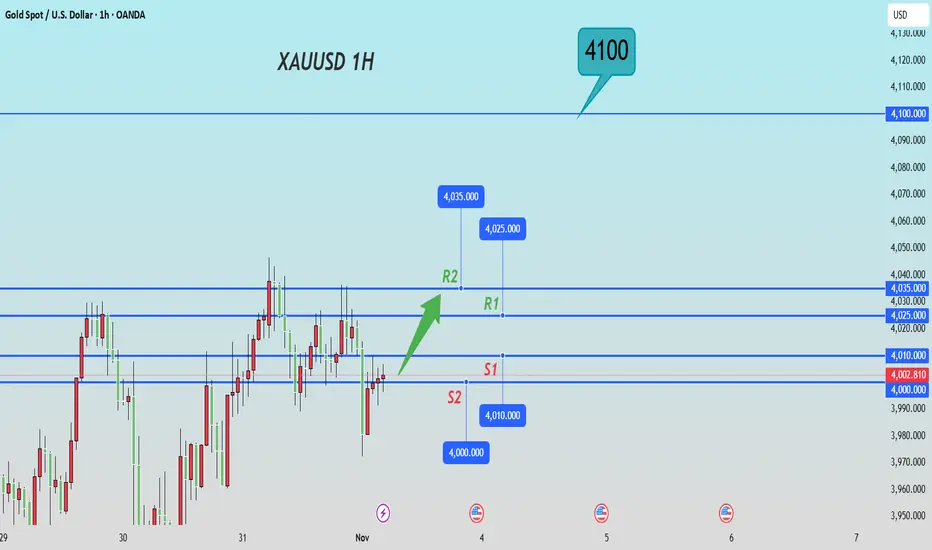
Gold Intraday Trading Plan 10/31/2025Gold has found support at 3920 yesterday and quickly went up. Currently it is at 4030 resistance. I will look to buy from 4000 and if 4030 is broken, it should test 4095. However, if 4000 is broken, gold may resume downward momentum.

XAUUSD Buy Setup - Bullish Continuation From 39661H chart shows strong bullish impulse followed by consolidation.
Price holding above structure — continuation likely if support holds.
Setup: Buy on pullback near 3980 with targets up to 4100.
Stop below 3865 to protect from invalidation.
‹ Educational analysis only. Not financial advice

Will gold fall below 3900 again on October 29?
Current Market Characterization: Volatile with a bearish bias. Gold prices have broken below the key psychological level of $4,000, indicating short-term technical weakness. The market is currently caught between long-term bullish fundamentals and short-term factors such as easing geopolitical risks and improved risk appetite. Ahead of the Federal Reserve's interest rate meeting, volatile and range-bound trading is likely to persist.
I. Core Market Logic
Short-Term Bearish Factors:
Technical Selling Pressure: Last week’s significant sell-off has led to further weakness in technical indicators.
Improved Risk Appetite: Signs of easing geopolitical tensions (e.g., trade negotiations) have reduced gold’s appeal as a safe-haven asset.
Break of Key Support: The loss of the $4,000 level (coinciding with the long-term uptrend line) has intensified bearish sentiment.
Medium- to Long-Term Supporting Factors:
Fed Rate Cut Expectations: The market has almost fully priced in a 25-basis-point rate cut in October, with another cut expected in December. This limits the downside for gold prices in the long run.
II. Key Price Levels
Bullish Defense Line: $4,020
If gold fails to reclaim and stabilize above this level, the short-term bearish trend is likely to continue.
Core Resistance Zone: $3,970 - $3,990
This area, formed by the 5-day and 10-day moving averages, serves as a strong short-term resistance zone and an ideal entry point for short positions.
Support Zone: $3,880 - $3,890
This is the current near-term key support band. If gold stabilizes here, a technical rebound may occur.
Breakdown Target:
If the $3,880 - $3,890 support band is decisively broken, bears will likely test lower support levels.
III. Intraday Trading Strategy
Primary Approach: Prefer selling on rallies, with light long positions at key support levels as a secondary strategy.
Short Strategy (Primary):
Entry Timing: Wait for gold to rebound to the $3,970 - $3,990 resistance zone and show signs of rejection before entering short positions.
Profit Target: Initial target at the $3,900 - $3,910 support band. Secondary target at $3,870 - $3,880.
Stop Loss: Place above $4,000.
Long Strategy (Secondary):
Entry Timing: If gold retraces to the $3,880 - $3,890 support band and shows signs of stabilization or reversal on shorter timeframes (e.g., 1-hour/4-hour charts), consider entering light long positions.
Profit Target: Aim for $3,950 - $3,970.
Stop Loss: Place below $3,870.
IV. Trading Discipline and Risk Warnings
Follow the Trend: As long as the price remains below $4,020, the overall strategy should favor selling on rallies rather than attempting to buy the dip against the trend.
Exercise Patience: Only execute trades when prices approach key resistance or support levels. Avoid impulsive trading in intermediate ranges and refrain from chasing the market.
Strict Risk Management: Market sensitivity is heightened ahead of the Fed meeting. Always adhere to stop-loss orders to mitigate risks from unexpected fluctuations.

XAUUSD: Market Analysis and Strategy for October 30Gold Technical Analysis:
Daily chart resistance: 4090, support: 3840.
4-hour chart resistance: 4050, support: 3890.
1-hour chart resistance: 4030, support: 3916.
Technical Analysis: Gold prices rebounded technically after falling nearly 5% over four consecutive trading days. The market faced short-term headwinds due to Powell downplaying the possibility of a December rate cut; however, widening divisions within the Federal Reserve regarding interest rate decisions have introduced new uncertainty to the market. Meanwhile, the trade easing agreement reached between the US and China has weakened safe-haven demand.
The daily chart shows a stepped decline, with four consecutive days of losses up to the previous trading day, and the moving average system has formed a death cross. After the European market opened today, prices rebounded rapidly. Short-term resistance levels to watch are 4010 and 4030. If gold can hold above 4010 and remain firmly above 4000, it will likely attract previous buying interest and resume its long-term upward trend. Conversely, if gold fails to recover and hold above 4000, selling on rallies is advisable.
Looking at the 1-hour chart, the moving averages have formed a golden cross, and the MACD/KDJ indicators are providing upward momentum. In the short term, focus on the continuation of the upward trend, paying particular attention to yesterday's rebound high of 4006 and the previous trading day's rebound high around 4030.
Trading Strategy:
SELL: 4050~4056 near
BUY: 3966~3960 near
More Analysis →
