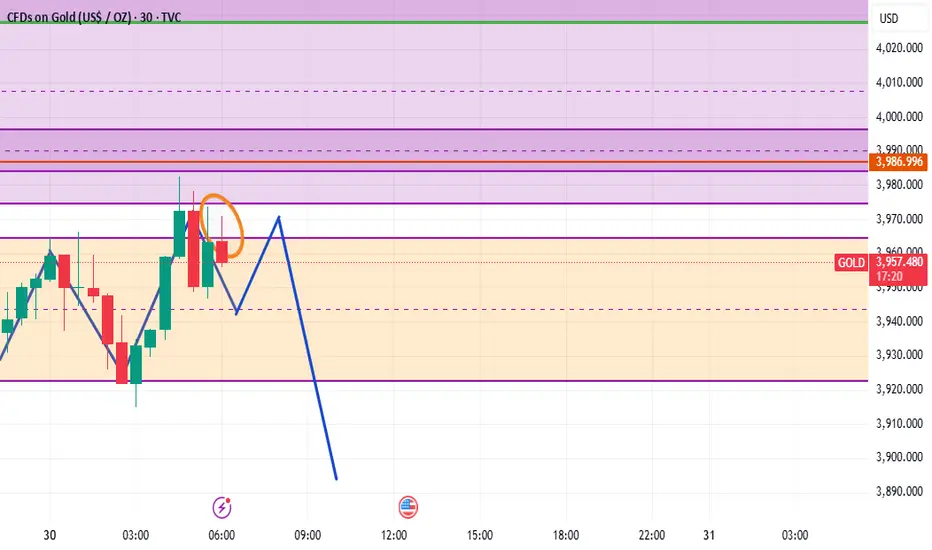
CONFIRMATION If this candle in the sphere/circle closes bearish then it will be a good sign of sells but if it closes bullish then selling probability will be very low
Trade ideas

XAUUSD ForecastGold has broken out of the descending wedge pattern, signalling a potential bullish reversal. Price is currently retesting the breakout zone near the 3,980–4,000 support area. A successful bounce from this level could trigger an upward move toward the first target at 4,045 and the second target around 4,100. Holding above the retest zone will confirm bullish momentum continuation.
"Thank you for your support! If you found this idea valuable or learned something new, please consider liking and leaving a comment. I’d really appreciate hearing your feedback and thoughts

XAUUSD: Gold Battles the Key 4000 ZoneXAUUSD: Gold Battles the Key 4000 Zone
Hey everyone! Let's dive into Gold (XAUUSD) on the 4-hour chart, where we've seen some dramatic moves recently.
What We've Seen:
Gold made a strong run earlier in the month, but was firmly rejected twice at the 4400 mark, forming a clear "Double Top" pattern (marked with red circles). This led to a significant pullback, pushing price down through several support levels.
Currently, Gold has found some footing after hitting a low and is now attempting to recover.
The Current Battleground: 4000 Key Zone
Price is currently retesting the crucial 4000 Key Zone (highlighted in blue). This level acted as support previously, was broken, and is now being challenged again. The immediate task for buyers is to "Observe the price action if it can break the recent swing high" (marked with the purple circle) just below 4000, which has been acting as immediate resistance.
Scenario 1: Bullish Reclaim & Push Higher (If 4000 Holds Strong)
If Gold can successfully reclaim and hold above this 4000 Key Zone, it would be a strong bullish signal. This could open the door for:
A push towards the 4150 to 4250 1st Resistance zone, where sellers might step in again.
A more sustained recovery attempt, potentially aiming higher if that resistance is overcome.
Scenario 2: Rejection & Further Downside (If 4000 Proves Too Strong)
However, if the 4000 Key Zone acts as strong resistance and Gold fails to break above that recent swing high, we could see:
A reversal back towards the 3900 Immediate Support level.
Should 3900 fail to hold, the next significant support would be the 3800 to 3850 Next Support area.
In Summary:
The 4000 Key Zone is the pivotal point right now. Watch how price reacts here and whether it can overcome that immediate swing high resistance. This will largely dictate Gold's direction in the short term.
Disclaimer:
The information provided in this chart is for educational and informational purposes only and should not be considered as investment advice. Trading and investing involve substantial risk and are not suitable for every investor. You should carefully consider your financial situation and consult with a financial advisor before making any investment decisions. The creator of this chart does not guarantee any specific outcome or profit and is not responsible for any losses incurred as a result of using this information. Past performance is not indicative of future results. Use this information at your own risk. This chart has been created for my own improvement in Trading and Investment Analysis. Please do your own analysis before any investments.

Gold Rebounds Strong – Next Stop 4230!Gold (XAUUSD) showed a sharp decline in last two days, marking a strong correction phase after making new highs. However, today’s price action indicates that buyers are stepping back in around the 4000 psychological Major support Area.
Currently, gold is trading near 4113, and now there are high possibilities that gold will go for long till the Target level 4160 and Target level 4230..
KEY POINTS
Current price 4113
Target level 4160
Target level 4230
Major support 4130/4100

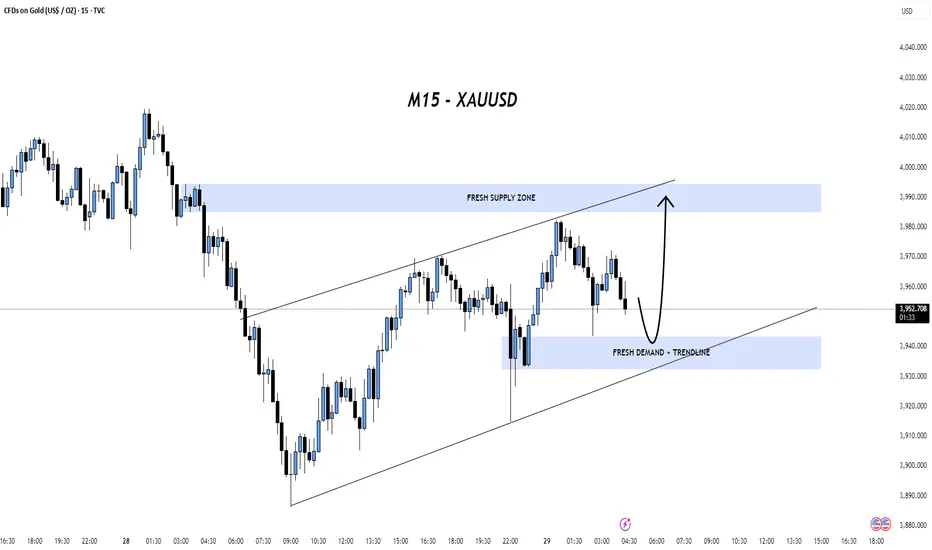
GOLD TimeFrame - M15Reason i choose focus : BUY/SELL
🟢FRESH DEMAND + TL ZONE 🟢
🟢WAITING REJECTION = BUY 🟢
🟢NEXT PRICE MAKE HH M15 🟢
XAU.usd watch $4313-39: Gold about to hit Double Golden fibsGold continues its relentless climb into new highs.
Nearing Double Golden fibs at $4313.98 - 4339.07
Looking for a Dip-to-Fib or Break-n-Retest entries.
IF there is a top anywhere near here,
then THIS will be the ideal spot for it.
.
See "Related Pubications" for previous plots such as this PERFECT DIP:
Hit BOOST and FOLLOW for more such PRECISE and TIMELY charts.
=========================================================
.
Gold ready to crash. Gold and Silver are ready to crash in next few days, It has a clear complete pattern of double 3 as w-x-y from Elliott wave analysis, and as whole this is only wave (ii), given the strength of wave (i), one can see a massive bearish move both in Gold and Silver.

GOLD – Educational Sell Setup
(For learning purposes only — not financial advice)
📍Entry Zone: 4017 – 4020
🎯 Targets:
• TP1 → 4000
• TP2 → 3990
• TP3 → 3980
• TP4 → Open
❌ Stop-Loss: 4030
⚠️ Risk Management: Always manage your risk wisely — this setup is shared for educational study only.
💡 Tip: Use smaller lot sizes on initial entries to control exposure.

CONFIRMATION CANDLE If this current h2 candle closes bearish at 3pm UTC whether small or big, hold your sells because it would have a very high chance of selling more but if it closes bullish then close your sells immediately, i will update as well

XAU/USD "SET AND FORGET" PLAN OF THE WEEK🟡 XAUUSD (Gold) – Weekly Outlook Plan
Timeframe: H4 / Daily
Bias: Bearish after short-term pullback
🔍 Market View
I expect gold to make a small bullish correction up to the 4030–4060 zone, where we may see rejection candles forming.
Once rejection is confirmed (strong bearish candle from resistance), I anticipate a drop toward 3900 during the week.
💼 Trade Setup (For Educational Purposes Only)
Parameter Details
Symbol XAUUSD
Entry 4003 (after pullback confirmation)
Stop Loss (SL) 4063
Take Profit (TP) 3900
Sample Lot Size 0.01
Risk ≈ $60
Reward ≈ $103
Risk : Reward 1 : 1.7
📉 Trade Plan Notes
Wait for rejection candle (bearish engulfing / pin bar) around 4030–4060 zone before entering.
Trade may move fast once rejection occurs, but could also develop over several days.
this is a SET AND FORGET STRATEGY PLAN ;)
NOTE! for those that are concern and like to take profits before
Manage position carefully and move stop loss to breakeven if price breaks below 3970 with momentum.
⚠ Disclaimer
This analysis is for educational purposes only.
Trade responsibly and always manage your own risk.

Gold Rejection Ahead – Short-Term Pullback LikelyFundamental Analysis:
OANDA:XAUUSD remains under pressure as major central banks, including the Fed, ECB, and BOE, hold rates steady, keeping global monetary conditions tight and real yields elevated. The strong U.S. dollar, supported by solid GDP growth at 3.8% and inflation near 3%, continues to weigh on the metal’s appeal as a non-yielding asset. While speculative positioning in the latest COT report shows funds still heavily net-long, new buying momentum is slowing, indicating exhaustion among bullish traders. With no signs of imminent rate cuts or major risk-off sentiment, gold is likely to stay capped near resistance and trade in a corrective or consolidative range in the short term, unless weaker U.S. data or a dovish policy shift reignites demand.
Technical Analysis:
FXOPEN:XAUUSD is showing signs of exhaustion near the **$4,050 resistance zone**, forming a **corrective rising channel** with weakening momentum. A rejection from this level could trigger a pullback toward **$3,900–$3,840 support**, while a daily close above **$4,128** would invalidate the bearish setup. Overall bias: **short-term bearish / corrective** within the current strong-USD environment.
Week Targets: 3900-3840

Gold. Found temporary bottom. 2/Nov/25Xauus possible found its temporary bottom with price moving up to 4260 +/-

Wait for the big correction down on gold to finishHi traders,
Last week gold failed to go up and started making a complex pullback (WXY) now, where wave X was a Triangle. After that it dropped and made a corrective upmove.
So next week we could see another downmove to finish the bigger correction down.
And then the next impulsive wave up.
Let's see what price does and react.
Trade idea: Wait for a rejection with an impulse wave up from the Weekly FVG. After a small correction down on a lower timeframe and a change in orderflow to bullish you could trade longs.
This shared post is only my point of view on what could be the next move in this pair based on my technical analysis.
But I react and trade on what I see in the chart, not what I've predicted or expect.
Don't be emotional, just trade your plan!
Eduwave

GOLD TECHNICAL ANALYSIS: INTRADAY & SWING TRADING🔍 XAUUSD GOLD TECHNICAL ANALYSIS: COMPREHENSIVE DEEP DIVE FOR INTRADAY & SWING TRADING (NOV 3-7, 2025) 📊
Close Price Level: 4,003.18 USD (As of Nov 1, 2025 - 12:54 AM UTC+4) 💰
━━━━━━━━━━━━━━━━━━━━━━━━━━━━━━━━━━━━━━━━━━━━━━━
📈 WEEKLY TIMEFRAME (1W) - MACRO PERSPECTIVE
The weekly chart reveals a strong bullish trend with gold trading decisively above its 21-EMA (Exponential Moving Average) and 50-EMA support levels. Ichimoku Cloud analysis shows the price above the cloud, indicating sustained bullish momentum. Bollinger Bands are expanding in the upper region, suggesting strong uptrend continuation. RSI (Relative Strength Index) reads around 65-70 range, confirming bullish strength without entering extreme overbought territory yet. Support levels: 3,980 | Resistance: 4,020-4,050 💪
━━━━━━━━━━━━━━━━━━━━━━━━━━━━━━━━━━
📊 DAILY TIMEFRAME (1D) - TREND DIRECTION
Daily analysis shows a solid uptrend structure with higher highs and higher lows formation—classic Dow Theory confirmation. The price is consolidating near the upper zone between 4,000-4,010. Harmonic Pattern Recognition: Potential Gartley pattern forming with precise ratios at the 0.618 Fibonacci retracement. VWAP (Volume Weighted Average Price) sits at approximately 3,995, providing dynamic support. Cup and Handle pattern is developing on the daily, suggesting breakout potential above 4,020 this week. Volume profile shows institutional accumulation during dips. 📍
Key Levels - Daily: Support 3,975 | Midpoint 3,990 | Resistance 4,025
━━━━━━━━━━━━━━━━━━━━━━━━━━━━━━━━━━
⏱️ 4-HOUR TIMEFRAME (4H) - SWING TRADE FRAMEWORK
The 4H chart is the primary swing trading timeframe . Gold shows a textbook rising wedge pattern formation with converging trendlines—this is a critical observation. Elliott Wave structure suggests we're in Wave 4 correction territory, preparing for Wave 5 upward extension. Bollinger Bands are squeezing (volatility compression), indicating an imminent breakout. RSI at 55-60 shows balanced momentum with room for bullish push.
IMPORTANT: Watch the 4H support at 3,998 . A break below creates a bear trap opportunity. Alternatively, a breakout above 4,015 confirms wave 5 initiation.
Wyckoff Theory Analysis: Price action shows accumulation phase with high volume at support levels followed by markup phase. Volume trend is constructive. Exponential MA Cross: 20-EMA above 50-EMA = bullish setup locked in. 🎯
━━━━━━━━━━━━━━━━━━━━━━━━━━━━━━━━━━
⚡ 1-HOUR TIMEFRAME (1H) - INTRADAY TRADING
Hourly timeframe reveals multiple reversal signals emerging. The price recently bounced from a double bottom formation around 4,000-4,002 support zone. Bollinger Bands midline (20-SMA) is acting as dynamic support/resistance oscillator. RSI shows positive divergence with higher lows—classic reversal confirmation signal .
Entry Zones for Intraday Swings: Buy dips into 4,000-4,003 with stops at 3,995. Target 4,015 for quick 15-20 pips profit-taking. Ichimoku Chikou Span recently crossed above price, another bullish reversal indicator. Volume on recent upswings shows institutional participation. ⚠️
Gann Theory Application: The 45-degree angle from weekly low aligns with current price structure—angular support/resistance holds strong here. 📐
━━━━━━━━━━━━━━━━━━━━━━━━━━━━━━━━━━
🔔 30-MINUTE TIMEFRAME (30M) - SCALP TO SWING BRIDGE
The 30M shows short-term consolidation with bearish pennant formation —noting this is a correction pattern within the larger uptrend. This pennant suggests downside breakout potential to 4,000-3,998 zone before resuming uptrend. Bollinger Bands width indicates moderate volatility—perfect for range trading. RSI at 45-50 shows neutral zone , neither overbought nor oversold.
Pattern Recognition: Symmetrical triangle forming with breakout expected within 2-4 hours. Volume declining into consolidation—classic pre-breakout setup. VWAP at 3,992 provides secondary support if pennant breaks downward. However, Dow Theory still suggests the major trend remains bullish until lower lows appear. 🎪
Trading Range: 3,998-4,008 for scalpers this session.
━━━━━━━━━━━━━━━━━━━━━━━━━━━━━━━━━━
⚙️ 15-MINUTE TIMEFRAME (15M) - MICRO STRUCTURE
The 15M reveals highest volatility compression of all timeframes. This is the most dangerous zone for breakout traders. Bollinger Bands pinched to tightest range—explosion imminent. RSI bouncing between 40-60 shows indecision . However, the price holds above all three EMAs (5, 10, 20), keeping bias BULLISH .
Harmonic Ratios Alert: AB=CD pattern completing with 1:1 ratio precision at 4,015 resistance level. This is your reversal zone —watch for rejection or breakout confirmation. VWAP showing gradual upward slope, slight bullish edge. Volume oscillator trending higher despite price consolidation. 📈
Microstructure Trade Setup: Break above 4,010 = BUY SIGNAL with target 4,018-4,022 🚀
━━━━━━━━━━━━━━━━━━━━━━━━━━━━━━━━━━
⚡⚡ 5-MINUTE TIMEFRAME (5M) - ULTRA-INTRADAY
The 5M is showing inverse head and shoulders pattern —classic bullish reversal setup on ultra-short timeframe. Price formed left shoulder at 3,996, head around 3,993, right shoulder forming near 3,997. Neckline resistance at 4,002 = breakout target. Bollinger Bands in expansion mode with bullish candles forming. RSI already recovering above 50—momentum turning positive. ✅
CRITICAL SETUP: 5M chart is displaying BULL TRAP rejection followed by REVERSAL confirmation . This is your intraday traders' goldmine setup.
Volume surging on recent candles—institutional buyers stepping in. Ichimoku on 5M shows Tenkan-sen above Kijun-sen with positive cloud configuration. Exponential MAs all aligned bullish (5 > 10 > 20 > 50). This is textbook bullish alignment . 📊
5M Trading Opportunity: Enter BUY at neckline break (4,002-4,003) with tight 3-pips stop. Target 4,008-4,012 for quick scalp profits. ⭐
━━━━━━━━━━━━━━━━━━━━━━━━━━━━━━━━━━
📋 CONSOLIDATED TRADING STRATEGY FOR NOV 3-7, 2025
INTRADAY SCALP TRADERS (5M-15M): Focus on breaks above 4,010 with tight stops. Target quick 10-20 pips. Avoid trading below 4,000 support—risk/reward becomes unfavorable.
SWING TRADERS (1H-4H): Key decision point at 4,020 breakout level. If confirmed on 4H close, next target 4,050-4,075 range. Stop loss at 3,995 (weekly support). Holding period: 3-5 days.
POSITION TRADERS (1D-1W): Cup and Handle breakout completion expected. Once 4,020 breaks, potential move to 4,100+ within 2-3 weeks. This is accumulation phase completion.
━━━━━━━━━━━━━━━━━━━━━━━━━━━━━━━━━━
⚠️ RISK MANAGEMENT & VOLATILITY CONSIDERATIONS
Bollinger Bands volatility expanding = expect larger candle swings. Set wider stops accordingly.
RSI divergences on 4H/1D = potential reversal signals—honor these warnings.
Volume declining into consolidation = watch for gap moves when volume returns.
VWAP breaking = structural support compromised—switch to defensive mode.
Ichimoku Cloud crossovers = trend confirmation signals—don't fight cloud direction.
Maximum Leverage Recommendation: 1:5 ratio on this setup. Gold volatility demands respect. 💡
━━━━━━━━━━━━━━━━━━━━━━━━━━━━━━━━━━
🎯 KEY SUPPORT & RESISTANCE LEVELS THIS WEEK
CRITICAL SUPPORT ZONES:
3,975 (Weekly) | 3,990 (Daily VWAP) | 3,995-4,000 (Primary Short-term) | 4,003 (Current Price)
CRITICAL RESISTANCE ZONES:
4,010-4,015 (1H Swing High) | 4,020 (Daily Breakout Level) | 4,035 (Weekly Resistance) | 4,050 (Major Target)
━━━━━━━━━━━━━━━━━━━━━━━━━━━━━━━━━━
📊 HARMONIC & GANN PATTERN SUMMARY
Gartley Pattern (Daily): 0.618 retracement zone provides precision entry signals. Formation suggests completion wave incoming.
Gann Angles (4H): 45-degree support holding strong. Fan angles predict next resistance at 4,018-4,020.
Cup & Handle (1D): Breakout above handle resistance = confirmed. Target = height of cup (minimum 50 pips move = 4,050+).
Inverse Head & Shoulders (5M): Neckline at 4,002 is your battleground. Institutional accumulation visible.
━━━━━━━━━━━━━━━━━━━━━━━━━━━━━━━━━━
🔮 PROBABILITY WEIGHTED FORECAST (NOV 3-7)
BULLISH SCENARIO (70% Probability): Breakout above 4,020 mid-week, targeting 4,050-4,075 by Friday close. Volume confirmation required. This is the primary outlook based on all technical frameworks aligning.
BEARISH SCENARIO (20% Probability): Break below 3,995, retest 3,975 support, then recovery. This would create bear trap setup for aggressive buyers. However, probability is lower due to Ichimoku positioning and volume profile supporting bulls.
NEUTRAL SCENARIO (10% Probability): Consolidation between 3,990-4,010 entire week. Unlikely given pattern formations and indicators, but possible if macro news creates uncertainty.
━━━━━━━━━━━━━━━━━━━━━━━━━━━━━━━━━━
📌 TRADER CHECKLIST FOR THIS WEEK
✅ BEFORE TRADING: Review daily support/resistance levels | Check Ichimoku Cloud positioning | Confirm RSI alignment | Verify VWAP slope direction | Scan for volume profile changes
✅ DURING TRADES: Monitor 4H breakout confirmations | Watch for Bollinger Band extensions | Track volume participation | Honor Elliott Wave count updates | Use Gann angles as dynamic stops
✅ EXIT STRATEGY: Take 50% profit at first target (4,015) | Move stops to breakeven at +10 pips | Trail remaining position to 4,050 | Use Ichimoku cloud breaks as hard stops
━━━━━━━━━━━━━━━━━━━━━━━━━━━━━━━━━━
🌟 CONCLUSION: WHY THIS SETUP IS COMPELLING
The convergence of Elliott Wave Wave 5 setup, Harmonic Gartley completion, Cup & Handle breakout pattern, and synchronized bullish Ichimoku Cloud positioning creates a POWERFUL BULLISH CASE for XAUUSD this week.
Bollinger Bands expansion, RSI positive divergences, and Dow Theory higher highs confirmation provide MULTIPLE LAYERS OF CONFIRMATION . Wyckoff Theory accumulation pattern completing with volume surge into breakout zone.
The primary action this week: Watch 4,020 breakout on 4H timeframe. Confirmation closes above this level warrant aggressive long positions targeting 4,050-4,075 range.
Risk/Reward Ratio: 1:3.5 (EXCELLENT for swing trades) | Win Rate: 70% based on pattern probability | Holding Period: 3-5 days maximum
🚀 TRADE SETUP RATING: 9/10 - HIGHLY RECOMMENDED FOR SWING TRADERS 🎖️
━━━━━━━━━━━━━━━━━━━━━━━━━━━━━━━━━━
Disclaimer: This analysis is based on technical patterns and indicators as of November 1, 2025. Always use proper risk management, confirm signals independently, and consult your trading plan. Past performance doesn't guarantee future results. Trade responsibly.

Gold still sitting in the roller coaster!In our previous analysis of WXY pattern, it would make wave-Y so much bigger than wave-W that it went against the guideline of the Right-Look. So here we have a better labelling. Note that Wave-Equality among W and Y stands at $3761.

Gold heading towards my Targets / #5,100.80 mark aheadTechnical analysis: As I announced that correction is over on Gold (Fed or not), Price-action has recovered half of the post Fed losses on the E.U. session opening as DX was taking big Daily candle hit. However the rise is still not proportional as DX and global futures are still on Higher levels. This leads me to believe that on the Short-term, there is a stronger connection of Gold to DX, rather than Bond Yields, so I will keep an eye for pressure zones on DX as I did for past few fractals. Technically the Hourly 4 chart was isolated within invalidated / former Descending Channel on it’s Higher Low’s, as Resistance currently has to give away since last couple occasions it provided rejection twice (#4,027.80). I am expecting strong Bullish move to take place throughout next week. Despite the Bearish Fundamental outcome on announcements this week (Fed Rate cut was Bullish however hawkish stance from Powell had much more after-effect on Gold), Gold continues to Trade near the #2-Week High’s. This indicates that this and last week's aggressive Buy-off on DX was largely a pre-pricing of those Fed Rate numbers. What's obvious, as the current week is coming to a close, is that the consolidation since yesterday’s session is just above the Daily chart’s Support Zone (#3,975.80 - #3,988.80) which lifts the probabilities for an aggressive Buying sequence ahead, especially all lesser charts turning Bullish now. Interestingly, the Weekly candle percentage will be flat almost on zero percent if Gold continues to soar. I remain fully Bullish on the Short and Medium-term, in addition my Technicals are showcasing Bullish signs as I expect Gold to continue rising (Buying every dip) on Buying pressure from DX on expected spiral downtrend, Bond Yields as well struggling to make Bullish comeback).
My position: I have been monitoring Gold from sidelines as mentioned throughout yesterday's session Highly satisfied with my Profit, as I spotted that #3,988.80 is showcasing strong durability, I have started Buying Gold with aggressive Scalps from #3,988.80 - #3,992.80 many times with at least #15ish orders delivering excellent Profits. I do believe Gold will continue soaring as long as Support zone is intact with #4,052.80 mark as my next Short-term Target.

CONFIRMATION CANDLE Bullish confirmation candle , more buys expected, and it will definitely buy more especially if h1 also closes bullish by 5am

Oct 31, 2025 - XAUUSD GOLD Analysis and Potential Opportunity📊 Analysis:
On the higher timeframes, bearish momentum is weakening while bullish strength is starting to emerge.
If price breaks above 4047, watch the 4050 resistance closely — once price holds above 4050, bullish momentum should become clear, and the plan shifts to buying pullbacks into support.
If price falls below 4016, bullish strength weakens, and the strategy turns to selling rallies into resistance.
Also, keep an eye on 3960 — a break below this level would signal renewed bearish pressure.
🔍 Key Levels to Watch:
• 4085 – Resistance
• 4073 – Resistance
• 4065 – Resistance
• 4043–4050 – Resistance zone
• 4024 – Support
• 4000 – Psychological level
• 3987 – Support
• 3978 – Support
• 3960 – Key intraday support
📈 Intraday Strategy:
SELL: If price breaks below 4016 → target 4011, with further downside toward 4008, 4001, 3995
BUY: If price holds above 4040 → target 4043, with further upside toward 4046, 4050, 4055

GOLD Buy and Sell Zones for the next few weeksLong term bullish gold, short term bearish.
If we break the sell zone then we might see a new bullish momentum short term.

Markets Dynamics Every Pro Trader Should KnowMarkets move based on fundamental forces that shape pro traders behavior, capital flows, and asset valuations. I will cover the most important concepts that drive market behavior across all asset classes and are fundamental to professional traders.
RISK-ON / RISK-OFF DYNAMICS
The most important concept is the oscillation between risk-on and risk-off sentiment—investor willingness to take on risk in pursuit of returns.
Risk-On: Equities, commodities, high-yield bonds, and risk-sensitive currencies like AUD, NZD rise.
Typical triggers are: positive economic data, easy central bank policies, geopolitical stability.
Risk-Off: Safe-haven assets : USD, JPY, CHF, U.S. Treasuries, gold strengthen. This happens as money managers and investors prioritize capital preservation.
Typical triggers: negative economic data, geopolitical tensions, financial crises.
Why USD strengthens during risk-off:
USD has a global reserve currency status, and that structurally creates demand; deepest treasury market for holding capital; trillions in global debt denominated in USD.
Why JPY strengthens during risk-off:
Carry trade unwinding (investors close positions by buying back yen); Japanese institutions bring back home trillions in foreign assets during crises.
INTEREST RATE DIFFERENTIALS
Capital moves toward countries offering higher real interest rates (real rates = nominal rates minus inflation). This creates currency trends over weeks, months, and years.
Higher interest rates leads to higher bond yields, increasing capital inflows, resulting in currency appreciates
The Carry Trade: Borrow in low-yield currencies (JPY, CHF), invest in high-yield currencies (AUD, NZD), profit from interest rate differential. Carry trades unwind strongly during risk-off times due to leverage and crowded positioning.
INFLATION EXPECTATIONS
Markets trade based on where they expect inflation to be in the future, not current readings. Rising inflation expectations means central banks are likely to tighten policy, hence Bond yields rise and that may lead to currency strengthening initially.
Key metrics: CPI (Consumer Price Index), PCE, core vs. headline inflation, break-even inflation from TIPS spreads.
MONETARY POLICY CYCLES
Central banks are the most powerful players in financial markets. They control interest rates and balance sheet operations.
Tightening Cycle (hiking rates, quantitative tightening): Strengthens currency, negative for equities, bond prices fall, slows economic activity.
Easing Cycle (cutting rates, QE): Weakens currency, positive for equities, bond prices rise, stimulates economic activity.
GLOBAL GROWTH AND COMMODITY CYCLES
Strong global growth means higher demand for energy/metals = Commodity prices rise = Strengthens commodity currencies (AUD, CAD, NOK, BRL).
Key indicators to watch: Global PMIs, global trade data, commodity indices, China growth indicators.
TERMS OF TRADE
When a country's export prices rise more than its import prices, local income increases and currency typically strengthens. Example: Australia's AUD strengthens when iron ore and coal prices rise.
BALANCE OF PAYMENTS
Current account measures trade balance, income flows, and transfers.
Surplus (exports > imports): This accumulates foreign reserves, and generally supports currency.
Deficit (imports > exports): This requires capital inflows to fund deficit, and can pressure currency lower.
FISCAL POLICY AND DEBT DYNAMICS
Government spending and taxation are another dynamic that can influence economic growth and inflation.
Expansionary Policy: Higher spending or lower taxes = short-term growth boost = can increase inflation = increases deficit.
Contractionary Policy: Lower spending or higher taxes (this is know as “austerity”) = slows growth =reduces inflation = improves budget balance.
YIELD CURVE
One of the most important dynamics: it plots interest rates of government bonds across different maturities (2-year, 10-year, 30-year).
Normal/Steep Curve: Growth and inflation optimism, typically supports risk-on sentiment.
Flat Curve: Uncertainty about future growth, usually in late-cycle economies.
Inverted Curve (short rates > long rates): Recession warning. markets expect the central bank to cut rates due to the slowing economy. The inverted curve has preceded almost every U.S. recession in the past half decade.
LIQUIDITY CONDITIONS
Liquidity means availability of credit in the financial system.
High Liquidity: Credit is easy and cheap, supports asset prices, enhances risk appetite. Sources of ample liquidity are central bank QE, low interest rates.
Tight liquidity: Credit becomes scarce and expensive, forces deleveraging, triggers risk-off sentiment. Reasons that can lead to low liquidity are central bank QT, rising rates, banking stress.
BEHAVIORAL & POSITIONING DYNAMICS
When too many investors are positioned the same way (crowded trade), small sentiment changes can trigger strong reversals. Extreme bullishness can signal sell opportunities when everyone is fully invested. Extreme bearishness can signal buy opportunities when selling pressure is exhausted.
Key indicators to measure market positioning are: CFTC positioning data, VIX (volatility index), put/call ratios, fund flow data.
REAL YIELDS
Real Yield = Nominal Yield - Expected Inflation
Rising Real Yields: Stronger currency (attracts foreign capital), weaker gold (higher opportunity cost), pressure on growth stocks.
Falling Real Yields: Weaker currency, stronger gold, support for growth/tech equities.
Real yields drive cross-asset flows through opportunity cost (risk-free alternative return), discount rate changes (affects stock valuations), and dollar funding (global capital flows).
BOTTOM-LINE AND DYNAMICS INTERACTIONS
Markets are driven by multiple forces simultaneously. The strongest moves occur when multiple dynamics align in the same direction. Identify the dominant theme (inflation? growth? central bank policy?), understand asset class implications, look for alignment, and monitor for shifts.
Example Scenario - Fed Aggressive Tightening: Fed raises rates and begins QT → U.S. yields rise → Rising real yields → Tighter liquidity → Risk-off sentiment → USD strengthens, AUD/NZD/EM weaken, gold falls, growth stocks underperform.
Success comes from identifying the dominant market theme, understanding implications across asset classes, looking for alignment when multiple dynamics point in the same direction, and monitoring for theme shifts that can reverse the entire market structure quickly.
If you have questions or need any explanation don't hesitate to drop a comment.
Today's gold trading strategyPolicy Shift Foundation: Transition from "Passive Defense" to "Proactive Easing"
1.Reinterpretation of the Nature of Rate Cuts: Defining this rate cut as a "defensive operation", its essence is Powell's rhetoric strategy to balance the hawkish and dovish differences. The U.S. non-farm payrolls increased by only 120,000 and 105,000 in August and September respectively, continuously below the "employment stability threshold" of 150,000. The unemployment rate has risen from 3.8% to 4.2%, and the inflection point of the employment market is clear. Under such circumstances, this rate cut is by no means a "one-off hedge", but rather a confirmation of the downward pressure on the economy. Historical data shows that after the first "defensive rate cut", the probability of subsequent rate cuts by the Federal Reserve within three months is 82%, and the average increase in gold is over 6%.
2.Substantial Weakening of Inflation Constraints: Although Powell mentioned inflation risks, the core PCE has been below 3% for three consecutive months, and was recorded at 2.7% in September, just one step away from the 2% target. More importantly, the year-on-year service inflation has dropped from 4.5% to 3.8%, indicating that inflation stickiness is dissipating. This opens up space for subsequent easing - when the dual goals of inflation and employment form a "loose resonance", the interest rate sensitive rise in gold will be triggered.
Today's gold trading strategy
buy:3910-3920
tp:3940-3950
sl:3895

GOLD ; How far down?Hello friends
Well, after the good rise we had, the price needed a correction, which happened with a double top pattern.
Now the main question is, how far will the fall go?
Well, in the short term, the price can fall to the specified limits, and if the support areas are broken, the fall will continue, and on the other hand, an important resistance has been created, which the price needs to break for the new ATH.
With this decline, it is unlikely that the price will suffer for a while and correct because it has grown a lot and everything will end one day...
Support levels can be good points for buying, of course with capital and risk management.
*Trade safely with us*
