Gold on side Swings on Fed aftermathAs discussed throughout yesterday's session: 'My position: I am Buying Gold aggressively throughout yesterday's session all along especially when #3,952.80 benchmark got invalidated to the upside. Gap to the downside on Asian market opening delivered excellent chances to Buy more as I closed all orders with #4,000.80 Take Profit. Keep in mind that I might Sell #4,024.80 now (aggressive Scalp to the downside) only to Buy more. #4,052.80 benchmark and #4,100.80 extension are my Targets.'
If you followed Trading plan I announced above, you would be in excellent Intra-day Profits. I have Sold Gold from #4,027.80 High's multiple times and re-Bought Gold from #4,004.80 especially delivering excellent results and altered all my Trading activity (no need to gamble on Fed Rate decision aftermath). My Profit is excellent and will sit out today's session as it will be full of side-Swings where I will continue comfortable Trading throughout tomorrow's session.
Trade ideas

This is just a rebound, not a reversal. Continue to short gold.The Fed's interest rate decision is highly anticipated, and the question remains whether gold bulls can stage a comeback. Gold is currently in a rebound and correction phase after an oversold condition. It's premature to declare a complete reversal of the bullish trend. Gold's rebound from its lows suggests a period of consolidation in the short term, awaiting the Fed's decision to determine its direction.
The 1-hour moving averages for gold continue their downward crossover, indicating that the bullish momentum hasn't fully materialized. However, there is gradually building support at lower levels. If a strong upward surge occurs before the Fed's decision, the bullish momentum may wane afterward. A break above 4020 would confirm a true V-shaped reversal for gold. Failure to break through 4020 suggests continued range-bound trading, with support around 3890. A hold above 3890 would likely lead to a rebound.
With the Fed's interest rate decision looming, let's wait patiently. Whether gold has finished its correction and whether the bulls have begun their counterattack remains to be seen. We'll observe the strength of the bulls after the Fed's decision. If gold breaks through and holds above 4020, the short-term upward momentum will increase.
Trading Strategy: Sell gold at 4010-4020, with a target of 3950-3930.

AT ENTRY Price is at our sell entry, let see how it goes because if it fails then we will likely see more buys during FOMC, but I strongly believe it will sell

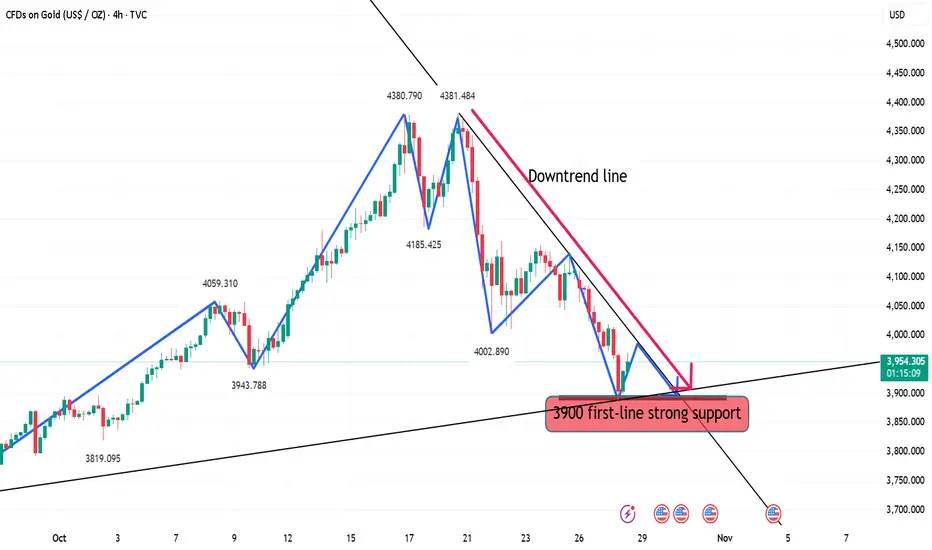
‘10.29 Buy first below 3900 and then sell!Technical Analysis:
The first resistance area above is 3960-70. Maintain a short position below this level. If the market unexpectedly breaks higher, focus on the 3995-4005 area, which remains bearish. If the market weakens, the 3945-50 area, previously the starting point for the rally, has become a source of pressure after breaking below it today.
Key support areas below are the 20-day moving average (SMA) at 3865-70 and the 50% level at 3840-45.
Trading strategy: Maintain a short position on rebounds.
Participate in the 3960-70 area, targeting a new low. After a new low, consider entering long positions based on the 20-day moving average and the 50% level.
28/10/68 : XAUUSD ( US Session )Using it from US Session until 11.00AM , I'll new analysis and update at 12.00PM
Resistance
3947-3953
3936-3942
3930
Support
3918
3907-3912
3896-3901

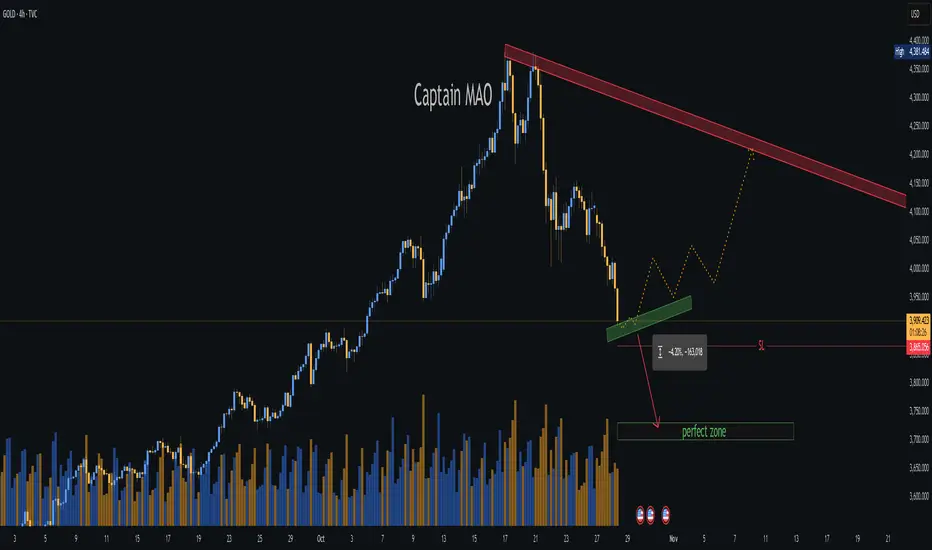
GoldGold break as last idea the liquidity line by wave a and correct the motive a by triangle as b wave and might be at MA2 zone soon
#MA_Strategy

XAU/USD – Make-or-Break Zone Sharp 11% Drop from Record HighBeen asked to analysis GOLD on current market structure
On October 20, 2025, Gold (XAU/USD) recorded a new all-time high at $4,383, marking a historic peak in the current macro cycle. Since then, the metal has retraced sharply by nearly 11%, bringing price action back into a critical decision zone — a true make-or-break level.
This area will define the next major directional leg. A strong bounce from current support could revalidate the long-term bullish structure and initiate another run toward ATH, while a breakdown below this zone may confirm a deeper correction before the next accumulation phase.
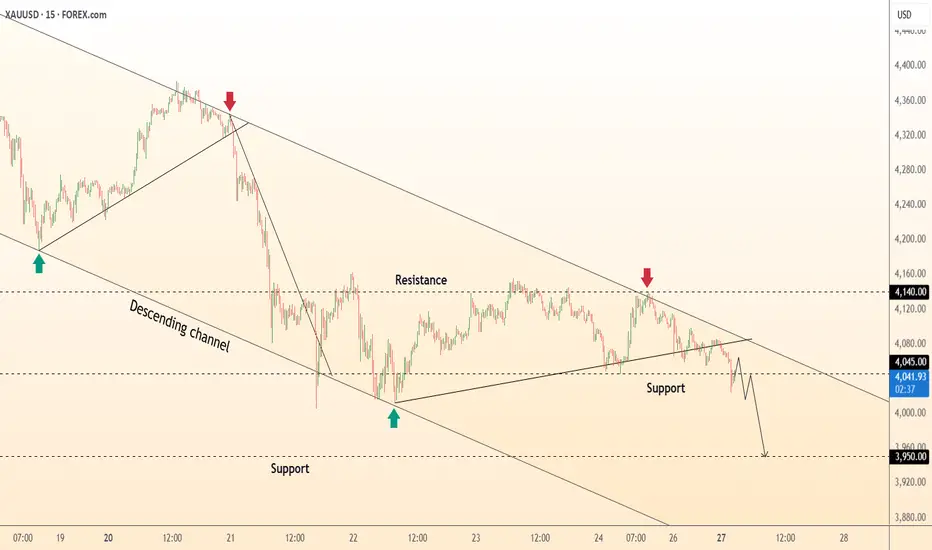
DeGRAM | GOLD is declining in the channel📊 Technical Analysis
● XAU/USD remains confined within a descending channel, forming consistent lower highs and lows, reinforcing bearish control.
● Price recently rejected the 4,140 resistance and is targeting the 3,950 support zone, confirming short-term continuation within the channel structure.
💡 Fundamental Analysis
● Gold faces pressure from a stronger USD and rising Treasury yields, as traders scale back expectations of early Fed rate cuts.
✨ Summary
● Short bias below 4,140; targets 4,000–3,950. Technical rejection and macro strength in USD sustain bearish momentum.
-------------------
Share your opinion in the comments and support the idea with a like. Thanks for your support!
xauusdgold has been on bulish momementum since janaury last year, and of recent it rand before given us another beautiful break of structure to 4k+, now i will like to see market see lower price before we.......

Gold Buying every local Low'sAs discussed throughout my Friday's session commentary: 'My position: I have been monitoring Gold from sidelines as mentioned throughout yesterday's session Highly satisfied with my Profit, as I spotted that #3,988.80 is showcasing strong durability, I have started Buying Gold with aggressive Scalps from #3,988.80 - #3,992.80 many times with at least #15ish orders delivering excellent Profits. I do believe Gold will continue soaring as long as Support zone is intact with #4,052.80 mark as my next Short-term Target.'
Technical analysis: The current Hourly 4 candle is already too Neutral to deliver continuation of Intra-day Buying sentiment and with Hourly 1 chart’s switch from Neutral to Bullish regarding the Short-term, Price-action limited the uptrend (even though Gold should be Higher, relative to circumstances and debacle on U.S. announcements), as Investors started taking Profits on their Buying orders and finding value within the #3,988.80 - #4,027.80 belt again (confirms U.S. sessions decline on unprecedented Volatility on Gold’s Price-action). The key is the Hourly 4 chart’s Resistance zone priced at #4,027.80 - #4,033.80 which rejected the Price-action twice (current Month) and has already done so throughout last week on multiple occasions. This is the key and if that configuration breaks, Short-term Buyers should take it to #4,052.80 impulse in extension. Otherwise, the #3,975.80 - #3,988.80 Support zone should be re-tested for a potential Double or Triple Bottom as in late September. The DX though got rejected on it’s Hourly 4 chart’s Resistance and it is due to the weak Bond Yields market that Gold isn't near #4,052.80 mark already, and it became obvious that market speculators were manually preventing the meltdown I have been mentioning, knowing that U.S. announcement will revive Buyers as in late June.
My position: I am taking advantage of Buying every local Low's since Friday's session last week, Buying either #3,988.80 Support with set of aggressive orders, or #3,992.80 Support in extension. I have Bought #4,001.80 as well towards #4,012.80 or above and will continue to do so until Gold is presented with a break-out to the upside. I do expect #5,100.80 benchmark on Medium-term.

SL Almost Hit – GOLD quick trade!SL was almost hit, but when you understand where the liquidity lies and which areas lack it, you won’t get shaken out by market moves. Believe in your plan — trade your plan.

XAU/USD Analysis — Awaiting Breakout Confirmation for Bull Entry🏆 XAU/USD GOLD vs U.S. DOLLAR 🏆
📊 Swing/Day Trade Opportunity Guide
🎯 THE THIEF STRATEGY SETUP
Market: Precious Metals | Pair: XAU/USD (Spot Gold)
Timeframe: Multi-Timeframe Confirmation
Strategy Type: Breakout + Dynamic Support/Resistance
💡 BULLISH CASE CONFIRMED ✅
The bulls are on patrol! 🚨 Multiple confluences suggest an upside move:
✨ LSMA (Least Squares Moving Average) acting as dynamic support with multiple touch confirmations — classic reversal signal for swing traders. The metal is respecting this lower boundary like a fortress wall.
⚠️ Breakout Confirmation Required: Watch for a decisive close above 4,060.00 — this level marks a critical moving average resistance zone. Once breached, this becomes our green light for layered entries.
💰 ENTRY STRATEGY: "THE LAYERING THIEF METHOD" 💎
Instead of FOMO-ing into one position, we deploy the layered entry approach — multiple limit orders like a professional accumulator:
📍 Buy Limit Layers (After Breakout Confirmation):
Layer 1️⃣: 3,920.00 ← Initial dip catch
Layer 2️⃣: 3,960.00 ← Continuation entry
Layer 3️⃣: 4,000.00 ← Mid-zone accumulation
Layer 4️⃣: 4,040.00 ← Final confirmation level
⚡ Pro Tip: Scale these layers based on your account size and risk tolerance. You can add more layers every $20-$40 intervals.
🔔 CRITICAL:
✋ Wait for breakout confirmation above 4,060.00 before placing any buy orders. Premature entries = Stolen profits going nowhere! ❌
🛑 STOP LOSS (Risk Management)
Thief SL Level: 3,880.00 🎯
This is where the heist ends if the plan fails. Close below this support = Exit the building! 🚪
⚠️ Disclaimer Note: This stop loss is suggested as a reference point. Your SL placement depends on your risk appetite, account size, and trading personality. We're not financial advisors — only fellow traders sharing our playbook! Trade at your own risk. 💪
🎪 PROFIT TARGET: "THE POLICE BARRICADE" 🚔
Target Zone: 4,360.00 🏁
Why this level? Multiple reasons converge here:
📈 Strong historical resistance acting as a "police barricade"
🔴 Overbought conditions signal potential pullback territory
⚠️ Trap zone detected — this is where smart money takes profits!
Strategy: Scale out your positions as price approaches this zone. Don't get greedy and lose the win!
⚠️ Disclaimer Note: This profit target is OUR suggested zone, but YOU decide when to take profits. The choice is yours — stack those wins or hold for more. No financial advice here, just trading wisdom shared among Thief OG's! 🎩
🔗 CORRELATED PAIRS TO MONITOR 📡
Watch these related instruments for confluence signals:
💵 USD Index ( TVC:DXY ) — Inverse relationship with gold. If DXY weakens → XAU/USD strengthens. Monitor for divergence opportunities.
🏦 SPX500 ( CAPITALCOM:US500 ) — Risk sentiment indicator. Rising stocks = potential gold weakness. Use as confirmation filter.
FX:EURUSD — EUR strength = potential gold support. Cross-market divergences often precede major moves.
FX:GBPUSD — Pound weakness often correlates with gold rallies. Track for multi-timeframe alignment.
TVC:US10Y (10-Year Treasury Yield) — Inverse correlation. Rising yields = headwind for gold. Monitor daily for macro context.
📋 QUICK CHECKLIST ✅
Confirm LSMA support holds
Wait for 4,060.00 breakout confirmation
Place layered buy limits at 3,920/3,960/4,000/4,040
Set stop loss at 3,880.00
Scale profits into 4,360.00 resistance zone
Monitor correlated pairs for confluence
Respect risk management — never exceed 2% per trade
🎬 THE BOTTOM LINE 🎬
Gold is setting up for a potential swing trade move. The LSMA support is holding, and a breakout above 4,060.00 could trigger a run toward 4,360.00. Use the layering strategy to build positions methodically, protect capital with your chosen stop loss, and exit into resistance zones.
This is a confluence-based breakout play — not a guarantee, just probability on our side. 🎲
✨ If you find value in my analysis, a 👍 and 🚀 boost is much appreciated — it helps me share more setups with the community!
#XAU/USD #GoldTrading #TradingStrategy #SwingTrade #DayTrading #ForexAnalysis #TechnicalAnalysis #ThiefStrategy #LSMA #BreakoutTrading #RiskManagement #TradingCommunity #MarketAnalysis #Commodities #MetalsMarket

GOLD BUY TRADE IDEA • Market Context:
Price is currently consolidating after a bullish correction. We can see a series of higher lows forming, suggesting potential bullish continuation if liquidity grabs are complete.
• Key Levels:
• Zone A (Demand): Around $3,920 – $3,940
→ Deep liquidity grab or final mitigation zone before a major push upward.
• Zone B (Intermediate Demand): Around $3,970 – $3,980
→ Shallow pullback zone that could serve as the first area of interest for a short-term buy entry.
• Resistance: $4,047 – $4,050 (previous high / liquidity pool)
• Current Price: Around $4,016
⸻
Trade Scenarios
Scenario A (Deeper Entry / Swing Setup)
• Wait for price to drop into Zone A ($3,920–$3,940) for a deeper liquidity sweep.
• Confirmation: Bullish engulfing / Break of structure to the upside.
• Target: $4,047 (previous high).
• Stop-loss: Below $3,910 (structure invalidation).
Scenario B (Shallow Entry / Continuation Trade)
• Buy from Zone B ($3,970–$3,980) after a small retracement.
• Confirmation: Rejection candle or lower timeframe bullish BOS.
• Target: $4,040–$4,050 region.
• Stop-loss: Below $3,960.
⸻
Bias:
📈 Bullish, provided price respects either demand zone (A or B) and continues to form higher lows.
Trader’s Note:
• Patience is key — wait for clear rejection or structure shift before entering.
• Zone A offers a better R:R for swing setups, while Zone B favors intraday trades.
• Watch for news volatility (USD events).


Hey everyone! Great to see you again — let’s talk about XAUUSD!From a fundamental perspective, gold has been holding its ground pretty well, even as the US dollar regained some strength following Fed Chair Jerome Powell’s comments earlier this week. Despite the short-term USD recovery, overall sentiment around gold remains supported by lingering uncertainty in global markets.
On the technical side, gold recently found solid support around the $3,900 zone — a key psychological level where buyers have stepped back in. Since then, price action has shown clear signs of strength, breaking back above short-term resistance levels and reclaiming structure. The EMA 34 is now curling upward toward the EMA 89, hinting at a potential bullish crossover in the making.
With that shift in momentum, I’m now watching for a continued move higher toward the $4,080 area — a level that lines up nicely with the next major resistance zone on the 4H chart.
💡 My view: As long as gold holds above $3,900, the path of least resistance looks to be to the upside. A clean break and close above $4,050 could open the door for a test of $4,080 in the coming sessions

GoldXAUUSD
- Fair Value Gap
- RSI - Divergence
- Completed " 12345 " Impulsive Waves and " ABC " Corrective Waves
- Demand Zone
- Bearish Channel as an corrective pattern in Short Time Frame

WAIT FOR BETTER ENTRY Gold is at no trade area, FOMC interrupted the buy signal yesterday so it may not to buy for long, maybe a buy to 3955 then it starts selling, the major buy will start from any moment after 1st November and if it fails then we will sell for a longer time but looking at last week CPI y/y and reduced rates yesterday the buy will likely start with momentum after November 1,
i will update it from November 1 if the buy hold or if it decides to sell more .

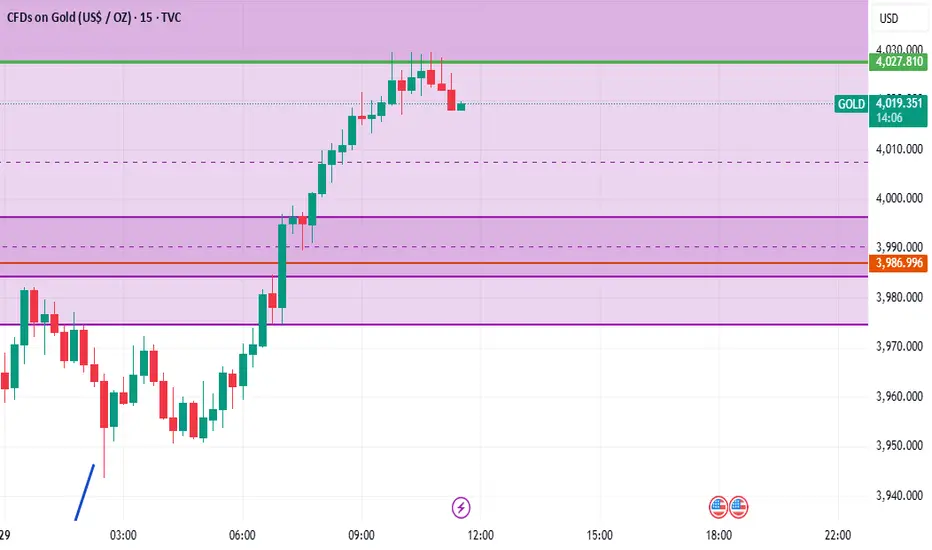
XAUUSD 1H Analysis (30th October 2025) ASIA/LONDON SESSION IDEAHey Guys,
BUY/SELL SCENARIOS:
BUYS:
1) Body Candle Close above the 3985.96 level.
2) Retest the failed 1h Bearish FVG at the 3985.96 level.
3) Create a 3/5m Bullish Engulfing Candle to capitalize on BUYS towards the 4139.00 level.
SELLS:
1) Retest the 1h Bearish FVG at the 3979.98 level.
2) Create a 3/5m Bearish CHOCH with a body candle close (with a FVG)
3) Retest the 3/5m Bearish CHOCH Level to capitalize on SELLS towards the 3838.00 level.
Trade smart, Trade safe, Trade according to your trading plan and don't FOMO!

Gold longGold is looking good for long.
Sl might hit, but i m going to take the risk here because it is worth i.
If we sweep PDL i will reconsider entering longs.

Gold Trade Set Up Oct 29 2025Price shifted to bullish structure, closing above 1h swing high and making HL/HH on all smaller time frames so i want to see a sweep of 15m SSL and/or tap into 15m demand followed by a 5m up close candle to target EQH above

SOME INSIGHT I POSTED MONDAY YOU CAN GO THROUGH
SOME INSIGHT I POSTED MONDAY YOU CAN GO THROUGH
Gold showed a buy signal last Thursday because it was supposed to sell and it failed, that is a buy signal there but it comes with technicalities, so immediately i saw it, i posted buy around 4090 and i guess price retraced down to 4091.7 and started buying and hit around 4140 and i thought it would buy more( but it was a buy to create a lower high which start like a major buy until it fails to move above a zone), but it closed somewhere around 4130 and after analyzing Thursday evening i realized, it will buy friday, but it would sell to test a major zone before the buy start with momentum so signaled a sell first before the buy Thursday,
On Friday midnight to dawn i gave a sell to somewhere 4050 and i gave a buy around morning time and was firm on that and entry was at 4065-60 sl was at 4040, and CPI drops in the afternoon , i thought what if CPI pushes it below 4040 with a sharp move before the buy start because i strongly believed it will buy but CPI is a dangerous news.
Immediately CPI dropped it moved up so I went to check the CPI and saw that m/m data was lower than expected and previous which is disinflation short term and therefore a possible bearish gold short term and y/y CPI was higher than previous which is inflationary long term and therefore a bullish gold after the short term sells, and so i anticipated the sells especially after price failed to close above 4130 but i still needed a confirmation and an hour or two after markets opened yesternight it signaled sells and thus today sells.
So there is a possible heavy buy lately by early next month which will be driving by the y/y CPI and an already priced in Fed's rate cut this Wednesday and a higher time frame buy , i don't trade only based on fundamentals, i check to see if they will lead to a change of trend and to be alert but my trades and analysis are pure price action/ technical analysis and no indicator , my brain and eyes always work together to determine price next possible move and not any indicator
Gold Outlook Ahead of FOMC: Dovish Fed Could Push Prices HigherGold Outlook Ahead of FOMC: Dovish Fed Could Push Prices Higher
As the market eyes tonight’s FOMC decision, volatility in Gold (XAU/USD) is expected to spike. Traders are pricing in a 97% probability of a 25 bps rate cut, from 4.00% to 3.75%, making the Fed’s tone a key determinant for the USD and Gold direction.
1️⃣ Fundamental Outlook
Rate Cut / Dovish Tone: Likely to weaken the USD, supporting a bullish move in Gold.
No Cut / Hawkish Tone: Strengthens USD, which may trigger a Gold correction.
Recent data shows softer inflation and slowing job growth, tipping the scales toward a dovish outcome. This aligns with a short-term bullish bias for Gold.
2️⃣ Technical Overview (H1–H4)
Gold is currently in a descending channel—a short-term correction within a larger bullish structure. Key levels to watch:
Type Price Comment
Resistance $4,078–$4,100 Channel top & supply zone
Intraday Resistance $4,050 Potential liquidity grab area
Support $3,947 Intraday demand zone
Major Support $3,874–$3,878 Monthly SMC demand block
Liquidity Zone $4,005 Equal highs area pre-FOMC
The monthly support at $3,874–$3,878 has been strongly defended, indicating institutional buying interest.
3️⃣ Price Action & SMC Bias
From a Smart Money Concepts (SMC) perspective:
A sweep below $3,880 created a strong reversal block, signaling accumulation by institutions.
The market is now in a reaccumulation phase, targeting premium levels for liquidity grabs before the FOMC.
Order Blocks to Watch:
Bullish OB: $3,875–$3,900
Bearish OB: $4,078–$4,100
Price may test above $4,050 to collect stop orders, then react sharply based on the FOMC outcome.
4️⃣ Trading Plan (Scenario-Based)
🟢 Bullish Case (Rate Cut / Dovish Fed):
Entry: Break & close above $4,050
SL: Below $4,020
TP1: $4,078 | TP2: $4,135 | TP3: $4,249
SMC View: Break above channel → imbalance fill toward $4,135–$4,250
🔴 Bearish Case (No Cut / Hawkish Fed):
Entry: Rejection from $4,050–$4,078 zone
SL: Above $4,110
TP1: $3,947 | TP2: $3,874 | TP3: $3,820
SMC View: Premium zone manipulation → continuation of bearish channel correction
5️⃣ Strategic Summary
Bias Setup Action
Short-term Bullish if rate cut confirmed Wait for breakout above $4,050
Medium-term Consolidation until FOMC volatility clears Trade reaction, not anticipation
Long-term Still bullish as long as $3,874 holds Potential expansion toward $4,249+ in November
Conclusion:
Gold traders should monitor the $4,050 breakout zone for clues. A dovish Fed could propel Gold toward $4,249, while a hawkish surprise may see it revisit $3,874. Reacting to price action post-FOMC is key—anticipation could be risky.

