XAUUSD LONG 28/11Greetings,
Hello traders, this is the XAU-USD 15m important support zone.
Based on market trend and previous day movement.(white line)
Key levels;
Entry: 4163.21
Target: 4173.21
Stop loss: 4153.21
Risk Reward Ratio 1:1
Your likes and boosts motivate us to keep learning and sharing ideas!
Trade ideas

11.27 Asian early-sessiong plan for goldI. Best Execution Outcome of Yesterday’s Strategy
Combined with yesterday’s European/North American session strategy and the current chart:
Long Strategy: If you entered a long position in the 4154-4158 zone during yesterday’s European session, the price peaked at 4168.78 (near the first target of 4170), locking in ~10-14 pips of profit. Holding into the North American session would still reach the first target of 4168, but volatility narrowed due to the Thanksgiving holiday, so 4172 was not breached.
Short Strategy: Yesterday’s North American session did touch the 4170-4172 short entry zone, but no clear reversal signals (e.g., bearish engulfing/shooting star) emerged — so the short setup was not triggered (this counts as a prudent wait for valid confirmation).
II. Trading Strategy for Today (Thanksgiving Holiday)
Key Pre-Reminder: Given the U.S. Thanksgiving holiday (low liquidity, early market close, and muted volatility), avoiding trading entirely is the most risk-averse and suitable choice for today.
If you still choose to participate (for small-scale practice), use an extremely conservative range-trading plan:
1. Core Approach
Stick to micro-range scalping only (no trend trades — low liquidity drastically raises false breakout risks).
2. Minimal-Risk Trading Plan
Range Boundaries: 4158 (support) → 4168 (resistance)
Long Setup: Enter only if price hits 4158 with a clear hammer candlestick; position size: ≤3% of total capital; Stop-loss: 4155; Take-profit: 4165.
Short Setup: Enter only if price hits 4168 with a clear shooting star; position size: ≤3% of total capital; Stop-loss: 4171; Take-profit: 4162.
3. Non-Negotiable Holiday Rules
No overnight positions: Close all trades before 19:00 UTC (well ahead of the early North American close at 22:00 UTC).
Strict position limits: Do not allocate more than 5% of total capital to trades today.
Prioritize inactivity: If no clean signals appear within 1 hour, step away — sitting out is the best choice for holiday markets.
GOOD LUCK!
LESS IS MORE!

XAUUSD is ready for a deeper correctionA Historical Run
For the last 2 months, Gold ( OANDA:XAUUSD ) was an absolute monster. Near vertical move. All pullback shorts were destroyed. The momentum was just intense.
Corrective Structure
As all impulsive moves must, the rally is now exhausted , and we are in a corrective phase. Price is no longer going up, but it is consolidating.
What's Next?
The current wave down appears to be shaping into a bearish AB=CD.
In a classic AB=CD pattern, the length of the CD leg must equal the length of the AB leg.
I will not be looking for any long setups until price reaches $3700~3770 range, and shows signs of reversal.
Until then, my view is still bearish on XAUUSD. I'm expecting a pullback testing the previous resistance ($4150) then continuation to the down side.
Good Luck!

“BOS Confirmed — Demand Retest for Next Bullish Leg🟡 GOLD (XAU/USD) – Bullish Continuation Setup from High Probability Demand Zone 🆙
🔍 Chart Breakdown & Key Insights
Price created a Break of Structure (BOS) to the upside → confirming bullish momentum ✔️
Retested the Demand Line + Support Zone → buyers defending strongly 💪
High Probability POI (previous accumulation zone) remains valid with liquidity swept below → smart money accumulation evidence 💰
Current pullback = healthy retracement into demand before potential continuation
🎯 Targets (With stickers)
🎯 Target Zone Price Region Sticker
TP1 → Retest recent high 4,165 – 4,175 🎯
TP2 → Liquidity above highs / extended target 4,180 – 4,195 🚀💸
TP1 hit possibility is HIGH due to bullish structure 📈
TP2 depends on strength of breakout ⬆️
📌 Trade Idea (High Probability Setup)
🟩 Buy Entry Zone:
➤ 4,120 – 4,130 (pullback entry at support)
🟢 Take-Profit:
➤ TP1: 4,170 – TP2: 4,190
📊 Risk-Reward Ratio: 1:2.5 – 1:3+ ✔️
🧭 Market Structure Sentiment
Factor Outlook
Trend Bullish 📈
Liquidity Upside still available 💧
Smart Money behavior Accumulation & continuation expected 💼
⚠️ Just watch if price breaks below the demand line → would weaken this bullish plan.

Range Trade. Defining clear sell and buyThe price is currently consolidating within a well defined range, This strategy aims to sell at the top of range sell zone and buy at the bottom buy zone, capitalizing on the repeated price reaction at these key levels.
Risk Warning:
This strategy works until the range breaks. Be prepared for a breakout and have a plan to re enter in the direction of break. Always use a stop loss. This is not financial advice.

XAUUSD in rangbound At moment market is in rangbound from 4030-4080 area rejected multiple times .
What are my conditions For Today's setup?
-I’m watching for a buy trade at 4030-4040 zone and my target remains 4080 then 4120 in extension.
Secondly if H4 closed below 4025 then market will test 3975-3985.
Unmute FOREXLAB for 24/7 updates

XauusdIn the H1 Timeframe, we have a QMC Level.
I think, price will go down to ( 4049-4043) and then it will go up to 4100.🌹

gold buy Idea How to Trade It
1️⃣ Wait for a Pullback
Let price retrace to the 61.8% or 50% Fibonacci levels.
2️⃣ Drop to the 5m Timeframe
On the pullback, look for rejection signs at either the Fib levels or the 200 EMA.
3️⃣ Entry Confirmation
Only enter if you see one of the following with strong volume:
Bullish engulfing candle
Pin bar rejection
These signals show buyers stepping in.
Trade Invalidation
❌ If price closes below the golden Fib levels with a strong bearish candle, cancel the trade.
Alternatively, wait for price to close back above the 200 EMA or the golden Fib levels, then look for the same confirmations again.

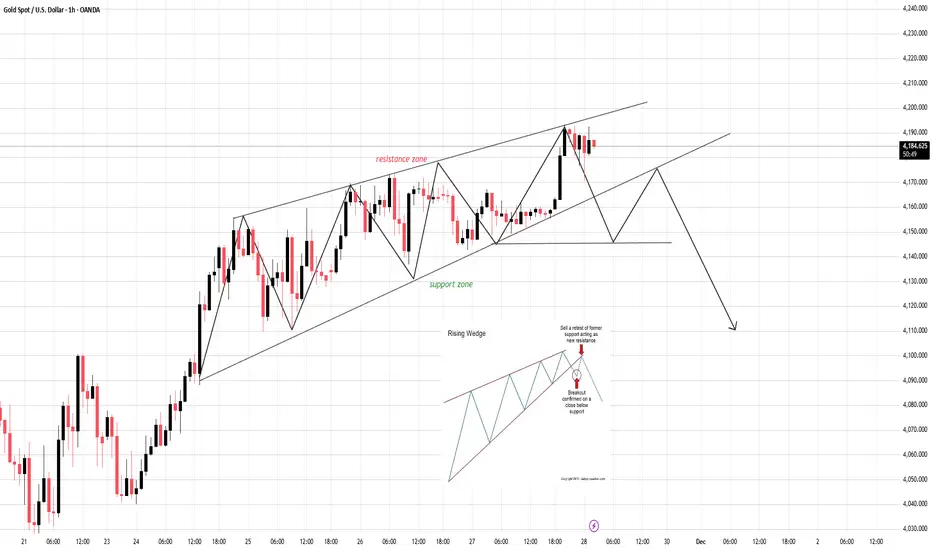
Rising Wedge on the Edge — The Breakdown Is Only One Candle AwayCURRENT MARKET ANALYSIS & TODAY’S EXPECTED MOVE
1. Current Market Structure
The market is currently respecting the structure of a Rising Wedge — a pattern where price continues rising but momentum weakens, volatility compresses, and the probability of a bearish breakdown increases.
Key observations:
- Price is moving near the upper boundary of the wedge.
- Newly formed highs lack strength → buying pressure is fading.
- Recent candles show long upper wicks, indicating strong sell pressure at resistance.
- The lower support line has been tested multiple times, increasing the likelihood of a breakdown.
- Buyers are losing control while sellers are beginning to step in.
2. Primary Scenarios for Today
✓ Scenario 1 – Breakdown of the Rising Wedge (High-probability scenario)
If a candle closes decisively below the lower support, the market is likely to:
- Drop quickly toward the next support levels.
- Trigger strong seller participation on the retest of the broken trendline (support → resistance).
- Confirm a high-quality SELL entry.
Downside Targets:
- Target 1: Nearest support zone
- Target 2: Previous low of the wedge
- Target 3: Major support below (depending on your timeframe)
✓ Scenario 2 – Price holds but remains weak
If price bounces from the lower edge but fails to break the upper boundary:
- The structure remains weakly bullish but vulnerable.
- Any upward move is fragile and easy to reverse.
- Not suitable for chasing BUY positions.
- Bulls need a strong breakout above the upper trendline to reverse the bias — which currently has a lower probability.
3. Intraday Trend Bias
Today’s intraday bias remains: DOWN (or at least corrective to the downside).
Confirmation signs:
- Support becomes easier to break the more it is tested.
- Volume is weak on bullish moves.
- Price action is tightening → preparing for a breakout.
- Sellers will wait for a clean retest, as shown in your reference chart.
4. Conclusion
The market is approaching the end-phase of a Rising Wedge, a classic bearish reversal pattern.
Priority today: Wait for breakdown → retest → SELL.
Avoid chasing BUY setups due to high reversal risk.
Expected development:
Break support → Retest → Continue dropping
“Your edge is built from discipline — not every setup must be traded, but every trade must follow your plan.”
Drop your market bias in the comments — do you expect the breakdown or a surprise breakout?
XAUUSD — PRO ANALYSIS (27/11/2025, ASIA SESSION)1. Market Overview
Gold is currently consolidating inside a tight intraday range 4154–4168, holding above the 200MA while failing multiple times to break the 4171–4173 supply zone. Current conditions show compression, suggesting liquidity buildup for Asia before London expansion. Macro bullish structure remains intact but short-term direction is indecisive until breakout occurs.
⸻
2. Technical Breakdown
D1
• Macro bullish trend structure remains active.
• RSI mid-zone → momentum neutral, market waiting for catalyst.
• Price capped by trendline + supply at 4171–4173, support below at 4140–4127.
H1
• Higher-low structure still intact above 4140.
• Price hovering below mid-term resistance 4168–4173.
• Break above = bullish continuation → 4183/4198.
• Break below 4140 = structure shift → deeper correction likely.
15M–5M
• Compression wedge forming — equal highs & equal lows visible.
• MACD flattening → energy building, expansion incoming.
• Manipulation highly likely before directional move.
⸻
3. Fibonacci Analysis
Swing Measured: 4140 → 4171
Level Price
38.2% 4159
50% 4155
61.8% 4151
🟦 Golden Zone: 4159 – 4151
Ideal retracement for long entries — only valid if structure confirms.
⸻
4. High-Probability Trade Scenarios
📉 SELL Setup (Primary Bias)
Sell Zone: 4168 – 4173
Targets: 4159 → 4151 → 4140 → 4127
SL: Above 4180
Confirmations Required:
• 5M CHoCH
• Rejection candle + MACD momentum shift
⸻
📉 SELL Breakout Setup
Trigger: Clean break & retest below 4140
Targets: 4127 → 4114 → 4105
SL: 4159
Bias strengthens if volume increases with break.
⸻
📈 BUY Setup (Countertrend)
Buy Zone: 4159 – 4151 (Golden Zone)
Targets: 4164 → 4168 → 4173
SL: 4146
Only trade with BOS + clear bullish rejection.
⸻
📈 BUY Breakout Setup
Trigger: Break + hold above 4173
Retest Entry: 4168–4171
Targets: 4183 → 4198 → 4220
SL: 4159
⸻
5. Fundamental Watch
• Asia normally sets range → main move expected London/US.
• DXY direction will decide breakout strength.
• Expect liquidity sweeps at extremes before expansion.
⸻
6. Key Technical Levels
Type Levels
Resistance 4164 / 4168 / 4173 / 4183
Support 4155 / 4151 / 4140 / 4127 / 4114
Break Buy Trigger > 4173
Break Sell Trigger < 4140
⸻
7. Analyst Summary
Gold is coiling inside consolidation — breakout pending.
Sell bias active below 4173, with momentum favouring downside into 4159 → 4151 → 4140.
Bullish continuation only confirmed after 4173 breakout hold.
Patience > prediction — wait for trap/sweep before entries.
⸻
8. Final Bias Summary
Bearish-leaning range.
Sell rejection 4168–4173, Buy only 4159–4151 if confirmed.
Breakout levels decide next wave.
⸻
🥇 ElDoradoFx PREMIUM 3.0 – PERFORMANCE 26/11/2025 🥇
⚡ Smart Entries. Consistent Wins.
📈 BUY +200 PIPS
📉 SELL +60 PIPS
📉 SELL +20 PIPS
📈 BUY +50 PIPS
📉 SELL +20 PIPS
📉 SELL +60 PIPS
📈 BUY +100 PIPS
━━━━━━━━━━━━━━━
💎 SWING TRADES – STILL RUNNING
🔵 BUY → +2,850 PIPS
🟣 BUY → +1,730 PIPS
📊 Long-term setups maintaining bullish structure while intraday precision continues delivering steady gains.
━━━━━━━━━━━━━━━
💰 TOTAL PIPS GAIN: +510 PIPS
🎯 7 Signals → 7 Wins
🔥 100% Accuracy
━━━━━━━━━━━━━━━
✅ Another flawless trading day — precise setups, clean executions, and consistent results!
Stay tuned for tomorrow’s continuation 📈
— ElDoradoFx PREMIUM 3.0 Team 🚀

GOLD Buying Trade idea From the Support LevelHello Traders
In This Chart GOLD HOURLY Forex Forecast By FOREX PLANET
today Gold analysis 👆
🟢This Chart includes_ (GOLD market update)
🟢What is The Next Opportunity on GOLD Market
🟢how to Enter to the Valid Entry With Assurance Profit
This CHART is For Trader's that Want to Improve Their Technical Analysis Skills and Their Trading By Understanding How To Analyze The Market Using Multiple Timeframes and Understanding The Bigger Picture on the Charts

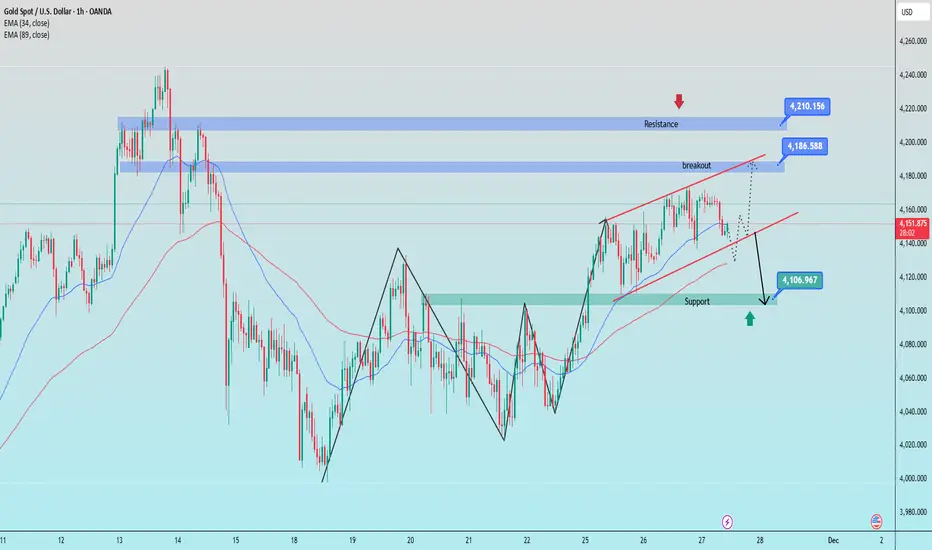
Gold is still moving sideways and waiting for a breakout1. Trendline Structure
Ascending Channel (red)
Upper trendline: price has been repeatedly rejected at the upper boundary → strong dynamic resistance.
Lower trendline: recently pierced slightly → indicates weakening buying pressure and increased correction risk.
2. Key Resistance
4,186 – 4,210: Strong supply zone + confluence with the upper trendline.
This is a zone that price will struggle to break without strong volume.
→ If price breaks above and successfully retests → the next target is the 4,210 area.
3. Key Support
4,105 – 4,110: Major support zone, confluence with EMA & the 0.5 Fibonacci level.
→ High probability that buyers will step in around this area.
4. Overview
Major Resistance: 4,186 – 4,210
Major Support: 4,105 – 4,110
Short-term Trend: weakening, leaning toward a corrective move.
Key Signal: a break below 4,140 → confirms a drop toward the support zone.
Bullish Scenario: only activated if the price reclaims 4,186.
BUY GOLD : 4107 - 4109
Stoploss : 4097
Take Profit : 100-300-500pips
SELL GOLD : 4209 - 4211
Stoploss : 4221
Take Profit : 100-300-500pips
U.S. data storm ahead – Gold awaits its next breakout🟡 XAU/USD – Timing Reversal at 4188, FVG Retest Expected
🔍 Market Context
Gold is approaching a key timing zone near 4188–4190, which aligns with previous supply and structural rejection.
After a strong impulsive leg, liquidity resting above recent highs may be targeted before a deeper pullback into the Fair Value Gap (FVG) zone.
The structure remains bullish in the medium term, but short-term corrective moves are expected before continuation toward the 4212 liquidity objective.
📈 Key Trading Zones
🔻 SELL Setup
Entry: 4188 – 4190
Stop Loss: 4192
Target 1: 4090
Target 2: 4020
Expect rejection at timing zone — short-term bearish retracement into FVG.
🟢 BUY Setups
BUY GOLD 4090 – 4088 | SL 4085
→ Scalp long targeting 4140–4160 if price reacts strongly within FVG.
BUY GOLD 4022 – 4020 | SL 4017
→ Ideal deeper retracement buy zone aligning with structural liquidity & prior demand.
🧠 Trading Plan Logic
Wait for price sweep & rejection at 4188–4190 before confirming short.
Monitor FVG zone (~4090) for reaction to flip back long.
The higher-timeframe target sits near 4212, aligning with liquidity above prior highs.
⚙️ Bias
Short-term: Bearish correction from 4190 toward 4090.
Medium-term: Bullish continuation toward 4212 after retracement.

XAU/USD – OTE Retracement Into Monthly VWAP ZoneGold is consolidating below the monthly VWAP and its ±1 deviations, while price continues to trade inside a balanced volume area.
I'm watching for a potential retracement into the OTE zone, aligning with the VWAP deviation and a low-volume pocket on the profile.
If price reaches this area and shows rejection, I expect a continuation lower toward the $4,000 – $3,886 liquidity zone, which sits just below the current range.
The plan:
Short-term push upward to grab liquidity into the OTE + VWAP zone
Then a potential bearish continuation toward the next clean downside targets

Gold Awaits PPI & GDP – Buy Dips, Sell Rallies🟡 XAU/USD – PPI & GDP Data to Define Range Expansion
🔍 Market Context
Gold remains range-bound between $4000–$4100, consolidating after last week’s liquidity sweep.
This week’s key U.S. data — Core PPI, Retail Sales, GDP, and Core PCE — will likely dictate the next major move.
Slight improvement in inflation and consumption data could strengthen the USD temporarily, but overall bias remains bullish mid-term as the Fed is expected to maintain a dovish stance into Q1.
📊 Technical Outlook (4H Chart)
Main Sell Zone (Super OB): 4170–4200 → potential reversal supply zone.
Fair Value Gap (FVG): 4130–4160 → short-term reaction zone if price retraces.
Sell Zone: 4090–4095 → short opportunity aligned with intraday bearish structure.
Buy Zone 1: 4024–4025 → minor demand, expecting internal liquidity sweep.
Buy Zone 2 (Main OB): 4003–4001 → strong order block with multiple rejections; key liquidity pool.
Structure: H4 BOS (Bullish) intact, suggesting a liquidity sweep before next expansion upward.
🎯 Trade Plan
1️⃣ SELL Setup – Short-term reaction from FVG
Entry: 4090–4095
Stop Loss: 4100
Take Profit 1: 4055
Take Profit 2: 4040
Take Profit 3: 4025
➡️ Reasoning: Price is likely to tap the lower edge of FVG and sweep local liquidity before a downside reaction toward internal range demand.
2️⃣ BUY Setup – First demand zone test
Entry: 4024–4025
Stop Loss: 4022
Take Profit 1: 4065
Take Profit 2: 4080
➡️ Reasoning: Expecting a short-term liquidity grab below the mid-range before bullish continuation.
3️⃣ BUY Setup – Main OB accumulation zone
Entry: 4003–4001
Stop Loss: 3998
Take Profit 1: 4045
Take Profit 2: 4075
Take Profit 3: 4090
➡️ Reasoning: Deep liquidity zone aligning with higher-timeframe OB. If macro data disappoints, this area can trigger the next impulsive leg to retest 4170+.
🧭 Overall Bias
→ Ranging bias before Core PCE
→ Buy dips – Sell rallies within 4000–4100 until a clear breakout post-GDP/PCE data.
→ Watch for false breakouts around FVG and maintain risk control before U.S. session releases.

Gold Trade Plan 24/11/2025Dear Traders,
Gold is currently moving within a range between 4000–4100, and the news about an initial agreement between Russia and Ukraine will have a strong impact on gold and the EUR/USD pair.
I expect that after price breaks out of the range, it will reach the first target at 3970. After that, we need to observe the price action.
If 3970 is broken decisively, I expect the price to reach 3850–3750 this week. However, if the 3970 zone acts as support, I anticipate a sharp upward move.
Regards,
Alireza!

Gold.Gold.
RARE and IMPORTANT breakout about to occur.
5 more trading before it gets CONFIRMED.
Have a great weekend!

The Most Likely Scenario for Gold: A Bearish MoveUsing wave analysis, the chart suggests that gold is likely entering a potential downward movement. After completing the internal wave C within the corrective structure, we may now be heading toward the larger bearish wave C.**
**This is currently the most probable scenario to unfold on the gold chart. We observe the developments closely with the eye of a hunter, and I will publish the exact entry point once a high-quality setup appears.**
**Stay tuned

Bank holiday what will gold price be on 28 november 2025?1️⃣ Trendline
Ascending Trendline (red channel)
Price is moving inside a short-term ascending channel, forming higher highs and higher lows.
Recently touched the upper boundary → a technical pullback toward the lower boundary is likely.
Descending Trendline (red dotted)
This is a dynamic resistance from the higher timeframe.
Price has just broken above it; a retest is normal → creating a strong confluence area.
2️⃣ Key Support & Resistance
Resistance
4,240 – 4,245 (Fibo 1.618 + major supply zone)
→ This is the upside target if price continues to hold within the ascending channel.
Support 1 (nearest)
4,165 – 4,170 (trendline + MA + previous consolidation zone)
→ This zone is crucial for maintaining the bullish structure.
Support 2 (stronger)
4,095 – 4,112 (Fibo 0.5 – 0.618 + broad demand zone)
→ If Support 1 breaks, price may retrace deeply into this area.
3️⃣ Fibonacci Levels
Fibo 1.0 at 4,162 → currently the main retest point.
Fibo 0.618 at 4,111 → strong confluence with the major demand zone.
Fibo 1.618 at 4,245–4,255 → matches the top resistance → primary bullish target if the trendline holds.
4️⃣ Scenarios
Bullish Scenario (preferred)
If price holds above 4,165 – 4,170
→ it continues following the ascending channel → target 4,240 – 4,245.
Bearish Scenario
Break of the trendline + candle close below 4,165
→ confirms a correction phase → price likely moves down to 4,109 – 4,105.
Trade Ideas
BUY GOLD:
4165 – 4162
Stoploss: 4152
Take Profit: 100 – 300 – 500 pips
SELL GOLD:
4240 – 4243
Stoploss: 4250
Take Profit: 100 – 300 – 500 pips

XAUUSD Bullish Momentum Continues — Target 4,350OANDA:XAUUSD is still trading within a clearly defined ascending channel, with recent price action bouncing off a key support level. This suggests that the bullish trend is likely to continue, with the next target being around 4,350, aligning with the upper boundary of the channel.
A short-term pullback could present a buying opportunity, especially if bullish candlestick patterns like engulfing or hammer appear, signaling strength from the buyers. A decisive breakout above recent highs would further reinforce the momentum towards the expected target.
However, if the price breaks below the lower boundary of the channel, it would invalidate the bullish outlook and potentially signal a shift in market direction.
This is just my perspective on the market, not financial advice. Best of luck!

Gold Forming Dual Patterns – Break Above 4170 or Invalidation BeXAUUSD – Gold Technical Analysis Update
Gold recently broke above the upper boundary of the black price channel,
then pulled back and respected the 50% level of the rising channel twice,
indicating active demand and a strong reaction zone.
Price is currently forming two potential patterns simultaneously:
Cup & Handle pattern
Head & Shoulders formation
The next move depends on breakout direction.
📈 Bullish Scenario
A confirmed breakout above 4170$ activates bullish continuation,
with targets aligned to both patterns and channel structure:
4292$
4310$
These levels correspond with the upper boundary of the white ascending channel,
suggesting a clean extension to the upside if momentum holds.
❗ Bullish Scenario Invalidation
If price breaks below 4110$,
the bullish outlook is cancelled and structure must be reassessed.
Further updates will be posted once confirmation occurs.

Continue shorting gold, stop loss at 4155Continue shorting gold, stop loss at 4155
As shown in the chart:
Current resistance: 4150
Current support: 4110
I still choose to short.
I believe gold prices are unlikely to rise further.
Strategy:
Sell: 4135-4140
Stop loss: 4155
Take profit: 4110-4100-4080
Analysis Summary:
Gold prices are currently in a key trading range, with the market's focus on expectations of a Fed rate cut.
Fed officials have released dovish signals, and the market expects a rate cut in December, with a probability exceeding 80%.
US retail sales data fell short of expectations, while the Producer Price Index (PPI) remained stable, suggesting a possible economic slowdown and increasing the likelihood of a rate cut.
Gold prices are in a clear trading range (4110-4150 is the key range).
1. Trading Strategy Within the Current Range:
Until the price breaks out of the current trading range, a buy-low-sell-high strategy can be employed.
Key Resistance Level: Approximately $4150. This area is the convergence point of recent rebound highs, forming strong resistance.
Key Support Level: Approximately $4110. This area is the recent low, forming short-term support. Strong support also exists in the $3971-$4020 area.
Buy near support: When the price retraces to around $4110 and shows signs of stabilization (e.g., a bullish candlestick pattern), consider establishing a long position.
Sell near resistance: When the price rallies to around $4150 and encounters resistance, consider establishing a small short position.
2. Post-Breakout Strategy
The consolidation phase will eventually end; preparations need to be made for a breakout.
Upward Breakout Confirmation Signal: If gold prices strongly break and hold above $4150, especially if they further break through $4185, the consolidation pattern may be broken, and potential upside potential expands. At this point, consider going long, following the trend, with a target price of $4190 or even higher.
Downward Breakout Confirmation Signal: If gold prices decisively break below $4110, especially below $4020, or even the psychological level of $4000, it indicates strengthening downward momentum. At this point, be wary of the risk of further declines to the $3970 support level, and consider shorting on rallies.
When trading within a range, a stop-loss order can be placed approximately 20 pips away.
After a breakout, a stop-loss order can be placed in the opposite direction of the breakout point to guard against false breakouts.

XAUUSD | Gold Signal |Now 24,2025BUY TREND TARGET FOR TODAY 📊
🔱Gold opened the week under pressure, sliding toward $4,040/oz as the market waits for clearer signals on the Federal Reserve’s next move. After last Friday’s decline, sentiment continues to shift rapidly ahead of this week’s key US data.
📌 Key Drivers This Monday:
Fed President John Williams hinted at support for another rate cut soon, pushing market expectations for a December 25bps cut to nearly 70%, up from just 40% last week after the strong jobs report.
However, traders are staying cautious as the market looks for confirmation from incoming economic indicators.
📊 Data to Watch This Week:
- Tuesday: Retail Sales & PPI (September)
- Wednesday: Initial Jobless Claims
These releases will shape how aggressively markets can price in additional easing from the Fed.
⚠️ Market Sentiment:
Despite today’s decline, gold remains up around 54% year-to-date, supported by geopolitical uncertainty, strong central bank buying, and persistent hedging demand.
Risk appetite in global markets is improving slightly, adding short-term pressure to gold, but long-term fundamentals remain supportive.
♾️BUY XAUUSD 4060–4063
🚨SL: 4057
💰TP 1:4066
💰TP 2:4069
