GOLD XAUUSD CHARTLONDON finally played into my 15 min structure 3885-3880 and its moving in 3935 first take profit and 3945-3940 target 2.the correction ic not up 50% retracement yet ,so it could continue to drop.
the fomc rate outlook caution is playing on long position.
the last chart posted was detailed into new buy position on 15 min chart after my first layer of buy floor at 3945-3940 failed.
the second layer was 100% accurate and its the hand of GOD.
NOTE =TRADING THE FOREX IS 100% PROBABILITY
NO STRATEGY IS HOLY GRIL.
RISK MANAGEMENT IS KEY.
GOODLUCK
#GOLD #XAUUSD
Trade ideas

Stop!Loss|Market View: GOLD🙌 Stop!Loss team welcomes you❗️
In this post, we're going to talk about the near-term outlook for GOLD ☝️
Potential trade setup:
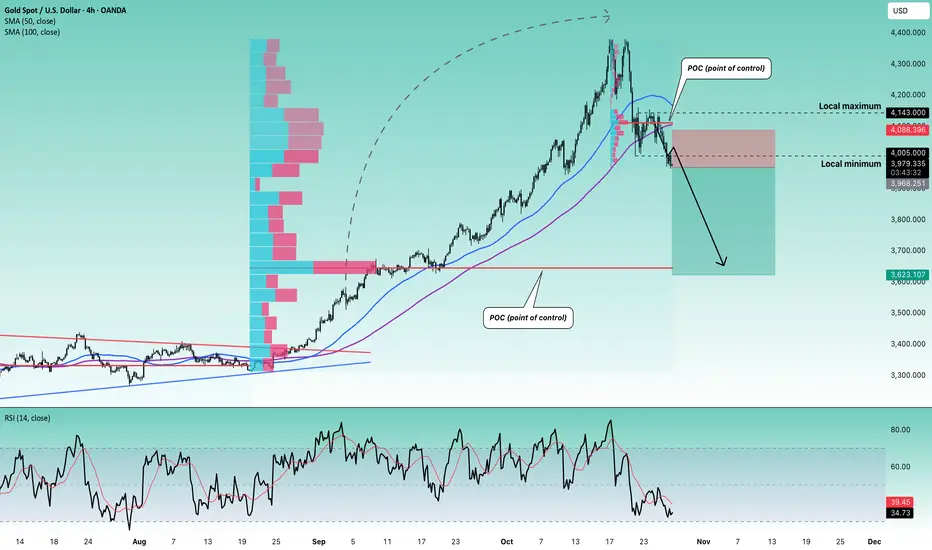
🔔Entry level: 3968.251
💰TP: 3623.107
⛔️SL: 4088.396
"Market View" - a brief analysis of trading instruments, covering the most important aspects of the FOREX market.
👇 In the comments 👇 you can type the trading instrument you'd like to analyze, and we'll talk about it in our next posts.
💬 Description: Metals have broken the lower border of previously identified accumulations. For gold, this is the price range of 4005 - 4143, indicating a highly probable downward impulse previously anticipated toward the 3600 - 3700 region. Currently, the main scenario is a breakout and entry around 3970. If the stop loss is triggered, re-entries can be considered.
Thanks for your support 🚀
Profits for all ✅
❗️ Updates on this idea can be found below 👇
XAUUSD (Gold) – Sell Limit Setup
Timeframe: 1H
Gold has been in a strong downtrend, with lower highs and lower lows confirming bearish momentum. I’m expecting a short-term pullback before continuation to the downside.
My setup:
Pending Order: Sell Limit around $3,960
Stop Loss: $4,066 (above recent structure high)
Take Profit: $3,821 (previous support zone)
Risk/Reward Ratio: ~1:2
Reasoning:
Price is currently extended from the moving average, and I’m looking for a retracement toward resistance before another leg down. If we get a rejection near the 3,960 zone, it could signal a continuation of the bearish trend.
⚠️ Note: This is not financial advice, just sharing my personal analysis for discussion and learning.

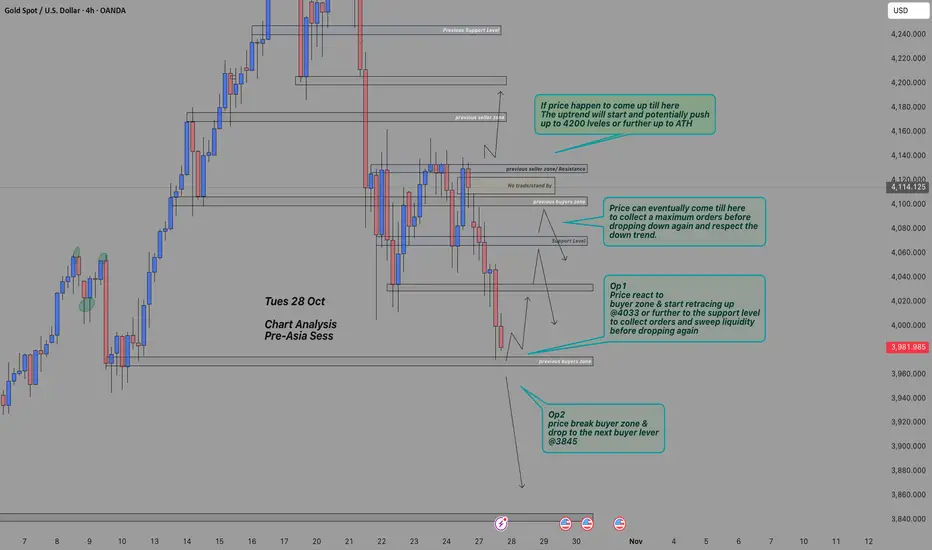
Tues 27 Oct - Chart Analysis before Asian Session OpenEverything is explained on the chart.
Based strictly on market structure.
Let's see how the price will evolve during the Asian Session.
Reminder: No financial advice here.
Expectation & Prediction are only for educational purposes.
Tracking the Goal Market daily here @TeamWePrint.
Thanks for joining the journey.
Trade Safe!
#TeamWePrint
Hellena | GOLD (4H): LONG to 61.8% Fibo of 4265.Dear colleagues, in the new forecast the idea remains the same - the upward momentum (12345) is not yet complete.
At the moment I see the end of the formation of the corrective wave “4” at the level of 4000, as stated earlier, and the beginning of the upward movement in wave “5”.
I do not want to set distant targets, because their achievement may take time, so let's start small - the nearest target is the resistance area at 4265 - the area beyond the 61.8% level of wave “4”. I think that this is the nearest target that we should expect.
Fundamental context
Earlier this week, gold experienced a sharp pull-back after its recent record highs. Nothing to panic about — it’s simply a technical correction: investors are taking profits after a rapid and extended rally. Key drivers like central bank buying and lower rate expectations remain intact, so the broader bullish story is still alive. In fact, this brief dip may offer a better entry point before the next leg up.
Manage your capital correctly and competently! Only enter trades based on reliable patterns!

Gold Hesitates Ahead of U.S. CPI — Watching the 4000 ZoneGold Hesitates Ahead of U.S. CPI — Watching the 4000 Zone
From the analysis I shared yesterday, gold reached the first target near 4152 before pulling back.
The market is currently hesitating to move further, mainly due to uncertainty around the upcoming U.S. CPI data. I’m not interpreting the data this time, as its impact on gold can be unpredictable — gold often moves independently of fundamentals.
I believe gold may rise once more toward the 4000–4060 zone, as shown on the chart. However, traders should remain cautious since the news could bring significant volatility.
Targets remain unchanged.
Keep in mind that a break below 4000 could confirm a bearish wave, potentially followed by an aggressive rebound — a classic false sell-off scenario.
You may find more details in the chart!
Thank you and Good Luck!
❤️PS: Please support with a like or comment if you find this analysis useful for your trading day❤️

There’s currently no synchronization for shorts.
Bias D1 - short
Narrative Asia - long
There’s currently no synchronization for shorts.
To confirm short setups, we need to wait for a BOS on h1.
I expect this to happen through the short IMB on h1.
If there’s no confirmation for shorts, the price may continue rising toward PDH.
Once the short setup is confirmed, I expect the price to move toward the main target - PWL.
Internal targets will be AL and the 3915 level.
The current daily range is 1.59%.
Considering this, market activity can be expected closer to the NY session.
Invalidation point for the short idea - PDH.
NEWS:
🔴 🇺🇸 USD 17:00 - ISM Manufacturing PMI
🟠 🇺🇸 USD 17:00 - ISM Manufacturing Prices

XAUUSD Update Strong 4050 resistance and weak BullishAfter price has try to make an upside movement, we saw that 4050 ressistance still hold and price can't break it yet.
Let see on Monday, as we could recognized it as a weak bullish movement.
Big possibility bearish will continues it movement, but still extra caefully to watch, what's the market wants ?
Step by step - brick by brick.
Becarefull to jump in, if it will drop, it will retest ( correction before break a support ).
Have a blessing week ahead !

GOLD XAUUSD LONDON OPEN PERSPECTIVE GOLD MARKET IN LONDON OPEN SESSION ,ONE SMALL OVERSIGHT AGAIN ON 1HR CAUSED US TO miss a sniper entries.we posted buy from pull back in the zone of 4000-4006 but the sniper buy was 3995 ,that was not bad but, its not where we want to be,the aim is to get into trade on sniper entry only.
if isn't sniper entry ,then is bad entry .
if we pull back again in london session for buy it will be on 3970-3980 zone .
layer by layer
trading is probability
risk management is key.
any key layer can fail.
#gold #xauusd

Gold Price Analysis – Will Bears Drag XAUUSD Below 3900?Gold continues to trade within a clear downward structure facing consistent resistance near the 4040–4060 zone while maintaining pressure below key descending trendlines. Price recently confirmed another Change of Character (ChoCH) near the 3972 level suggesting bearish continuation. The projection shows potential short-term pullbacks toward 3980–4000 followed by a deeper drop toward targets at 3901 and 3857.
Unless bulls reclaim the 4063–4128 resistance the overall bias remains bearish with expectations of further downside toward the $3,816–$3,850 support range.
Regarding the Fed meeting tomorrow markets widely expect a 25 bps rate cut which is already priced in. The real impact will come from the Fed speech if the Fed hints at further easing (a dovish stance) gold may bounce higher as the dollar weakens. But if the Fed sounds cautious or signals a pause gold could drop sharply as yields and dollar strength return. Overall trend remains bearish traders should stay alert to post Fed volatility as it could temporarily disrupt or confirm the next major move.
🔴 Sell Zone:
The main sell zone is between 4150-4200 which aligns with the upper resistance range and the top boundary of the descending channel. This area has repeatedly acted as a rejection point where sellers step in aggressively. If price retraces into this zone and forms bearish confirmation candles it becomes a strong region to look for short entries.
⚡ Sell Trigger Area:
The sell trigger area lies around 4000 which is a key psychological and structural level. A confirmed break and candle close below 4000 would likely trigger renewed bearish momentum opening the way toward 3901-3857 as next downside targets. This break would confirm continuation of the bearish wave and strengthen the short bias.
Note
Please risk management in trading is a Key so use your money accordingly. If you like the idea then please like and boost. Thank you and Good Luck!

XAUUSD 15m | Liquidity Sweep → Demand Zone → Bullish ContinuatioAfter a clean liquidity sweep below the previous low (marked with the $ sign), price reacted strongly from a demand zone, showing a shift in market structure to the upside.
We’ve since seen a bullish displacement that created a Fair Value Gap (FVG) and a clear retest zone where price is now reacting.
This setup aligns with a short-term bullish bias, aiming for a continuation toward higher liquidity resting above recent swing highs.
⸻
📊 Setup Breakdown:
• Pair: XAUUSD
• Timeframe: 15m
• Bias: Bullish
• Entry: ~3970
• Stop-Loss: 3883.9
• Target: 4151
• Risk-to-Reward: ~1:4
⸻
🔍 Confluences:
• Liquidity sweep below equal lows
• Strong bullish displacement and market structure shift
• Price mitigating demand zone / FVG
• Clean imbalance above targeting liquidity at 4,150
⸻
🧠 Trade Idea:
Looking for continuation toward 4,150 as long as 3,913 holds. Any deeper retrace into the demand zone is still valid as long as structure remains intact.
⸻
#XAUUSD #Gold #SmartMoney #PriceAction #LiquiditySweep #FVG #TradingView #ICTConcepts

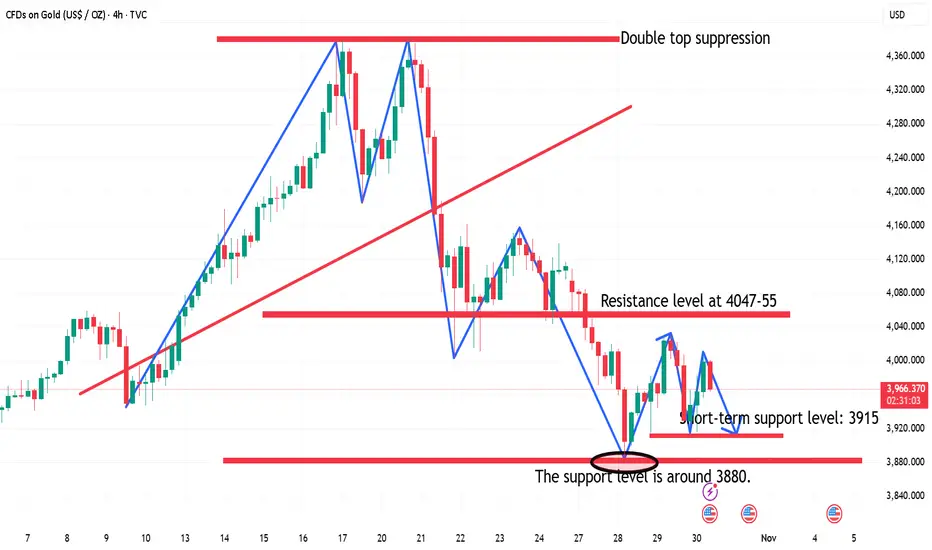
US session short-term trading strategy guidance at 10:30!From a 4-hour chart perspective, the current short-term resistance level to watch is 3978-85, with a key resistance level at 4047-55. Short-term support is at 3915-20. Trading should focus on range trading; avoid chasing the market and patiently wait for key entry points.
Gold Trading Strategy:
1. Sell gold at 3978-3985, stop loss at 4009, target 3880-3895, hold if it breaks through;
2. Buy gold at 3915-20, stop loss at 3896, target 3977-85, hold if it breaks through.
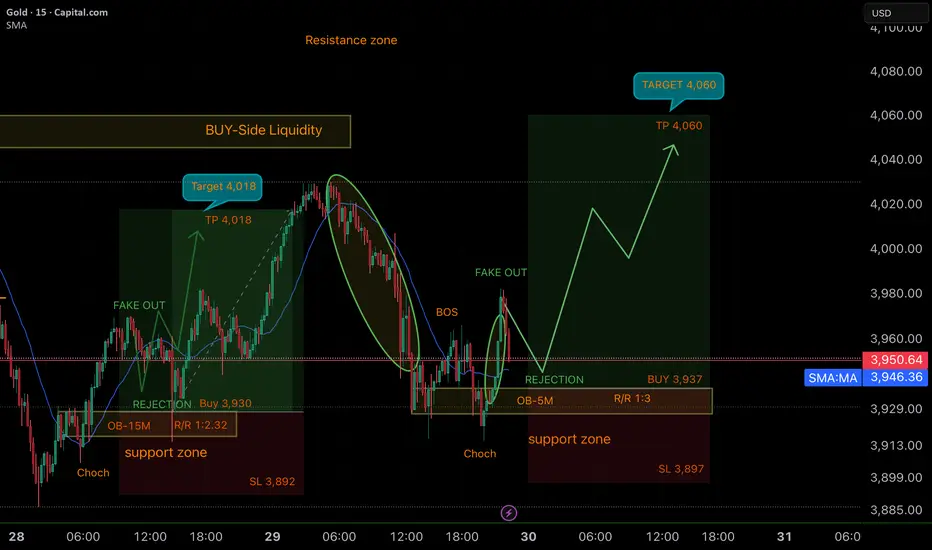
SMART MONEY CONCEPT (SMC)📊 XAU/USD Bullish Analysis (15M)
🔑 Key Points
1. Previous Setup Completed:
The first trade idea (Buy at 3,930 with TP at 4,018) played out perfectly, validating the 15M OB and initial fake out. Price reached the Buy-Side Liquidity and reacted at the resistance zone.
2. New Context (after BOS):
After reaching 4,018, price retraced and created a Break of Structure (BOS), sweeping liquidity to the downside. This cleared orders and set the stage for a fresh bullish leg.
3. Fake Out + Rejection at OB-5M:
A new Fake Out occurred, confirming accumulation.
The 5M Order Block inside the support zone (3,897 – 3,937) serves as the institutional entry area.
4. Trade Plan:
• Buy: 3,937
• SL: 3,897 (below support zone)
• TP: 4,060 (liquidity/resistance target)
• R/R: 1:3 (strong risk-to-reward profile)
5. Bullish Projection:
After rejection from the OB, price is expected to push upward, targeting the liquidity pool around 4,060.
📈 Conclusion
This setup aligns with Smart Money Concepts (SMC):
✅ BOS & liquidity sweep confirmation
✅ OB-5M as precise entry point
✅ Solid R/R ratio of 1:3
Clear structure, strong confirmation, and a well-defined target.
💡 Motivational Note
“Liquidity must be taken before direction is revealed. Patience and precision are what separate good traders from lucky ones. GOOD LUCK TRADERS… 🦾😎🫵🏻
Gold Rebounds to Order Block — Downside Risk Remains🔍 Market Context
After forming a Change of Character (ChoCH) and a clear Break of Structure (BoS) to the downside, gold dropped sharply from 4,080–4,100 USD, confirming a shift from bullish to bearish structure.
Price is now making a technical rebound, forming Lower Highs toward the Order Block 4,012 USD — aligning with a small Fair Value Gap (FVG) , suggesting new selling pressure may emerge.
This rebound is seen as a “pullback retest supply” within a completed bearish setup.
If the 4,012 USD supply zone reacts strongly, price may extend its drop toward lower liquidity pools.
💎 Key Technical Structure
BoS (bearish): confirms a break below prior bullish structure.
Order Block (OB): 4,010–4,020 USD → main supply area confluencing with FVG.
FVG zone: 3,985–4,010 USD → technical retracement zone.
Supply Zone: 3,891–3,895 USD → temporary support, may be swept.
Liquidity Zone: 3,850–3,860 USD → key liquidity target.
📈 Trading Scenarios
1️⃣ SELL Setup – Retest OB 4,010–4,020 USD
Entry: 4,010 – 4,020
SL: 4,035
Take Profit: 3,985 - 3,965 - 3,945 - 3,915 - 3,890/Open
✅ Condition:
Wait for price to retest FVG–OB with clear bearish confirmation (strong rejection, bearish engulfing, or minor ChoCH on M15).
➡️ Trend-follow setup – sell after price retests supply zone.
2️⃣ BUY Setup – Reversal at Liquidity Zone 3,850 USD
Entry: 3,850 – 3,860
SL: 3,830
TP1: 3,870 - 3,885 - 3,900 - 3,920 - 3,940/Open
✅ Condition:
Wait for strong absorption or bullish reversal signal (long-tail rejection or bullish ChoCH on M15–H1).
➡️ Counter-trend scalp setup for reversal traders.
⚠️ Risk Management
Prioritise SELLs below 4,035 USD.
BUYs only valid with confirmation at Liquidity Zone.
Avoid mid-range trading (3,920–3,970) to reduce noise.
💬 Conclusion
Gold remains in a bearish trend after breaking prior bullish structure.
As long as price stays below 4,035 USD , downside momentum prevails.
Next major target: 3,891 – 3,851 USD .
👉 Strategic Plan:
Sell 4,010–4,020 | SL 4,035 | TP 3,985 → 3,890 🎯
Buy 3,850–3,860 | SL 3,830 | TP 3,870 → 3,940 🎯
💎 Price never lies — liquidity always reveals the truth.
⏰ Timeframe: 1H
📅 Updated: 29/10/2025
✍️ Analysis by: Captain Vincent

GOLF FOMC prep prediction 2Scenario 2:
-Powell mentions continued rate cuts with dovish tone still, and stating unemployment still to high.
-Then we can expect Gold reach previous ATH's again or even make new Highs.

XAUUSD Short"Price is currently reacting to the marked Fibonacci zones and the 3970 resistance area. If this level holds, we could see a continuation of the Drop-Base-Drop formation. A confirmed break below the 5-minute trendline would add further confluence for a more confident short setup."

Chart Breakdown - Pre New York - 28 OctPrice dropped during the London session, indicating that sellers are strong in the market.
Price delivered our 1:7RR and created the LL.
A retracement is in process to create a lower high before eventually dropping down again and maintaining the momentum to the downside.
If not, we can expect some manipulation and price pushing higher to the 4000 level.
That would be the zone to pay attention to for a potential shift of structure.
Let's see how it goes!
Trade Safe out there!
@TeamWePrint

XAUUSDDouble Bottom Pattern
Bullish Divergence (RSI)
Wait for price to break above 4024
The setup aims to catch the breakout from a bullish reversal zone confirmed by RSI and structure.

Gold prices could fall to $3,900-3,950Gold prices could fall to $3,900-3,950.
As shown in Figure 4h:
Gold prices remained weak on Monday, with support levels in the $4,000-4,050 range currently at risk.
Gold prices fluctuated during the Asian session, with the rally stalling near $4,080.
Volatility has dropped to a rock bottom as gold prices fell below support at $4,050 during the European session.
The likelihood of a break below $4,000 has significantly increased.
Today's Trading Strategy:
Sell: 4,040-4,050
Stop Loss: 4,065
Target: 3,950-3,900

How to Identify Higher Highs and Lower Lows AccuratelyIn price action trading, identifying Higher Highs (HH) and Lower Lows (LL) may seem simple, but it’s actually one of the most essential foundations for reading market structure.
If you get it wrong, you’ll often end up trading against the trend without realizing it.
1. Understanding Higher Highs & Lower Lows
Higher High (HH): a new peak that’s higher than the previous one → indicates the uptrend is still intact.
Lower Low (LL): a new trough lower than the previous one → confirms the downtrend continues.
It sounds simple, but the tricky part lies in choosing the correct main swing to read from.
2. Common Mistakes That Mislead Traders
Many traders identify HH–LL patterns on very small timeframes, which causes confusion because of minor pullback waves inside the bigger trend.
Example:
The M5 chart might show HH–HL (uptrend), while the H1 chart is clearly forming LL–LH (downtrend).
If you buy based on the small timeframe, you’re essentially buying into a pullback.
💡 Pro tip: Always identify the main market structure on higher timeframes (H1–H4) before looking for entries on smaller ones.
3. How to Identify Them Accurately
Find the main swing:
Look for the points where price truly reverses with strong candles or noticeable volume.
Mark clear highs and lows using the swing high/swing low tool.
Check structural continuity:
If HH and HL remain intact → the trend is bullish.
If LL and LH keep forming → the trend is bearish.
If the structure breaks (for example, a HH forms in a downtrend) → the market may be shifting direction.
4. Practical Tips
Use the H4 timeframe to determine the overall trend.
Then, drop to M15 or M30 to locate precise HH/LL points for entry.
Avoid identifying HH/LL inside sideways (ranging) markets — it’ll only confuse your analysis.
Gold Price Breakout Toward 4,037 Target(XAU/USD) is forming a symmetrical triangle pattern on the 1-hour chart, suggesting potential breakout momentum. The price is currently trading near $4,014, with an upside target of $4,037 if bullish momentum continues. Key support zones are located at $3,960, $3,920, and $3,880.

XAU/USD 03 November 2025 Intraday AnalysisH4 Analysis:
-> Swing: Bullish.
-> Internal: Bullish.
Analysis and bias remains the same as analysis dated 20 October 2025.
Price has printed as per previous intraday expectation by printing a bearish CHoCH which indicates, but not confirms, bullish pullback phase initiation.
Price is currently trading within an established internal range, however, I will continue to monitor price with regards to depth of pullback.
Intraday expectation:
Price to continue bearish, react at either discount of 50% internal EQ, or H4 supply zone before targeting weak internal high priced at 4,380. 990.
Note:
The Federal Reserve’s sustained dovish stance, coupled with ongoing geopolitical uncertainties, is likely to prolong heightened volatility in the gold market. Given this elevated risk environment, traders should exercise caution and recalibrate risk management strategies to navigate potential price fluctuations effectively.
Additionally, gold pricing remains sensitive to broader macroeconomic developments, including policy decisions under President Trump. Shifts in geopolitical strategy and economic directives could further amplify uncertainty, contributing to market repricing dynamics.
H4 Chart:
M15 Analysis:
-> Swing: Bullish.
-> Internal: Bearish.
Analysis and bias to remain the same as yesterday's bias date 29 October 2025.
As expected, price has printed a bullish CHoCH to indicate bullish pullback phase initiation.
Price is now trading within an established internal range.
Intraday expectation:
Price to continue bullish, react at either premium of internal 50% EQ or M15 demand zone before targeting weak internal low, priced at 3,886.465.
Note:
Gold remains highly volatile amid the Federal Reserve's continued dovish stance, persistent and escalating geopolitical uncertainties. Traders should implement robust risk management strategies and remain vigilant, as price swings may become more pronounced in this elevated volatility environment.
Additionally, President Trump’s tariff announcements, particularly against China, are expected to further amplify market turbulence, potentially triggering sharp price fluctuations and whipsaws.
M15 Chart:

XAUUSDXAUUSD is in bullish trend.
Potentially printing HH and HL.
Alligator also pointing upward direction.
we buy at CMP
