What will happen to gold on November 3rd?
I. Market Analysis
Trend Structure
Weekly Chart: Price is below the 5-week moving average, with the MACD showing a bearish crossover. Bearish forces dominate in the near term. However, the long-term ascending trendline support is near $3900. The long-term trend remains cautiously bullish as long as this level holds decisively.
Daily Chart: Moving averages are in a bearish alignment, and the Bollinger Bands are expanding downward, with price pressured near the middle/lower band. Key resistance is at 4046. Support is focused in the 3972-3950 zone. A break below 3972 could lead to a further decline towards 3950-3900.
Key Support & Resistance Levels
Resistance Zone: 4010 (Weakness Boundary) → 4023-4035 (Core Short Area) → 4047-4055 (Strong Resistance).
Support Zone: 3980 (Initial Support) → 3950-3955 (Long Area) → 3915-3885 (Deep Correction Target).
II. Trading Strategy
Core Idea: Prioritize selling on rallies, with opportunistic buying near key support levels. Strict risk control is essential.
Short Strategy (Primary)
Entry Zone: Enter short positions in batches between 4030-4035. Consider adding to shorts if price reaches 4047-4055.
Stop Loss: Above 4040-4060 (Adjust flexibly between 8-10 pips based on position size).
Targets: First target 3980, Second target 3960-3950 (Hold if broken).
Long Strategy (Secondary)
Entry Condition: Consider light long positions upon stabilization in the 3950-3955 zone after a pullback.
Stop Loss: Below 3940 (8-10 pips).
Targets: First target 3980-4000, Second target 4010 (Follow up if broken).
III. Risk Control Essentials
Position Management: Single trade position ≤ 5% of capital. Avoid heavy positions.
Stop-Loss Discipline: Strictly place stops for shorts above 4060 and for longs below 3940.
Contingency Alert: Monitor the US Dollar Index, Fed policy动向, and geopolitical risks closely. Adjust strategies promptly if key levels are breached.
IV. Summary
Gold's short-term technical posture is bearish, but the long-term trend requires monitoring the effectiveness of the 3900 support.
If price rallies and faces resistance in the 4030-4055 zone next Monday, prioritize short entries.
If price pulls back and stabilizes near 3950, consider light long positions for a bounce.
If price strongly breaks above 4060 or below 3940, a reassessment of the trend will be necessary.
Trade ideas

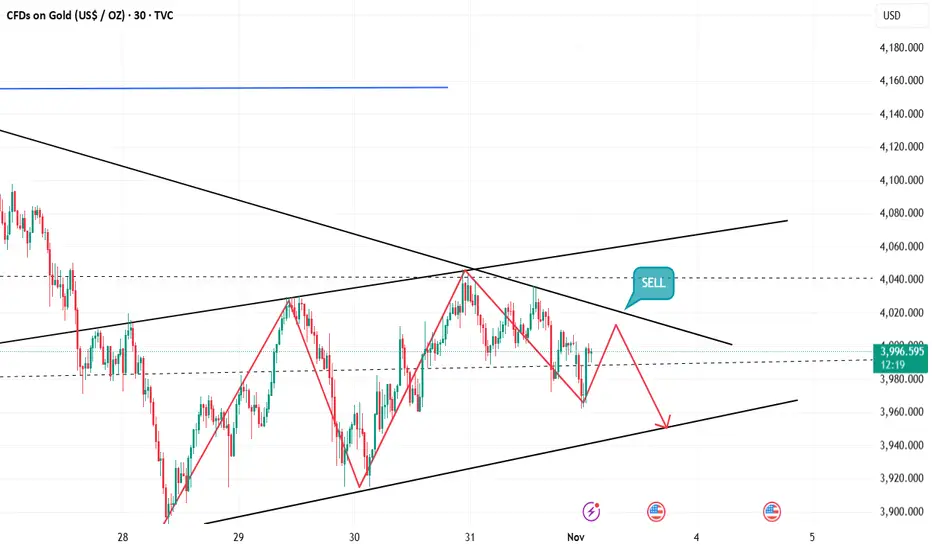
XAUUSD / GOLDGold chart illustrates a potential bullish setup forming above a key support zone. Price has recently bounced from the ascending trendline and is consolidating near the 4,000 level. The analysis suggests a possible short-term pullback into the support area around 3,950–3,900, followed by a rebound toward the target at 4,100. The overall structure indicates that as long as price holds above the rising trendline, bullish momentum may continue toward the next resistance zone.
"Thank you for your support! If you found this idea valuable or learned something new, please consider liking and leaving a comment. I’d really appreciate hearing your feedback and thoughts."

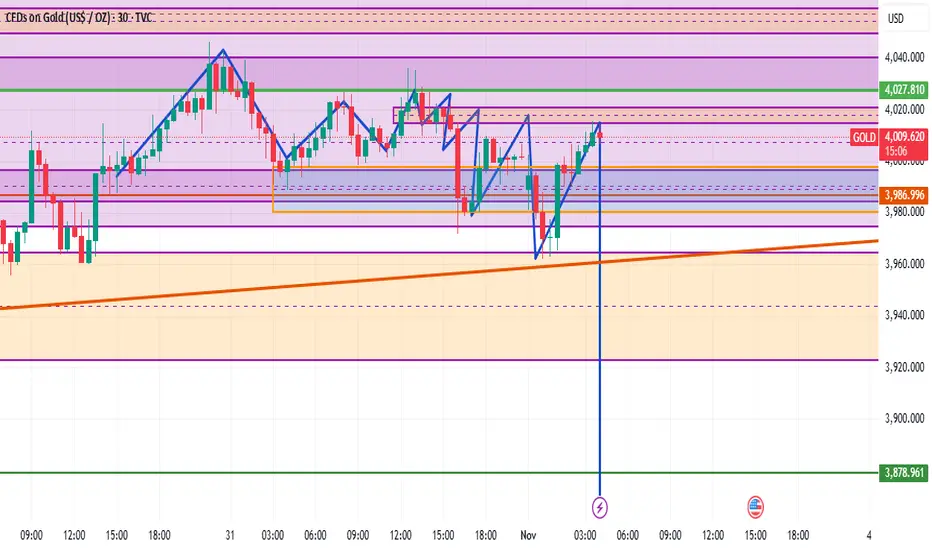
You can short gold after it fills the gap.Gold opened lower at the start of the week, having closed near 4002 on Friday, but opened at 3983, falling as low as 3962, a drop of nearly $40. Currently, the market is range-bound with no clear trend in either direction. Trading should focus on buying low and selling high based on support and resistance levels, rather than chasing the market. The overall market is still oscillating within the 3850-4150 range. The 3880 area, which has been tested twice without a breakthrough, has become a key support level for the decline.
Gold opened lower and filled the gap. Short-term selling pressure is warranted, as bullish momentum is weak and further weakness is possible in the short term. The overall market remains in a large range-bound pattern. The short-term bullish movement is merely a rebound and has failed to drive a significant upward trend. The market opened lower this morning following weekend news and continued to decline. After filling the gap this morning, the bears may continue to exert pressure. Short positions can be considered on rallies to 4005-4015.
Gold -Alternative TradeMy preferred entry level didn’t materialize yet may not, so it’s time to create an alternative tactic.
Main idea is to trade pennant pattern breakout. The take-profit target remains the same, but both the entry and stop levels are lower, reducing the risk-reward ratio from 3.98 to 2.85. This setup carries higher risk.
I will trade whichever pending order will be hit first and cancel the other one.
Original idea:

PRICE AT OUR FIRST ENTRY We are selling at first entry (4014-20 sl at 4037) because price got rejected early and couldn't close below our second entry
XAUUSD 1H Analysis (3rd November 2025) ASIA/LONDONHey Guys, This is only my trade Ideas for Educational Purpose. Take it at your own risk.
BUY/SELL SCENARIOS:
BUYS:
1) Body Candle Close above the 3996.28 level.
2) Retest the failed 1h Bearish FVG at the 3996.28 level.
3) Create a 3/5m Bullish Engulfing Candle to capitalise on potential BUYS towards the 4046.50 level.
SELLS:
1) Retest the 1h Bearish FVG at the 3987.88 level.
2) Create a 3/5m Bearish CHOCH with a body candle close (with a FVG)
3) Retest the 3/5m Bearish CHOCH Level to capitalize on potential SELLS towards the 3915.00 level.

OUR SECOND IDEAL SELL ENTRY If price moves below 3980 and stays below 3980 by 2 to 3 hours or more then, our ideal and good sell entry is at 3978-3985 with sl at 4003 maximum and tp not less than 1000 pips or you close at your own satisfaction because it will likely reach 3860. Don't sell immediately price moves below 3980 but wait for at least an hour or 3 before selling at the given entry when price retraces up.

Gold has not fallen below the $4,000 mark, so what's next?
News:
The Federal Reserve cut interest rates by 25 basis points as expected on Wednesday. However, to the market's surprise, Powell released an extremely hawkish signal, stating that a December rate cut is "far from a certainty," which directly caused a market crash. US stocks fell from their highs, the dollar rose, and gold and silver markets plummeted. The Fed also postponed the pause in its balance sheet reduction program until December.
This has temporarily tightened market expectations for a December rate cut, meaning that the expectation of a rate cut has temporarily failed to materialize. However, there is still more than a month until mid-December, and with fluctuations in data, expectations are likely to rise again.
Specifically:
Gold hourly chart: Today's price action was relatively volatile, with poor continuity and high deceptiveness. For example, the large bearish candle at 11:00 AM led many to believe a breakdown and weakness, following the overnight decline. However, a small W-shaped rally broke through the morning's opening price level.
Trading strategy:
Buy:3965-3960, SL: 3950, TP: 3980-4010-4030
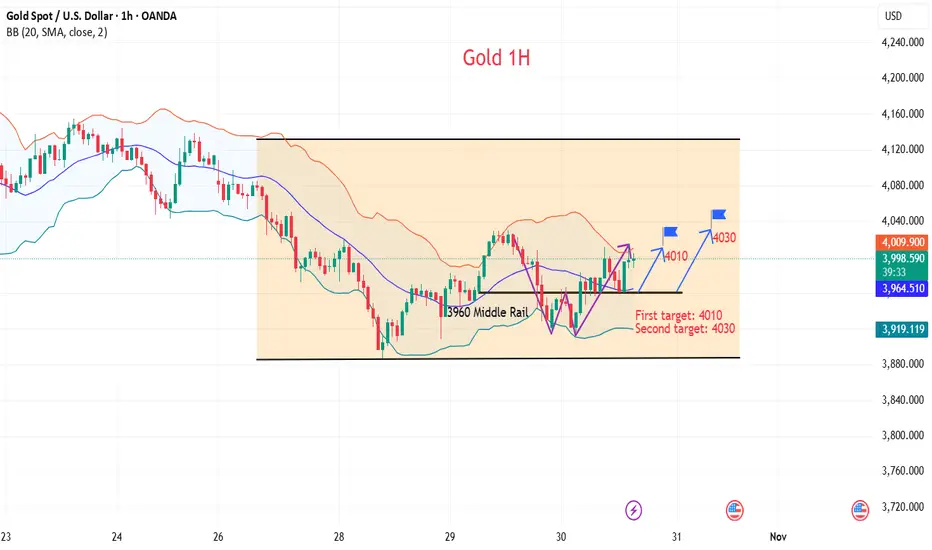
GOLD GATHERING MOMENTUM TO RETEST RECENT HIGHA close above (b) will confirm gold's price readiness to rise after creating a HH and HL.
N.B!
- XAUUSD price might not follow the drawn lines . Actual price movements may likely differ from the forecast.
- Let emotions and sentiments work for you
- ALWAYS Use Proper Risk Management In Your Trades
#gold
#xauusd

XAUUSDRisk warning, disclaimer: the above is a personal market judgment based on published information and historical chart data on Tradingview, all analysis is only subjective. Hope investors consider, that I am not responsible for your investment decision.
Thank you.
Good luck

XAU/USD (Gold) 15-Min Chart AnalysisCurrent Price: $4,005
Resistance Zone: $4,020 – $4,040
Gold is approaching a strong resistance area that previously triggered a pullback.
Trend Structure:
The market is moving inside a short-term ascending channel, but momentum shows signs of exhaustion near the upper boundary.
Key Observation:
A false breakout or rejection at the resistance could initiate a downward correction.
Bearish Signal Setup:
Entry Zone (Sell): $4,015 – $4,035 (look for rejection candles or bearish engulfing near resistance)
Target 1: $3,960
Target 2 (Main Target): $3,913
Stop Loss: $4,045 above resistance zone
Risk/Reward Ratio: Approx. 1:2.5
Confirmation:
Wait for bearish confirmation candle on 15M or 30M timeframe.
Break below $3,980 will strengthen bearish momentum toward target.
Signal Summary (📉 Sell Setup):
Direction Entry TP1 TP2 SL
🔻 SELL 4,015 – 4,035 3,960 3,913 4,045 TMX:SXF1! TMX:CRA1! TMX:SXA1! TMX:FHO1! TMX:CGF1! TMX:CGZ1! TMX:FBA1! TMX:FSH1! TMX:SXM1! TMX:SXM1! TMX:FFL1! TMX:FOP1! TMX:FRW1! TMX:FFV1! TMX:FEQ1! TMX:FRQ1!


GOLD MY demand floor 3945 -3940 activated break and close of the zone will be a sell continuation to retest 3885-3880 zone .
the line chart gave a clear insight on the claims .
now the new federal fund rate is 3.75-4.0% dollar index holding buy ,which i think will turn red soon.
the head of feds sir Jerome Powell speech on going.
ejoy your buy as posted 3945-3940
GOODLUCK

XAUUSD(Gold/USD)-15m Smart Money Concept Analysis / RiskyChartTechnical Breakdown:
Market Context:
The market broke structure (BOS) to the downside early in the session, showing a bearish bias.
However, a Change of Character (CHoCH) formed later, indicating a possible short-term bullish retracement or reversal zone.
Multiple CHoCH levels marked to confirm internal structure shifts.
Liquidity sweep (SMT) observed near the session low — suggesting potential accumulation before a rally.
PDH (Previous Day High) and PDL (Previous Day Low) zones highlighted to identify external liquidity targets.
Fair Value Gaps (FVGs) filled during retracements, supporting balanced price delivery.
Notable volume spikes on reversal candles signal institutional activity.

GOLD volatilityThe daily RSI for Gold is approaching to oversold area and this make make volatility in Gold for the next few weeks
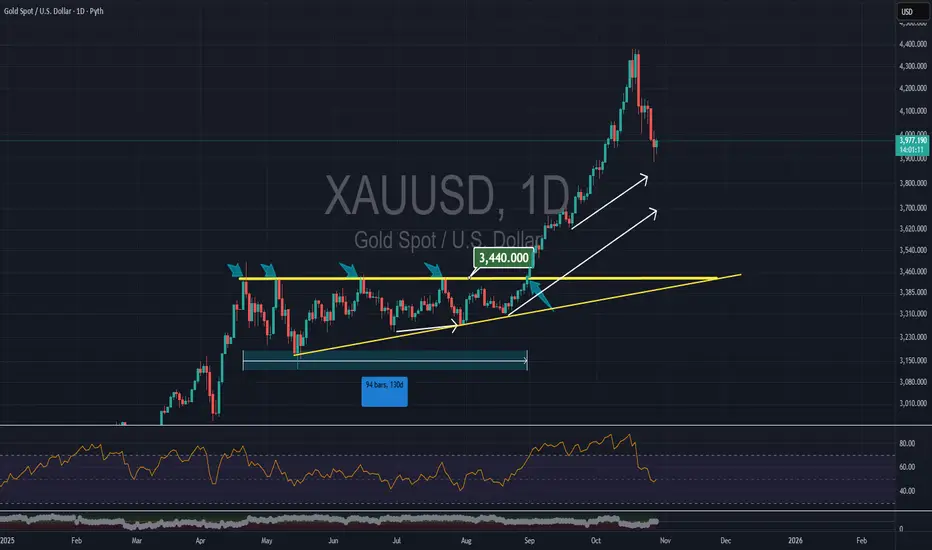
xausudsecond scenario both giving wave 4 scenarios within different longer term counts. That give different wave levels as such this one can see 3700 area before next move or 38% att 3300 area. No doubt trend at this time is down but levels of reevrsal will be determined with pa

GOLD | Daily Analysis #3 - 3 November 2025Hello and Welcome Back to DP,
Reviews and News Coverage:
Last week chart represented major moves and volatility. In this Week we should expect following economic calendar events :
- Monday, Nov 3: ISM Manufacturing PMI
- Wednesday, Nov 5: ADP Non-Farm Employment Change AND ISM Services PMI
- Friday, Nov 7 (Tentative): Unemployment Rate & Average Hourly Earnings
Political Angle:
The ongoing U.S. government shutdown negotiations and fiscal uncertainty may increase safe-haven demand for gold. Any escalation or delay in funding could trigger a risk-off tone and push XAU/USD higher.
1H Technical Analysis:
Gold has broken its major downtrend line, signaling a potential shift from bearish to bullish bias on the intraday time frame. The price is currently trading around $4,016, consolidating just below a short-term resistance zone.
Immediate Resistance: $4,024, So a breakout here could open the door toward $4,046, then $4,083.
The next stop if pass 4024, aligns with markup.
Immediate Support: $3,998 → $3,970 zone.
If this support breaks, the next downside target is $3,947 – $3,915 region.
Momentum remains cautiously bullish after breaking the descending trendline.
The structure of higher lows indicates accumulation, but the $4,024–$4,046 resistance area must be cleared with strong candle closes to confirm continuation.
If gold rejects from $4,024 again, expect a retest of the trendline support near $3,970–$3,950.
Trading Plan Ideas:
Bullish bias above $4,024 → potential upside toward $4,046 → $4,083.
Bearish correction if price breaks below $3,998 → next supports $3,970 → $3,947 → $3,915.
Watch for volume confirmation at $4,024 or $3,970 before entry.
Disclaimer:
This content is for informational purposes only and does not constitute financial or investment advice. © DIBAPRISM
Amir D.Kohn

XAu $hortsLast shorts, rusty entry but eventually flew through 75 on chase! No 31 closures..💃
Same predicament here, this time looking for $3940 return…
$3983 is needed NY…. 💯
Really can do it from here *14, if 25 is respected 🤔
Let’s gooo. 🫶🏽

STILL GOOD TO SELL price is still at our entry and it's good to sell still at 4012-17/ 4014-20 with sl at 4033 /4035 respectively

GOLD (XAUUSD) | Key Reaction Zone Ahead – 0.5–0.618 FIB Gold is trading near a critical retracement zone (0.5–0.618 FIB) with price consolidating below the previous day’s high ($4046).
Smart money may look to induce liquidity above $4031, then reverse to target the previous day low ($3972) if rejection confirms.
Trade Idea:
Watch Zone: $4006–$4031 (reaction / rejection area)
Bearish Scenario: Liquidity grab above $4031 → Break of structure → Sell continuation
Bullish Scenario: Strong close above $4046 → Next liquidity target $4065+
Bias: Neutral-to-bearish unless $4046 is broken with volume
Key Levels:
Resistance: $4046 (PDH zone)
Support: $3972 (PDL)

Elliott Wave Analysis – XAUUSD | November 3, 2025
🔹 Momentum
D1 Timeframe:
Daily momentum is currently rising and approaching the overbought zone.
At the current pace, it is expected that within 2–3 more D1 candles, momentum will reach the overbought area — increasing the risk of a potential reversal.
However, in the short term, the bullish trend still dominates.
H4 Timeframe:
H4 momentum is reversing upward, and if a strong bullish candle breaks above the 4028 resistance level, it will confirm a bullish reversal, potentially leading to a 5-candle H4 uptrend within today’s session.
H1 Timeframe:
H1 momentum is preparing to turn downward, suggesting a short-term pullback may occur before the next upside continuation aligned with the broader H4 trend.
________________________________________
🔹 Wave Structure
D1 Timeframe:
Current data still supports the scenario that the market is forming Wave (4) in yellow.
However, more time is needed for a clear confirmation.
If D1 momentum enters the overbought zone without price creating a new high, that would give us additional confirmation of this wave count.
In the short term, price may continue rising for another 2 days.
H4 Timeframe:
The scenario of Wave (4) in purple within Wave (3) in yellow remains valid and has not been invalidated.
If price breaks above the 4379 high, it would confirm the formation of Wave (5) in purple, signaling the start of a strong bullish move.
At present, price movement remains choppy and overlapping, showing no clear trend direction — hence, we need to monitor price action closely.
With H4 momentum turning upward and resistance around 4028 forming a symmetrical triangle pattern, I expect a bullish move of 4–5 H4 candles today.
A decisive breakout above 4028 would further reinforce this bullish scenario.
H1 Timeframe:
The current H1 structure may be forming either:
• Wave X within the larger D1 structure, or
• Wave (5) in purple within the H4 structure.
In either case, we can expect a short-term upward move in line with H4 momentum.
Currently, price is hovering around the 4017 resistance zone, while H1 momentum is preparing to turn downward — therefore, a short-term correction toward the 3953 liquidity zone is expected.
This area will serve as a potential buy zone.
________________________________________
🎯 Trading Plan
• Buy Zone: 3954 – 3952
• Stop Loss: 3944
• Take Profit 1: 4050

Core Data and Event Analysis for the Super WeekCore Data and Event Analysis for the Super Week
The upcoming week will see a dense window of key data releases and events, featuring "PMI + ADP Employment + Central Bank Rate Decision" — each with the potential to break the current range-bound market pattern for gold:
Nov 3: Global Manufacturing PMIs
Market expectations point to a reading of 49.2 for the U.S. October ISM Manufacturing PMI, while China’s SPGI Manufacturing PMI is projected to remain below the 50.0 expansion-contraction threshold at around 49.0%.
- A U.S. PMI print below 48.5 would reinforce expectations of economic slowdown, fueling bets on monetary easing and lifting gold sentiment.
- A reading above 49.5, however, could further weigh on gold prices by signaling relative economic resilience.
Nov 5: U.S. ADP Employment Report
As a leading indicator for nonfarm payrolls, the ADP report is expected to show 170,000 new jobs added in October.
- If the actual figure falls below 150,000, the probability of a Fed rate cut in December may rise above 70%, directly driving gold to test the 4,040 USD resistance level.
- A print above 200,000 could trigger a pullback in gold to the 3,970 USD support zone.
Nov 6: Bank of England (BoE) Rate Decision
Market sentiment is divided ahead of the BoE meeting: most institutions anticipate rates to stay unchanged at 4.0%, but Goldman Sachs forecasts a 25-basis-point cut.
- Should the BoE initiate an interest rate cut cycle, it would boost global expectations for monetary easing, providing indirect support to gold prices.
Nov 7: Collective Remarks by FOMC Members
Five core members of the U.S. Federal Open Market Committee (FOMC) will deliver speeches. Key focus will be on their comments regarding a potential December rate cut and inflation trends.
- Hawkish signals (e.g., emphasizing persistent inflationary pressures) may trigger a short-term correction in gold.
- Dovish comments (e.g., noting signs of softening in the labor market) are likely to act as a catalyst for gold to break above key resistance levels.
Next week's trading strategy and analysis
buy:4000-4010
tp:4025-4035-4100
sl:3995

xauusdsimple pattern trade for those who trade them. 3300 would be target with extension at around 3100.
