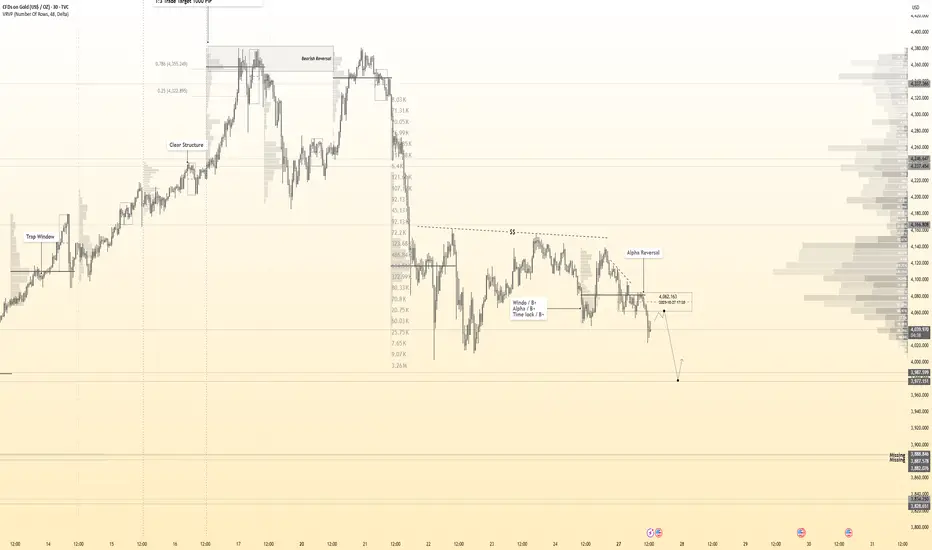
( Gold Protocol ) Bearish After Break Detected Status: Active Reversal Protocol
Symbol: Gold
Session: London–New York Overlap (Smart Exit Window)
Confidence Level: ★★★★★ ( Hanzo Volume Detected )
☄️ Bearish After Break Out 4005
Reasons
1. Alpha Sequence Engaged
— Smart flow detected within Hanzo precision range.
2. Volume Window Synced
— Session energy aligns with internal volume pulse.
3. Liquidity Cycle Active
— Engineered sweep confirms smart money transition.
4. Time Lock Confirmed
— Market phase locked with directional intent.
5. Volume Map Aligned
— Cluster balance reveals real directional flow.
6. Hanzo Wick Detected
— Manipulation wick verified under Alpha filter.
⤵️Every like & comment on our TradingView posts helps us grow. More engagement means more exposure, which benefits everyone in the community!
Trade ideas

Busy trading week coming up!!The trading week of November 3–7 is considered a pivotal period for international financial markets. A series of high-level economic data including manufacturing and services PMIs, ADP non-farm payrolls, trade balances, and interest rate decisions from major central banks will create a mixed picture of the global economic cycle. Meanwhile, statements from Federal Reserve officials and geopolitical developments can reinforce or distort monetary policy expectations later in the year.
🔹 Monday – Global PMI:
PMI figures from China, Europe, the UK, and the US kick off the week, reflecting the overall health of global manufacturing. Weak data could boost expectations for monetary easing, while stronger results may reinforce inflation-control policies. Additionally, the outcome of the OPEC+ meeting could impact oil prices and inflation trends.
🔹 Tuesday – Monetary Policy & Trade:
Focus turns to the RBA (Australia) rate decision and Canada’s trade balance. The market expects the RBA to keep rates unchanged at 3.6%, but a “hawkish” tone could trigger volatility in AUD. Speeches from Fed and BoC officials will also provide further clues on the 2025 rate-cut cycle.
🔹 Wednesday – Services & Employment:
The US Services PMI and ADP employment report will take center stage. These data points often provide early hints for the Non-Farm Payrolls report. Crude oil inventories from API and EIA will continue to influence oil prices and inflation expectations.
🔹 Thursday – European Data & BoE Decision:
The Bank of England may cut interest rates by 25 basis points to 3.75% amid recession concerns. Germany’s retail sales and industrial production figures will offer insights into the region’s economic health.
🔹 Friday – China & the Fed:
China’s trade balance and a series of speeches from five FOMC members will dominate attention. Any comments related to inflation or December rate decisions could cause sharp moves in USD and gold.
Three Key Risks to Watch:
1️⃣ Data Divergence: PMI or ADP figures may diverge significantly from official data, sparking volatility in market expectations.
2️⃣ Policy Surprises: Unexpected moves or tone shifts from the RBA or BoE could trigger market shocks.
3️⃣ Geopolitics & Liquidity: Escalating tensions in Russia–Ukraine or the Middle East, along with oil price swings, could drive safe-haven flows into gold and USD.
Technical analysis of OANDA:XAUUSD
Gold price is hovering around the $4,000/oz mark, after recovering slightly from the 0.382 Fibonacci support zone at $3,972/oz. The recent decline remains within a short-term correction channel, but selling pressure has slowed as the RSI exited the oversold zone and showed signs of forming a technical bottom.
The EMA21 (around $4,055/oz) is currently acting as an important resistance. If the price breaks above this level decisively, the short-term correction structure could be completed, opening a new uptrend towards the $4,128–$4,200/oz area (Fibo 0.236 and the most recent old peak). Conversely, if gold fails to surpass the EMA21, the correction could continue towards $3,846 or $3,720/oz – the next two support zones corresponding to the Fibo 0.5 and 0.618 levels, respectively.
Note: RSI momentum is still weak, so further confirmation with trading volume and reversal candlestick signals is needed before opening a long position.
SELL XAUUSD PRICE 4091 - 4089⚡️
↠↠ Stop Loss 4095
→Take Profit 1 4083
↨
→Take Profit 2 4077
BUY XAUUSD PRICE 3954 - 3956⚡️
↠↠ Stop Loss 3950
→Take Profit 1 3962
↨
→Take Profit 2 3968

GOLD → Price stuck in range after Fed speech FX:XAUUSD continues to battle for the $4,000 zone. The fundamental backdrop has a hint of unpredictability following the Fed's statement. Technically, the range of 3,915-4,015 is developing
Key factors: US shutdown (4th week): Weighs on the economy and the dollar, supporting gold as a safe haven. However, the Fed toughened its tone yesterday: It cut rates by 25 basis points, but Powell ruled out guarantees for a cut in December. Trump and Xi meeting: Agreements reached on soybeans and rare earths, reducing demand for defensive assets.
Gold balances between shutdown risks and monetary policy tightening. Growth is only possible if macro statistics deteriorate or geopolitics escalate.
Resistance levels: 4015 - 4050
Support levels: 3980 - 3960 - 3915
Gold may continue its correction from the 4015 - 4050 zone to 3950 - 3900 if the bulls are unable to keep the price within the upper range. However, if the market continues to buy the metal (there are no fundamental reasons for this yet) and the price closes above 4015, there may be a chance for growth to 4050 - 4085.
Best regards, R. Linda!

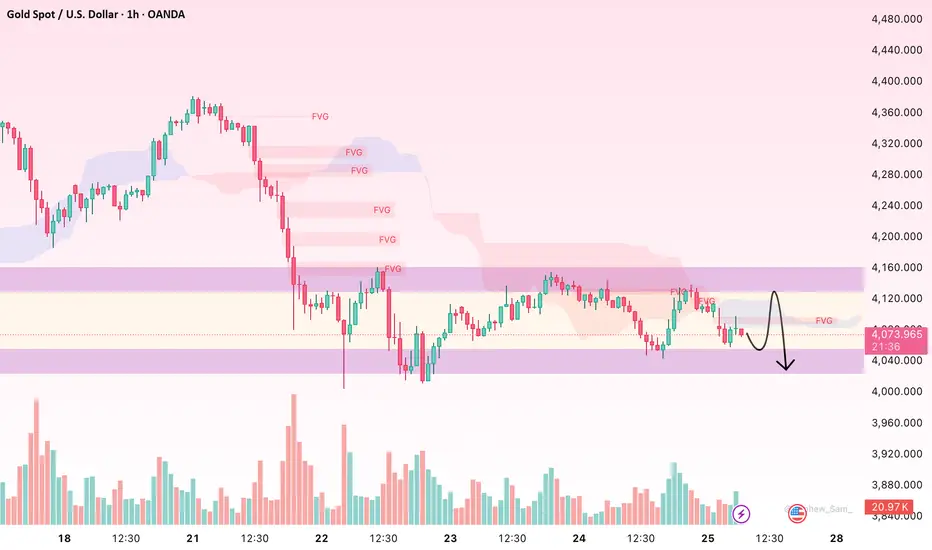
Gold consolidates after sharp decline – key levels aheadHello everyone, gold (XAU/USD) is trading around $4,080 after a drop of nearly 7.6% from the $4,380 peak. The decline has paused and the market has moved into a narrow consolidation zone between $4,050 – $4,120, reflecting cautious sentiment before choosing the next direction.
On the 1H chart, we can clearly see a series of Fair Value Gaps (FVG) still lying above price, especially around $4,110 – $4,160 and $4,240 – $4,280 – areas of liquidity that have not yet been reclaimed. However, price remains below the Ichimoku cloud, which means the dominant trend is still bearish. Selling pressure has cooled down, but buyers are not strong enough yet to trigger a confirmed reversal. Trading volume is gradually decreasing, showing that the market is waiting for a catalyst from macro news – consistent with the current environment as investors monitor US–China trade developments and upcoming US economic data.
Structurally, the current bounce appears more like a technical correction rather than a meaningful trend reversal. Gold could continue to recover toward $4,120 – $4,140 to fill nearby FVGs, but this is also a close resistance area where sellers are likely to reappear. If price gets rejected here, $4,040 – $4,000 becomes the next liquidity sweep target. And if $4,000 breaks, the bearish extension could reach $3,960 – $3,920 – a key H4 equilibrium zone where strong demand previously stepped in.
In the short term, I don’t see a sustainable bullish trend unless the Fed signals earlier-than-expected rate cuts or a major geopolitical shock re-ignites safe-haven demand. Without a strong catalyst, the most reasonable scenario is continued consolidation within the $4,000 – $4,200 range before the next major move develops.
What do you see here – technical recovery or a bull trap before the next leg down?
Wall Street Weekly Outlook - Week 45 2025 [03.11.- 07.11.2025]Wall Street Weekly Outlook - Week 45 2025
📅 November 3 – November 7, 2025
Let’s kick off an exciting new trading week — and a brand-new trading month! 🚀
Seasonal factors often play a major role in November and December, and I’ll break them down for you in this week’s video. 🎥📈
Sit back, enjoy the overview, and dive into the world of banks, hedge funds, and institutional flows — with exclusive insights into how the pros are positioned right now. 🧠💼📊
💡 Bonus segments: Strategies, setups & market psychology — everything you need to know for the week ahead. ⚡️
📘 Topics covered in this week’s outlook:
🏛 Seasonality in the Nasdaq:
🥇 Seasonality in Gold:
... and many more charts & concepts in the video! 🎬📊
💬 I’m looking forward to your questions, comments, and an active discussion here on TradingView!
👋 Best,
Meikel

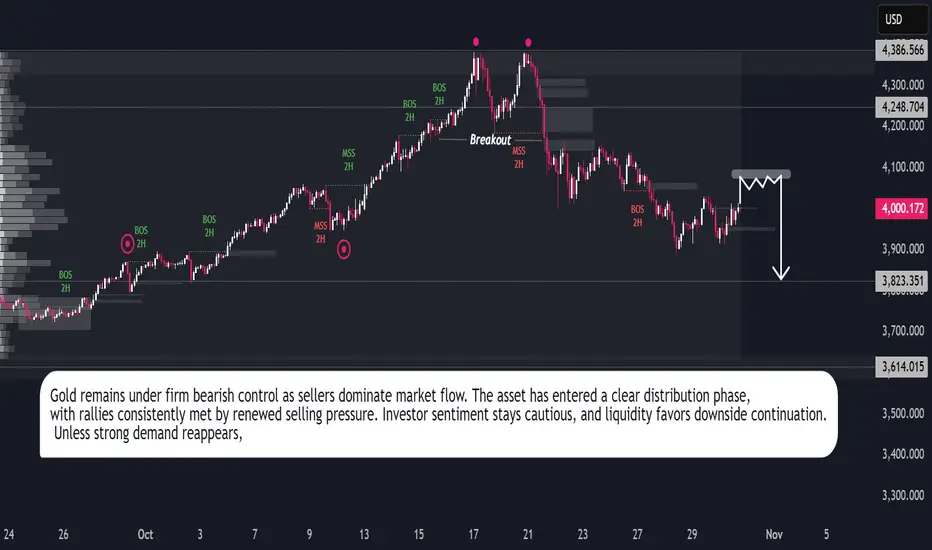
Gold Declines as Sellers Dominate the MarketGold is undergoing a controlled correction phase after an extended period of sustained gains. Market behavior over recent sessions reflects a shift from expansion to contraction as liquidity flow decreases and momentum weakens across key time horizons.
The previous upward cycle attracted substantial speculative interest, but current market dynamics suggest profit-taking by institutional participants and reduced accumulation from large holders. The recent structural shift confirms that sentiment has turned defensive, aligning with global market caution amid evolving economic conditions.
Despite short-term consolidation, the broader setup indicates that gold remains sensitive to global financial stability concerns and policy signals. Market participants are now waiting for clarity on upcoming economic data and interest rate outlooks, which could determine whether the correction deepens or transitions into a new accumulation phase.
In the near term, volatility is expected to remain elevated as investors reassess exposure levels. The prevailing outlook maintains a cautious bias, with traders closely observing how price reacts to continued shifts in liquidity and macro sentiment. Sustained capital outflow from hedge assets could pressure gold further, while renewed demand for safety could limit downside potential in the medium term.

XAUUSD-seeking $4,000 region?As my H4 chart shows, gold did make a double top a few days ago and then crashed. You can give credit for this massive 3,800 points move to profit taking or economic uncertainty or any technical reason, maybe a combination but it really does not matter.
What does matter is that we now have a double or triple top indicating that we have more room to the down side. I am seeing a medium term bearish move followed by a consolidation and now it may be that we will get a breakout (to the down side) to give us a bearish continuation.
How far will we go? I have no idea but the round number 4,000 followed by 3,950 do make sense. If all this works out as I anticipate, it may be a good idea to close a partial position, move the stop to a level of small profit and then trail the price action.

XAUUSD: Correction Phase Aiming Toward 3,900 SupportHello everyone, here is my breakdown of the current Gold setup.
Market Analysis
Gold (XAUUSD) has shifted from a strong bullish phase into a clear bearish structure after failing to sustain momentum above the 4,130 Resistance Zone. The market initially traded within an Upward Channel, forming a steady series of higher highs and higher lows until buyers lost strength near the top of the range. A breakout from the channel confirmed the end of the bullish impulse, followed by a range formation and multiple fake breakouts, indicating indecision and growing selling pressure. Eventually, the market broke below the range, retested the resistance area, and established a Downward Channel, showing that sellers have regained control.
Currently, Gold is moving within this descending structure, respecting both the upper and lower boundaries of the channel. The Resistance Zone around 4,130 has once again acted as a strong supply area, rejecting price and pushing it lower toward the Support Zone near 3,900.
My Scenario & Strategy
From my perspective, XAUUSD is likely to continue its short-term bearish correction toward the 3,900 support level, which aligns with the lower boundary of the channel. A successful test of this area could trigger a short-term reaction or even a potential reversal if buyers step in.
As long as price remains below the Resistance Zone (4,130) and within the Downward Channel, the bearish sentiment remains dominant. A confirmed breakdown below 3,900 could open the door for a deeper move toward the 3,850–3,820 zone. For now, I remain bearish in the short term, looking for short opportunities from the upper channel resistance with a primary target at 3,900.
That's the setup I'm tracking. Thank you for your attention, and always manage your risk.

XAUUSD: Bulls vs. Resistance — 4050 Decides the Next MoveIn yesterday’s analysis, I mentioned that after the reversal from the 3920 support zone, Gold (XAUUSD) could continue higher toward the 4050 resistance area.
Indeed, that target has been reached, followed by a 600-pip leg down overnight.
At the moment, the price is resuming its upward move and is trading back above $4,000, around 4025.
Going forward, I expect volatility to remain high. If the bulls fail to sustain the price above 4050, another leg to the downside could follow.
For now, I’m out of the market, waiting to see whether we’ll get another test of 4050 — and more importantly, how the price reacts in that zone. 🚀

Gold Preparing to Continue Its Bullish Move After ConsolidationHello traders, I want share with you my opinion about Gold. Gold has maintained a strong bullish structure over the recent period, forming a clear ascending channel that has been respected multiple times. Each correction has been followed by strong bullish impulses, confirming that buyers remain in control of the long-term direction. After reaching the 4,368 Resistance Level — which coincides with the upper boundary of the channel — the market entered a range phase, signaling consolidation after an extended rally. The current price action has formed a secondary support zone near 4,050 – 4,080, also aligned with the ascending support line of the broader channel. Currently, the price is moving inside a range structure (Buyer Zone to Seller Zone), consolidating just above the main ascending support line. In my opinion, this area represents a critical accumulation zone, where buyers are likely preparing for another upward push. I expect that after testing the Buyer Zone, the price will find strong support and initiate a new bullish wave toward the Seller Zone and the Resistance Level at 4,368. A confirmed breakout above the resistance line of the local descending structure would validate this bullish continuation scenario. Please share this idea with your friends and click Boost 🚀

THE KOG REPORTTHE KOG REPORT
Quick KOG Report this week.
Firstly, we would say it’s the first trading day of the new month so maybe an idea to let the market find it’s feet before jumping in. We’re only going to share the potential path this week and the red box target levels on the breaks. We’ll also stick with some of the red boxes from last week with the new levels to watch out for.
RED BOXES:
Break above 4010 for 4016, 4030, 4044 and 4050 in extension of the move
Break below 4001 for 3995, 3986, 3971 and 3959 in extension of the move
Please do support us by hitting the like button, leaving a comment, and giving us a follow. We’ve been doing this for a long time now providing traders with in-depth free analysis on Gold, so your likes and comments are very much appreciated.
As always, trade safe.
KOG

XAUUSD – Bearish Pressure After Historical HighsGold prices continue to experience significant downward pressure as profit-taking surges after a strong rally. From the historical peak of nearly 4,400 USD/ounce, gold has lost nearly 12 million VND per tael , and is at risk of falling further if the 4,000 USD/ounce level cannot hold.
On the H4 chart, XAUUSD is forming a bearish trend with a clear price structure. Gold is facing a downward trendline , and each recovery from the lows encounters strong selling pressure . Currently, the price is hovering around 3,935 USD, near the support zone at 3,990 USD, and could drop further to 3,750 USD if this level fails to hold.
Key factors affecting the price:
USD recovery: The strengthening of the US dollar and rising US Treasury yields have reduced gold's appeal, as it does not yield interest.
Increased risk appetite: Progress in US-China trade talks is drawing funds towards equities and industrial commodities.
Trading Strategy: Sell gold around 4,000 USD, with a target of 3,750 USD, and stop loss above 4,050 USD.
Conclusion: XAUUSD remains in a mild bearish trend, with further downside potential if the 4,000 USD level is broken.

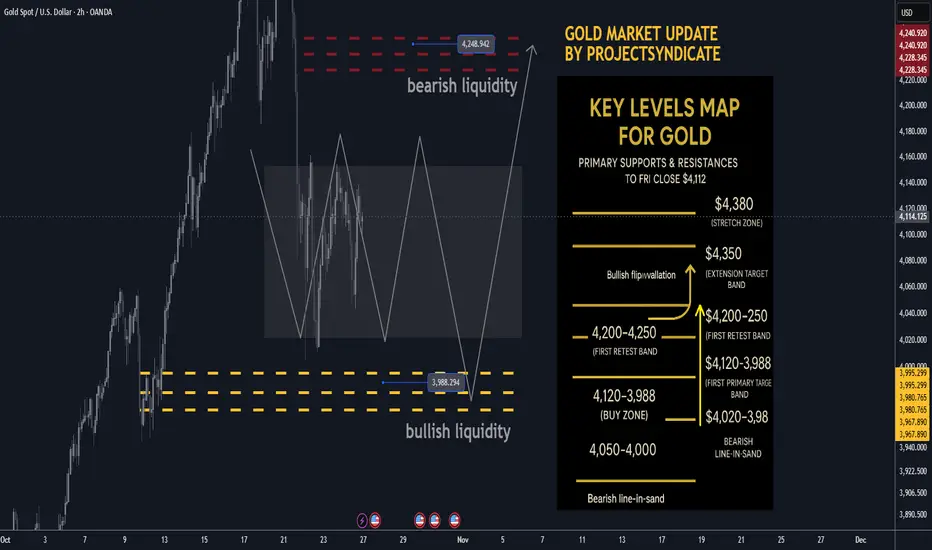
Gold next week Key S/R Levels and Outlook for Traders🔥 GOLD WEEKLY SNAPSHOT — BY PROJECTSYNDICATE
🏆 High/Close: $4,380 → ~$4,112 — lower close within range; momentum cooled but holding the $4,000 handle.
📈 Trend: Uptrend intact > $4,000; oversold into $4.1k—setup favors reflex bounce.
🛡 Supports: $4,120–$4,080 → $4,020–$3,988 (bullish liquidity) → $4,000/3,980 must hold.
🚧 Resistances: $4,200 / $4,250 (bearish liquidity) / $4,300 → stretch $4,350–$4,380.
🧭 Bias next week: Buy-the-dip $4,020–$3,988; momentum regain above $4,200 targets $4,250 → $4,300–$4,350. Invalidation < $3,980 risks a deeper flush to $3,950.
🌍 Macro tailwinds:
• Policy: Easing real yields supportive on dips.
• FX: Softer USD tone = constructive backdrop.
• Flows: Central-bank buying + tactical ETF interest underpin $4k.
• Geopolitics: Trade/tariff & regional tensions keep safety bids alive.
🎯 Street view: Select houses still float $5,000/oz by 2026 on policy easing & reserve-diversification narratives.
________________________________________
🔝 Key Resistance Zones
• $4,200–$4,230 immediate supply from the weekly close
• $4,250 bearish liquidity / primary target
• $4,300–$4,350 extension band
• $4,380 prior spike high / stretch
🛡 Support Zones
• $4,120–$4,080 first retest band below close
• $4,020–$3,988 buy zone (bullish liquidity)
• $4,000 / $3,980 must-hold shelf
________________________________________
⚖️ Base Case Scenario
Expect pullbacks into $4,120–$4,080 and $4,020–$3,988 to attract buyers, rotating price back toward $4,200 then $4,250. Acceptance above $4,250 invites a drive into $4,300–$4,350.
🚀 Breakout Trigger
A sustained push/acceptance > ~$4,250 unlocks $4,300 → $4,350, with room toward $4,380 if momentum persists.
💡 Market Drivers
• Real-yield drift lower (supportive carry backdrop)
• USD softness aiding metals
• Ongoing CB accumulation; ETF flows stabilizing on dips
• Headline risk (trade/geopolitics) sustaining safe-haven demand
🔓 Bull / Bear Trigger Lines
• Bullish above: $4,020–$4,100 (buyers defend pullbacks)
• Bearish below: $3,980 (risk expands; threatens $3,950)
🧭 Strategy
Buy low from bullish liquidity (~$3,988) with a target at $4,250; oversold conditions favor a strong bounce. Add on strength above $4,200 toward $4,300–$4,350. Keep risk tight below $3,980–$4,000 to invalidate.
( Gold Protocol ) Bearish Reversal Detected
Status: Active Reversal Protocol
🆚Symbol: Gold
Session: London–New York Overlap (Smart Exit Window)
Bearish Reversal 4062
☄️ Volume Surge Confirmed — Sellers dominate exhausted highs
☄️ Session Aligned — Smart money exit window open
☄️ Cluster Shield Active — Supply imbalance verified
☄️ Delta Shift Negative — Buyers trapped above
☄️ POC Retest Completed — Liquidity absorbed at resistance
☄️ Structure Break Pending — Bearish bias confirmed
🚀 Logic: This is engineered reversal, not prediction.
🚀 Objective: Controlled execution with minimal drawdown.
Goal: Controlled Both Sides with minimal drawdown
★★★★★ (Smart Money Aligned)
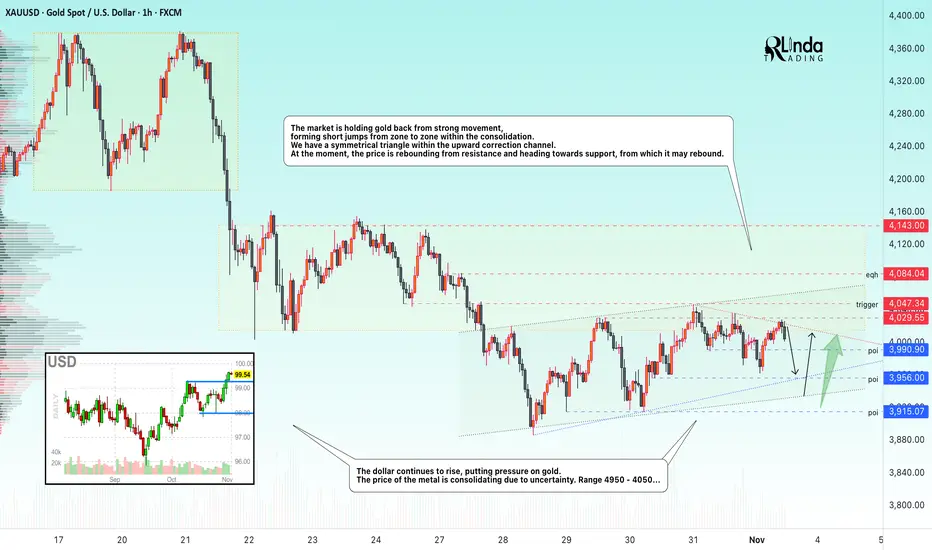
GOLD → Consolidation within a symmetrical triangle The market is holding gold back from strong movement, forming short jumps from zone to zone within consolidation. We have a symmetrical triangle within an upward correction channel.
Key supporting factors:
The US shutdown is becoming the longest in history, increasing economic risks.
China is canceling tax breaks for retailers. Trump may announce new tariffs related to China.
ISM Manufacturing PMI data (US) is ahead - a rare indicator during the shutdown.
The probability of a Fed rate cut in December has fallen to 69% (from 91.7% a week ago).
Technically, consolidation may continue until the price breaks one of the boundaries of the symmetrical triangle.
Support levels: 3990, 3956, 3915
Resistance levels: 4030, 4047, 4085
Traders are uncertain about the future direction, and as a result, the market is consolidating. There are limit levels both below and above that are holding back movement. Accordingly, until there is a clear fundamental background, it is possible to focus on trading within the channel. I expect a rebound from 3960 for a retest of resistance. However, a close above 4030 could trigger growth, while a close below 3956 would confirm the weakness of the market and trigger a fall to 3900.
Best regards, R. Linda!
THE KOG REPORT - UpdateEnd of day update from us here at KOG:
Interesting open on the markets with gaps all over the place. Gold managed to break below on the open then continuing to complete not only the red box targets but our Algo target as well. We would have liked higher to get in on this move, ideally we wanted 4055 during the NY Session but it wasn't to be. The move commenced and those that got in managed to bag themselves a decent trade short.
For now, due to another stretch on buyers, we would like to see where we close today. We have circled the potential play with a swing high looking like it will attempt the 4030 level while the red box below will need to break in order to continue to our long awaited target below.
As always, trade safe.
KOG

THE KOG REPORT - UpdateEnd of day update from us here at KOG:
Simple one this evening. Yesterday we wanted to see which way it broke, the red boxes activated, the short hit target, we then got the TAP AND BOUNCE, red box activated with the hot spot and Excalibur, and BOOM! RIP And FLIP.
Now, support below at the 3930 level with resistance 3955 could be the play but the close here is important! The pull back here is huge, all the way up to the level of 4050 which needs to break to change the structure, otherwise, more downside is on the horizon.
From Camelot this morning:
Red boxes:
Break above 3909 for 3920✅ and 3933✅ in extension of the move
Break below 3890 for 3865, 3955 and 3848 in extension of the move
As always, trade safe.
KOG

Gold resumes upward trend after testing 3900📣Gold resumes upward trend after testing 3900
From my update yesterday, gold is clearly rising. The market is positioned for a rate cut by the FED today.
The FED is expected to cut rates by 25 bps to 4% vs 4.25 previous.
Whether this is good or bad for gold is another topic, as gold moves as it wants dominated by a strong bullish trend.
However, our area near 3900 stopped the price, indicating that who created the bearish movement was taking some profits and may be is back in the game to make more profits.
I think Gold can go higher today, despite the big mess that FOMC could create today.
You may find more details in the chart!
Thank you and Good Luck!
❤️PS: Please support with a like or comment if you find this analysis useful for your trading day❤️

Gold Outlook: Bears Stay in ControlGold continues to operate within a bearish market environment characterized by persistent liquidation and declining momentum. The recent structural shift reflects an ongoing reallocation of capital away from defensive metals toward higher-yield instruments, signaling a broader change in market positioning.
Trading activity indicates that each upward movement is being met with renewed selling interest, suggesting limited participation from institutional buyers. This behavior aligns with the prevailing sentiment of caution, as investors prioritize stability over speculative exposure.
The broader outlook remains subdued, with market conditions favoring continued downside until clearer evidence of renewed demand emerges. Gold’s performance reflects a phase of market adjustment, where declining liquidity and moderate volatility reinforce the persistence of bearish sentiment across the short-term horizon.
XAU/USD (Gold Spot vs. U.S. Dollar) on the 30-minute timeframe..XAU/USD (Gold Spot vs. U.S. Dollar) on the 30-minute timeframe, using the Ichimoku Cloud with a clearly drawn ascending trendline providing support.
Here’s what’s visible:
Current price: around $4,002 – $4,009.
The price is sitting above the trendline and at the edge of the cloud, suggesting possible continuation to the upside if support holds.
A target point is drawn on your chart near $4,120.
✅ Target:
Primary Target Point: ≈ $4,120
That’s roughly a +110 to +120 point potential move from current levels.
If you want to manage risk:
Stop loss could be set just below the trendline or cloud base — around $3,975 – $3,980.
That gives a risk–reward ratio of roughly 1:3 depending on my entry.

GOLD (XAU/USD): Important Bearish Breakout📉GOLD has a high potential to continue falling
after a breakout of a key daily/intraday horizontal support.
Next supports: 3900

Is Gold Losing Steam or Building Strength for a New Rally?Hello everyone, gold is currently pausing around $4,017/oz after a strong rally throughout Q3, and the market is beginning to show signs of exhaustion in the trend. On the 4H chart, price no longer maintains the strong upward momentum seen before; instead, it is moving within smaller pullbacks and narrowing ranges – a typical sign of accumulation before the market chooses its next direction.
The macro backdrop is also contributing to gold’s slowdown. The recent meeting between the US and China ended positively, easing trade tensions – meaning the demand for safe-haven assets has softened. At the same time, China officially halted VAT tax deductions on gold from 1 November, raising the cost of physical gold purchases and cooling domestic demand. In the US, the Fed remains cautious, unwilling to commit to early rate cuts while employment data still indicates economic resilience. The USD Index has rebounded close to the 100 level, and bond yields remain elevated, putting natural corrective pressure on gold after its heated ascent.
From a technical standpoint, after hitting the $4,380 peak, gold has retraced to $3,950 and is now moving sideways within the $4,000 – $4,050 zone. This is a point of equilibrium, where neither buyers nor sellers are ready to take control. The $4,045 – $4,080 range is a notable resistance area, overlapping with an unfilled Fair Value Gap. If buying momentum is insufficient, price may easily be rejected there. Conversely, the $3,950 – $3,970 area continues to attract consistent buying interest, forming a reliable support base. Trading volume has been gradually declining, showing that the market is storing energy waiting for a catalyst. The upcoming NFP or CPI data could be the spark for the next major move.
If gold fails to break above $4,045 while the USD continues to strengthen, price could correct toward $3,960 to cool off before attempting a new rally. In contrast, if US economic data weakens or the Fed signals a softer stance, gold only needs to close above $4,050 to regain upside momentum and potentially move toward the $4,100 – $4,150 zone.
Right now, this is not an ideal area to open new positions, as price sits in the middle of balance – not risky enough to sell, but not safe enough to buy. The most sensible strategy is to wait for reactions at two critical levels: $3,960 and $4,045. A confirmed breakout or breakdown will be the market’s answer.
So, what about you – are you leaning towards a corrective move, or do you believe gold is simply gathering strength before returning to its bullish path?

XAU/USD Gold Looking strong bullish trend resistance breakout📈 XAU/USD (Gold) Update 💰
🔥 Bullish momentum continues as price breaks above key resistance at 4017!
🎯 Technical Targets:
1️⃣ 4045
2️⃣ 4083
3️⃣ 4136
⚠️ Use proper risk management – Always protect your capital.
💬 Like 👍 | 💭 Comment 💬 | 🔁 Share 🔁
#Gold #XAUUSD #Trading #Forex #TechnicalAnalysis #PriceAction #BullishTrend #RiskManagement
