What will happen to gold on November 3rd?
I. Market Analysis
Trend Structure
Weekly Chart: Price is below the 5-week moving average, with the MACD showing a bearish crossover. Bearish forces dominate in the near term. However, the long-term ascending trendline support is near $3900. The long-term trend remains cautiously bullish as long as this level holds decisively.
Daily Chart: Moving averages are in a bearish alignment, and the Bollinger Bands are expanding downward, with price pressured near the middle/lower band. Key resistance is at 4046. Support is focused in the 3972-3950 zone. A break below 3972 could lead to a further decline towards 3950-3900.
Key Support & Resistance Levels
Resistance Zone: 4010 (Weakness Boundary) → 4023-4035 (Core Short Area) → 4047-4055 (Strong Resistance).
Support Zone: 3980 (Initial Support) → 3950-3955 (Long Area) → 3915-3885 (Deep Correction Target).
II. Trading Strategy
Core Idea: Prioritize selling on rallies, with opportunistic buying near key support levels. Strict risk control is essential.
Short Strategy (Primary)
Entry Zone: Enter short positions in batches between 4030-4035. Consider adding to shorts if price reaches 4047-4055.
Stop Loss: Above 4040-4060 (Adjust flexibly between 8-10 pips based on position size).
Targets: First target 3980, Second target 3960-3950 (Hold if broken).
Long Strategy (Secondary)
Entry Condition: Consider light long positions upon stabilization in the 3950-3955 zone after a pullback.
Stop Loss: Below 3940 (8-10 pips).
Targets: First target 3980-4000, Second target 4010 (Follow up if broken).
III. Risk Control Essentials
Position Management: Single trade position ≤ 5% of capital. Avoid heavy positions.
Stop-Loss Discipline: Strictly place stops for shorts above 4060 and for longs below 3940.
Contingency Alert: Monitor the US Dollar Index, Fed policy动向, and geopolitical risks closely. Adjust strategies promptly if key levels are breached.
IV. Summary
Gold's short-term technical posture is bearish, but the long-term trend requires monitoring the effectiveness of the 3900 support.
If price rallies and faces resistance in the 4030-4055 zone next Monday, prioritize short entries.
If price pulls back and stabilizes near 3950, consider light long positions for a bounce.
If price strongly breaks above 4060 or below 3940, a reassessment of the trend will be necessary.
Trade ideas

Gold Analysis (November 3rd)Gold Analysis (November 3rd)
Gold is caught in a tug-of-war between bulls and bears, awaiting a breakout signal.
During today's (Monday) US session, the gold market appeared particularly "indecisive," with prices fluctuating repeatedly within a narrow range. This "bottoming out and rebounding before facing pressure again" pattern is a typical reflection of the recent market's "super sweeping" – both bulls and bears seem hesitant, neither willing to take the lead.
News: Hawkish rhetoric and risks coexist, leaving the market in a dilemma.
The market is currently being pulled by two opposing forces:
On one hand, there is "hawkish pressure" from the Federal Reserve. The hawkish statements from several officials last Friday further dampened market expectations for interest rate cuts, leading to a stronger dollar and putting pressure on gold.
On the other hand, there is real "safe-haven support." Facing the risk of a shutdown, coupled with continued international geopolitical tensions, these uncertainties act like an invisible hand, supporting gold prices from below.
In this context, the strong wait-and-see sentiment in the market is not difficult to understand. In addition, traders are reminded that North America has entered winter time, and trading and data release times for commodities such as gold, silver, and WTI crude oil are delayed by one hour. Traders need to adjust their trading strategies accordingly.
Technical Analysis: Short-term oscillation with a bearish bias, long-term trend unchanged
From a chart perspective, gold is at a critical crossroads:
On the weekly chart, after a strong nine-week winning streak, gold finally closed with a large bearish candle, sounding the alarm for a correction. If the MA5 support is breached, it may further test the 3900 level. However, the moving average group and MACD indicator still show that the long-term trend has not been completely broken, and the bullish foundation remains.
On the daily chart, the appearance of a topping pattern and consecutive bearish candles confirm the downward trend from historical highs, and the correction pattern continues.
Focusing on the short term (1-hour chart), the situation is clearer. The rebound after the gap down in the morning session encountered strong resistance in the 4000-4030 area. The hourly chart's moving average system is bearish, clearly suppressing every price rebound. My View and Strategy
Frankly, after a significant pullback, gold is currently in a phase of "consolidation and finding direction." Personally, I believe that consolidation will be the main theme until a valid breakout occurs.
Therefore, in terms of trading, I prefer to remain patient and buy low and sell high within the range.
The key resistance level to watch is the 4045-4060 area, which is the bears' defense line.
The core support level to watch is the 3960-3980 line, which is the bulls' stronghold.
The market will not remain calm forever; this tug-of-war between bulls and bears will eventually be decided. Until then, what we need is calm and discipline, waiting for the market to find its own direction.

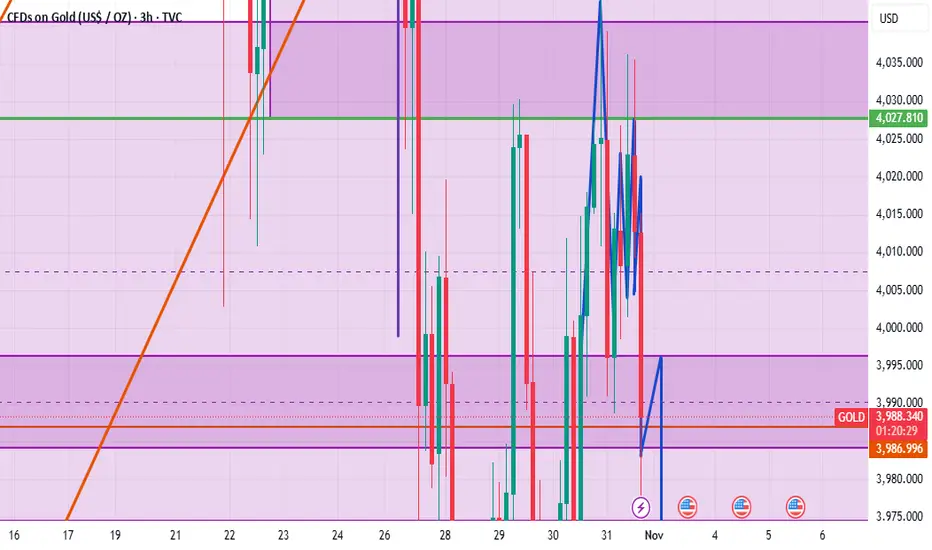
Speculative XAUUSDThis is just a current speculative position, on the 15min chart appears stopped out it isn't.
With the bullish incentive for the week I think another drawdown is due today.

GOLD: Will Go Down! Short!
My dear friends,
Today we will analyse GOLD together☺️
The in-trend continuation seems likely as the current long-term trend appears to be strong, and price is holding below a key level of 4,016.56 So a bearish continuation seems plausible, targeting the next low. We should enter on confirmation, and place a stop-loss beyond the recent swing level.
❤️Sending you lots of Love and Hugs❤️

Gold Trade Set Up Nov 3 2025Price is making HL/HH on the 1h and is now testing 15m Supply so i will only be looking for buys if price continues to make a HH but if price can respect this supply and make bearish internal structure on the 5m-15m i will look for sells down towards SSL

1:10RR GOLD BUY SETUP FOR THE WEEKWe are looking for a bullish setup for the week. Price has broke shifted structure to the upside so will be only looking for buys this week. On our chart we have a breaker block which also confluences with our 61.8% Fibonacci. That's where we will be looking to take our trade.
ENTRY:3982
TP:4053
SL:3974

GoldXAUUSD
- Bullish Channel as an corrective pattern in Short Time Frame
- RSI - Divergence
- Completed " 12345 " Impulsive Waves and " ABC " Corrective Waves
- Falling Wedge as an corrective pattern in Long Time Frame
- Order Block

Gold Range Compression — Breakout Imminent🟥 Resistance Zone (Key Supply Zone): 4028 – 4045
Price has tested this zone multiple times but failed to break through.
A clean break above this red zone will signal strong bullish continuation.
🟦 Support Zone (Key Demand Zone): 3995 – 4005
This is the immediate support keeping price from falling lower.
A break below this blue zone will confirm bearish momentum.
✅ Bullish Scenario
If price breaks and retests the red zone (4028–4045):
Expect upward continuation
Target 1: 4060
Target 2: 4095 – 4105
This matches the upward blue arrows on your chart.
✅ Bearish Scenario
If price breaks below 3995 and retests the blue zone as resistance:
Expect strong downward momentum
Target 1: 3960
Target 2: 3925
This matches the downward blue arrows shown.
✅ Current Bias
Market is neutral right now — sitting between support and resistance.
A breakout from either zone will decide the next direction.

GOLD - SELL - 200$ downsideAs per time cycles, Gold opened gap down on previous Monday and breaking the wedge it went down 200$ in 8 bars. Similarly today gold opened gap down on Monday and expecting it to go down 200$ in 8 bars. Therefore going Short on gold

Gold’s Pullback Is a Trap for the UnpreparedGold is not collapsing. It is consolidating after a historic surge, and the evidence across timeframes shows this dip is a high probability buying opportunity. Traders focused only on the short term are missing the bigger picture because the monthly and weekly charts reveal a powerful bull trend still intact.
The monthly timeframe tells the dominant story. Gold closed October at 3858.45, near its all time high of 4381.44, with the 1M RSI 7 at 95.44 and 1M ADX 14 at 63.15—confirming an extremely strong uptrend. The MACD histogram remains positive at 81.78, and price is trading well above all major monthly moving averages, including the 1M SMA 200 at 1592.71. This is not a market ready to reverse. It is a market pausing to digest gains before its next leg up.
On the weekly chart, the structure remains bullish. Price pulled back from 4381.44 to test the 3886.47 low, which aligns with the 1W SMA 10 at 3776.44 and the lower Bollinger Band at 2991.35—still far below current levels. The weekly ADX 14 is 53.91, signaling a strong trend, and the MACD histogram is still positive at 59.92. Even though the weekly RSI is overbought, that is normal in strong bull markets and does not signal an imminent reversal.
Now look at the daily chart. Price is at 4002.81, below the 1D SMA 10 (4096.48) and 1D SMA 20 (4080.89), creating short term bearish pressure. The daily MACD histogram is negative at –41.99, and RSI 14 is neutral at 52.48, suggesting temporary weakness. But crucially, price is holding above the daily pivot at 3989.09 and the 1D SMA 50 at 3808.41—a major support zone. The 3950.95 S1 pivot and 3877.38 S2 level offer clear downside buffers.
The 4 hour chart shows early signs of stabilization. Price is trading above the 4H SMA 20 (3982.52) and the MACD histogram has turned positive at 8.49, hinting at short term momentum building to the upside.
Short term, gold could test 3950 over the next 5 to 10 days as bears push for a deeper retracement. But the higher probability outcome is a bounce from this zone toward 4100, supported by 4H momentum and daily support alignment.
Medium term, within 4 to 8 weeks, gold is likely to reclaim 4250 and challenge the all time high near 4380. This aligns with the upper weekly Bollinger Band at 4140.24 expanding upward and sustained volume on up weeks.
Long term, by the end of Q1 2026, gold is positioned to reach 4700, based on the monthly R3 pivot at 4442.75 and the continuation of the primary bull trend confirmed by monthly ADX and MACD strength.
This pullback is not weakness. It is the market separating disciplined trend followers from emotional sellers. The technicals across timeframes confirm one truth: gold’s bull run is far from over.

XAUUSD – Rising Wedge Break & Bearish Continuation SetupGold has formed a rising wedge structure within a broader corrective downtrend, showing exhaustion in upward correction after the sharp selloff. Price has broken wedge support and is now retesting the breakdown zone, forming a lower-timeframe flag — a classic continuation pattern.
The structure suggests sellers are preparing for another impulse leg toward the previous demand zone, aligning with the broader corrective cycle after the strong bearish move from the highs.
Key Technical Confluences
Rising wedge structure inside downtrend
Clean breakdown followed by retest
Lower-high formation at supply zone
Bearish flag on retest confirming continuation pressure
Target aligned with key demand level around 3,886
Entry: Retest of wedge breakdown + bearish flag
Stop Loss: Above wedge retest / minor swing high
Take Profit: 3,886 support zone
Bias: Bearish while price remains below wedge retest zone.
Expecting continued downside as long as structure holds. Looking for momentum confirmation to the downside and managing risk as price approaches target.
📌 Trading continuation patterns requires patience — confirm rejection and protect capital.


Gold Trend Analysis 4-Hour Time Frame
Hi Traders
The analysis for this week is ideal for me according to this flash move.
Since the daily candlestick closed as a doji and indecisive, we mark the high and low range of this daily candlestick and refer to the 15-minute time frame. Depending on whether the high or low breaks or breaks out, we enter the trade.
Considering the liquidity of 4050 and the remaining orders, the balance of 15 minutes, one hour and 4 hours, which are important numbers 4062, 4075 and 4090, the upward movement can be considered initially to hunt liquidity and attract orders in these ranges, and then continue the price correction until we have liquidities at the bottom of the price, including 3915 and 3886 ... Good luck

GOLD READY TO BUYPROJECTION (BULLISH)📈📉👀🗞️
1. Fill out the IMB @ discount zone.
2. A sweep of EQL
3. A sweep of of SSL
4. A bullish BOS above IDM
5. A sweep of EQH
6. Fill out the IMB @ Premium zone
7. Asweep of BSL

Next week's trading strategy and analysisPolicy aspect: The loose tone of the Federal Reserve remains unchanged, and the liquidity dividend continues to be released.
The expectation for interest rate cuts remains flexible: The Federal Reserve cut interest rates by 25 basis points to 3.75%-4.00% as scheduled in October. Although Powell stated that an interest rate cut in December is "not inevitable", the CME FedWatch tool shows that the probability of a 25 basis point cut in December still reaches 67.8%, which is a decrease from 95.3% before Powell's speech, but the general direction of easing has not reversed. It is worth noting that the internal hawkish and dovish differences within the Federal Reserve have intensified (Milan advocates a 50 basis point cut, Schmid opposes a cut), and the meeting minutes of November may reveal more clues on easing, providing expected support for gold prices.
The termination of balance sheet reduction is a definite positive factor: The Federal Reserve clearly stated that it would end the reduction of the balance sheet on December 1 and fully reinvest the maturing bonds, releasing approximately 60 billion US dollars of liquidity to the market each month, equivalent to "implicit QE", directly reducing the holding cost of gold, and this policy dividend has not been fully priced.
There is room for economic data disturbances: The US government shutdown has led to the postponement of the release of several key data. Market judgments on the economic fundamentals are divided. If the ISM manufacturing PMI, non-farm payrolls, etc. data in the next week are not up to expectations (current expectations are PMI 49.2, non-farm payroll increase 170,000), it will further strengthen the expectation of easing.
Next week's trading strategy and analysis
buy:4000-4010
tp:4025-4035-4100
sl:3995

XAUUSD Next Week 03/11-37/11/2025Next week, gold will have 3 trading plans that you need to pay attention to:
1. If gold breaks through 4055 , we will wait for a retest to Buy
2. If gold falls to 3890-3910 and from the closing price, buy here with the target of both plans 1 and 2 to 4600 .
3. Gold breaks through the support of 3850 and shows signs of accumulation, it is likely to fall straight to 3705-3715 .
Note that all trading orders must have a stop loss to preserve capital!

XAUUSD – Corrective phase in progressGold is currently moving within a corrective phase, which appears to be developing as a WXY structure.
Price is now completing wave X, with one final minor wave C to the upside likely remaining.
The more probable scenario suggests a limited bullish move toward the 4140–4180 zone before continuing lower as part of wave Y.
Bullish trigger: 4046 (for the final leg of wave C)
Bearish alternative: A confirmed breakdown and consolidation below 3960 would invalidate the current count and shift focus to a continuation of the broader bearish move — in that case, the wave structure will be updated accordingly.

GOLD Short-Term Pullback 🔹 COT (Commitment of Traders)
(Last update: September 23, 2025 – data not refreshed due to the CFTC shutdown)
Gold (COMEX)
Non-commercial longs: 332,808 (+6,030)
Non-commercial shorts: 66,059 (+5,691)
→ The latest available data (outdated) showed an increase in both positions, with a stronger rise on the long side — indicating institutional accumulation in late September ahead of the October rally.
Although outdated, the COT report still reflects a mildly bullish structure, but no longer captures the current market dynamics after recent volatility.
🔹 FX Sentiment (Retail Positioning)
58% long / 42% short
📌 Retail traders remain moderately long on gold. This supports a short-term contrarian bearish bias, aligning with the ongoing corrective move in price.
🔹 Seasonality
Historically, October and November tend to be statistically bullish months for gold, with average gains between +2% and +4% over 10–20-year periods.
📌 Seasonal conclusion: the context remains bullish on a seasonal basis, with potential for recovery once the current correction stabilizes.
🔹 Price Action
After the strong bullish impulse that pushed XAU/USD into the 4,350–4,400 area, price entered a phase of consolidation/distribution.
Current structure shows:
Key resistance: 4,250–4,300
Main demand zone: 3,950–3,900
RSI remains neutral but continues to lose momentum, consistent with a possible minor bearish leg before a new bullish wave.
🎯 Main Scenario:
Expecting a continuation of the corrective phase toward 3,950–3,900, aligning with the daily demand area and a likely institutional reaccumulation zone.
From there, a potential bullish resumption could emerge within November’s seasonal strength.
⚙️ Invalidation: daily close below 3,850, which would compromise the medium-term bullish structure.

EXPECTATION FOR COMING WEEKS This sell today clears the way for a major sell from monday going to somewhere around 3860 before the rate and CPI buy start from there with momentum and incase the buy fail then that will lead to another long term sell , i will update anyway, no matter what happens.
LiamTrading - XAUUSD: Prospect of $5,000 USD and Priority BUY...LiamTrading - XAUUSD: Prospect of $5,000 USD and Priority BUY Strategy at POC $3973
Hello traders community,
Gold is positioned between an extremely optimistic long-term outlook (forecast of $5,000 USD in the next 12-18 months by Bank of America) and short-term technical adjustments.
Although Gold has broken the upward trendline, a sustainable downward trend has not been confirmed.
BUY positions are still prioritized!
🔥 LONG-TERM CONTEXT & INFLATION
Long-Term Driver: Gold prices adjusted for inflation have DOUBLED over the past 4 years.
Highlight: Gold reinforces its role as an anti-inflation asset as real prices soar to all-time highs.
📊 DETAILED TRADING PLAN (ACTION PLAN)
Strategy: Buy at POC Zone to leverage liquidity advantage.
🟢 BUY Scenario (BUY Primary) - Buy at High Value Zone
Logic: The $3973 - 3975$ zone is right above the Buy POC (highest value zone).
Entry (BUY): $3973 - 3975$
SL: $3968$
TP1: $3988$ | TP2: $4000
Buy Target 2: Buy when price retests the trendline around $4002$.
🔴 SELL Scenario (SELL Scalping) - Preemptive strike at resistance zone
Entry (SELL): $4032 - 4034$
SL: $4040$
TP1: $4022$ | TP2: $4015
📌 SUMMARY & DISCIPLINE (Liam's Note)With the $5,000 USD forecast and inflation factors, the risk of SELL is increasing.
Focus on BUY at POC $3973$ and absolute SL.
Trade responsibly and with discipline!

The end of goldGreetings, a pattern similar to the bullish trend has formed on the 4-hour timeframe, and as long as it is below 4000, it will reach 3600. May you be successful and victorious.

XAU/USD – Key Decision Point Before the Next Big MoveGold continues to consolidate below the major resistance zone at $4,060–$4,100, after a recovery from the $3,950 area. The market is currently testing an important structure level, and today’s reaction here will determine the next short-term trend.
Technical Outlook (H1 timeframe):
Immediate Resistance: $4,060 – $4,100
Major Resistance: $4,180 – $4,200
Support Zone: $3,950 – $3,900
Key Level to Watch: $4,000
If price breaks and holds above $4,060, bulls may gain momentum toward $4,150 – $4,200, forming a potential short-term continuation pattern.
However, a rejection below $4,060 could trigger another decline toward $3,950, and if that breaks, the next target lies near $3,860.
Trading Strategy:
Bullish Scenario: Wait for a confirmed breakout and retest above $4,060, then target $4,150–$4,200.
Bearish Scenario: Look for rejection signals at $4,060 or a break below $4,000 to sell toward $3,950 and $3,860.
RSI is showing a potential short-term overbought condition, so traders should remain patient and wait for price confirmation before entering.
Stay disciplined—gold is in a key reaction zone, and today’s close could define the next 2–3 sessions.
Follow for more daily gold trading strategies and updates.

XAUUSD 15m Analysis (31st October 2025) TRADE IDEA SWING
Happy Friday guys, take it easy. Cheers
BUY/SELL SCENARIOS:
BUYS:
1) Body Candle Close the 4046.35 level.
2) Retest the 15m Bullish CHOCH at the 4046.35 level.
3) Create a 3/5m Bullish Engulfing Candle to capitalise on BUYS towards the 4144.50 level.
SELLS:
1) Body candle close below the 4016.34 level.
2) Retest the 15m Bearish CHOCH at the 4016.34 level.
3)Create a 3/5m Bearish Engulfing Candle to capitalise on SELLS towards the 3915.50 level.
Trade smart, Trade according to your trading plans guys.
