Gold remains strongly bullish🟡 Gold remains strongly bullish!
Both the RMBS Smart Detector and TSD (Trend Strength Detector) indicators are showing strong bullish momentum.
The $4,000 area looks like a solid support and could be an attractive entry point for those who missed the rally.
This post is for educational purposes only and not financial advice.
Trade ideas

gold is not gold nowevery thing is clearon chart
gold will fall down in next 6 month to 3800 and then 3400
we will see this
not a good situation for holders

GOLD | Awaits CPI Data for Next Direction GOLD | Awaits CPI Data for Next Direction
Gold prices are set for a strong move ahead of the U.S. CPI release.
Key Levels
Pivot: 4,053
Resistance: 4,101 · 4,124 · 4,163
Support: 4,011 · 3,985 · 3,945
Trading Plan
🔼 Buy Setup: Longs valid above 4,053, targeting 4,101 / 4,124 / 4,163 — supported if CPI prints below 3.1%.
🔽 Sell Setup: Shorts valid below 4,053, targeting 4,011 / 3,985 / 3,945 — favored if CPI comes above expectations.
📌 Premium Takeaway
Gold is poised for a strong reaction to inflation data.
A softer CPI favors bullish continuation toward 4,124–4,163,
while a hotter CPI could trigger a bearish correction toward 4,011–3,945.

The bottom of gold price is still under construction
News:
On Thursday (October 23rd), gold prices regained safe-haven support after a recent pullback, primarily driven by escalating geopolitical tensions and expectations of new US export restrictions.
Risk aversion reignited, while investors awaited Friday's US CPI data to assess the Federal Reserve's policy path. After hitting a record high of $4,381.21, gold prices recently came under short-term pressure, entering a technical correction.
Gold prices found renewed support this week amid heightened geopolitical uncertainty and rising US policy risks.
Specifically:
Gold daily chart: Yesterday, the price stabilized at the middle line, closing with a long lower shadow candlestick. This suggests the 4000 low has temporarily stabilized. Whether it effectively serves as the bottom of a short-term correction will require further confirmation.
On the 4-hour chart, gold prices broke below the neckline of the double top pattern, strengthening bearish momentum. The neckline area (4225-4220) will now become new resistance, and bears may be positioned there with a stop-loss placed above resistance, aiming for a further break below the trendline.
Trading strategy:
Buy: 4190-4185, SL: 4205, TP: 4120-4090

GOLD → Correction after aggressive growthFX:XAUUSD is in a correction phase after a month and a half of aggressive growth. The price is forming a trading range and continues to storm support...
The record growth was overheated, and traders are closing long positions. A gradual change in the fundamental background and market sentiment is also provoking an outflow of funds. However, US-China negotiations, the ongoing US shutdown, and the tense geopolitical situation, including the cancellation of Trump's meeting with Putin, create additional risks in the economy, which may support the metal.
The correction in gold looks like a healthy pause. The $4,000 level remains key support. A recovery above $4100 indicates continued buyer interest, but further dynamics depend on news about trade negotiations.
Resistance levels: 4082, 4107, 4163
Support levels: 4059, 4000
A breakdown of the trading range support could trigger further sell-offs. Focus on 4000K, aggressive reaction possible. At the moment, the market is falling as aggressively as it rose. We need to wait for the price to slow down in order to make reasonable technical decisions.
Best regards, R. Linda!

XAUUSD 1H Analysis(27th October 2025) ASIA/LondonBUY/SELL SCENARIOS:
BUYS:
1) Body candle close above 4096.72 level.
2) Retest the failed 1H Bearish FVG at 4096.72
3) Create a 3/5m Bullish Engulfing Candle to capitalize on BUYS.
SELLS:
1) Retest the 1H Bearish FVG at the 4088.59
2) Create 1 3/5m Bearish CHOCH with a body candle close (with a FVG)
3) Retest the 3/5m Bearish CHOCH Level to capitalize on SELLS towards the 4000 level.
Trade smart, Trade safe guys. Execute trades only with these confirmations!!

Gold expectation 1HLast wek price originally was suppose to be bearish till support, but buyers stepped in. Now we could be seeing a course correction back to the sam support.

GOLD | Pullback Resistance AheadBased on the H4 chart analysis, we could see the price rise to the sell entry, which is a pullback resistance that aligns with the 161.8% Fibonacci extension and the 50% Fibonacci retracement, and could reverse from this level to the downside.
Stop loss is at 4,370.70, which is a multi-swing high resistance.
Take profit is at 3,946.74, which is a pullback support that is slightly above the 61.8% Fibonacci retracement.
Stratos Markets Limited (tradu.com ):
CFDs are complex instruments and come with a high risk of losing money rapidly due to leverage. 68% of retail investor accounts lose money when trading CFDs with this provider. You should consider whether you understand how CFDs work and whether you can afford to take the high risk of losing your money.
Stratos Europe Ltd (tradu.com ):
CFDs are complex instruments and come with a high risk of losing money rapidly due to leverage. 70% of retail investor accounts lose money when trading CFDs with this provider. You should consider whether you understand how CFDs work and whether you can afford to take the high risk of losing your money.

GOLD Strong Bullish Bias! Buy!
Hello,Traders!
GOLD has made a strong correction last week but found a liquidity pool at the lower levels, and we are seeing a local accumulation phase. Then a bullish breakout is likely with the price moving towards the higher liquidity levels again following a strong uptrend!
Buy!
Comment and subscribe to help us grow!
Check out other forecasts below too!
Disclosure: I am part of Trade Nation's Influencer program and receive a monthly fee for using their TradingView charts in my analysis.

XAU/USD Technical Setup ‖ Bullish Momentum or Smart Trap?🏆 XAU/USD: The Golden Heist Blueprint | Swing & Scalp Strategy 💰
📊 Market Overview
Asset: XAU/USD (Gold vs U.S. Dollar)
Market: Precious Metals
Strategy Type: Dual Setup - Swing Trading (Bullish) & Day Trading/Scalping (Bearish)
Risk Level: High Volatility Zone ⚠️
🎯 The Master Plan
🚀 Bullish Scenario: "To The Moon" Setup
Breakout Level: $4,400.00
Action: Direct long entry on confirmed breakout above resistance
Logic: Clean break = institutional momentum shift
🔻 Bearish Scenario: Scalping/Day Trade Setup
Breakdown Level: $4,050.00
Action: Short positions on confirmed break below support
⚠️ Trap Alert: Any pullback above $4,050.00 post-breakdown = potential smart money trap. Watch for false breakouts!
🛡️ Risk Management Zone
Stop Loss (Pullback Buy Plan): $3,950.00
⚠️ Disclaimer: This SL is based on my analysis for the bullish pullback scenario. You're the captain of your own ship! Adjust stops according to your risk tolerance, account size, and trading style. Never risk more than you can afford to lose.
🎖️ Profit Targets
Buy Side Target: $4,600.00
Exit Strategy Notes:
Strong resistance confluence at this level
Overbought conditions likely
Potential trap zone for late entries
Recommendation: Scale out profits gradually rather than waiting for the full target
Sell Side Target: $4,050.00
Exit Strategy Notes:
Major support level - expect bounces
High probability of liquidity grab at this zone
Consider partial profit taking before reaching full target
Recommendation: Trail stops as price moves in your favor
⚠️ Disclaimer: These targets are MY analysis, not financial advice. Take profits when YOUR strategy signals, not mine. Trail stops, scale out, or exit based on YOUR plan. Your money, your rules! 💪
🔗 Related Markets to Watch
Correlated Assets:
DXY (U.S. Dollar Index): Inverse correlation - Dollar strength = Gold weakness
GC (Gold Futures): Direct correlation - Institutional positioning indicator
XAUEUR (Gold vs Euro): Alternative safe-haven flow gauge
US10Y (10-Year Treasury Yield): Inverse correlation - Rising yields pressure Gold
BTCUSD (Bitcoin): Risk-on/risk-off sentiment indicator
Key Fundamental Drivers:
Fed monetary policy & interest rate decisions
Inflation data (CPI/PCE reports)
Geopolitical tensions (safe-haven demand)
Real yields & opportunity cost
🔑 Key Technical Points
✅ Breakout Confirmation: Wait for candle close above/below key levels
✅ Volume Analysis: High volume breakouts = higher probability
✅ Smart Money Traps: Watch for failed breakouts and liquidity grabs
✅ Risk-Reward Ratio: Calculate before entry - minimum 1:2 recommended
✅ Market Structure: Respect higher timeframe trends
🎭 Trading Psychology Reminder
This strategy has a playful "heist" theme for entertainment, but make no mistake — treat your capital with serious respect. The market doesn't care about our plans. Adapt, manage risk, and preserve capital above all else.
Remember:
No setup is guaranteed
Always use stop losses
Never risk your rent money
Emotions are the enemy
The market pays patient traders
✨ If you find value in my analysis, a 👍 and 🚀 boost is much appreciated — it helps me share more setups with the community!
#XAUUSD #Gold #GoldTrading #ForexTrading #SwingTrading #DayTrading #Scalping #TechnicalAnalysis #PreciousMetals #TradingStrategy #RiskManagement #Forex #GoldAnalysis #TradingIdeas #MarketAnalysis #PriceAction #Breakout #SupportAndResistance #TradingView #ForexSignals
Happy trading, and may the pips be ever in your favor! 🎯💎

XAUUSDGold chart illustrates a period of consolidation following a sharp decline from recent highs. After breaking below the ascending channel, price action is fluctuating within a key support-resistance zone around the 4,100–4,150 range. The chart highlights two potential scenarios:
"Thank you for your support! If you found this idea valuable or learned something new, please consider liking and leaving a comment. I’d really appreciate hearing your feedback and thoughts."

Gold Trade Plan 26/10/2025Dear Traders,
ased on Trump's initial comments regarding a trade war agreement with China, we will likely see selling pressure at resistance levels. The first area where the price is likely to react well is the 4200–4220 range. Considering the high liquidation above this level, I expect a 300–500 pip drop in the first reaction to this range. Also, the FOMC meeting on Wednesday is very important.
Regards,
Aireza!

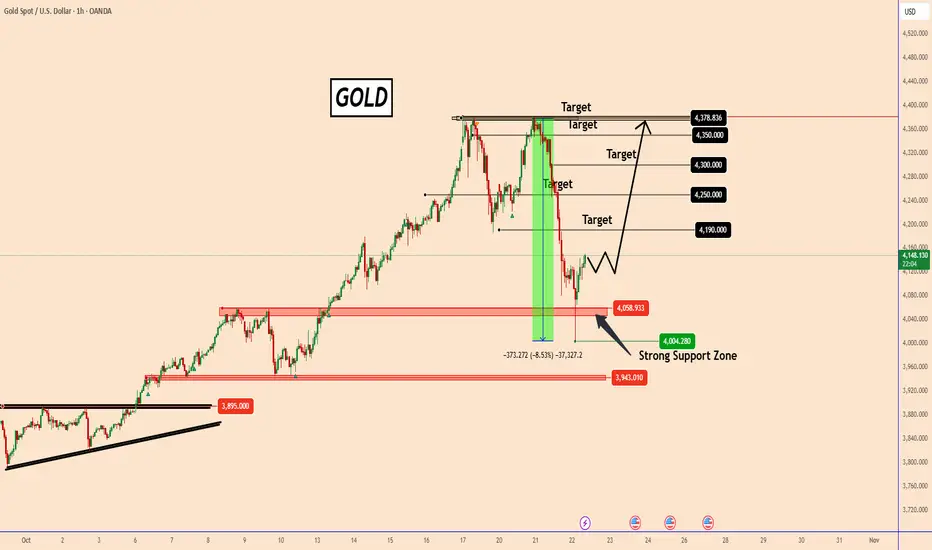
Gold Pulls Back on Profit-Taking, Bulls Defend the $4000 LevelGold Pulls Back on Profit-Taking, Bulls Defend the $4000 Level
Yesterday, gold faced a quick sell-off, likely triggered by the profit-taking of large institutions (manipulators), and corrected by almost 8.6%.
Considering that this move was created without news, it is a clear sign of manipulation. We cannot consider overbought conditions, as they have been in this state for 2 years.
The lower low was created near 4000, where the price found the bulls well-positioned near that psychological price zone.
Gold remains bullish and could rise again as shown in the chart.
It will break the 4000 level only if a larger manipulation unfolds again today or during the next week.
The price should rise again with targets at 4190; 4250; 4300 and 4350.
You may find more details in the chart!
Thank you and Good Luck!
❤️PS: Please support with a like or comment if you find this analysis useful for your trading day❤️
XAUUSD is going downGold (XAUUSD) is showing signs of potential downside continuation after a sharp rejection from recent highs. The daily candle formed a long upper wick and closed below the midline of the green band — indicating profit-taking and emerging selling pressure.
Bearish Influences
Rejection Candle: Strong upper wick signals sellers defending resistance near the 4,180–4,200 zone.
Loss of Momentum: Price slipped below the short-term support band, suggesting weakening bullish control.
EMA / Structure Confluence: The current pullback aligns with the lower trendline slope and prior breakout structure — a likely retracement phase forming.
🎯 Fibonacci Bearish Targets
If price fails to reclaim the 4,180 level and bearish momentum persists, look for these downside targets:
Target 1 (0.382 Fib) → $4,047 – $4,050
Minor support and initial retracement level.
Target 2 (0.618 Fib) → $3,943 – $3,950
Key Fibonacci confluence and previous structure support zone.
Target 3 (1.000 Fib) → $3,814 – $3,820
Full retracement target aligning with the lower green volatility band — potential swing low zone.

XAUUSD Likely ScenarioGold is Bullish long term though due to double top it is bearish in short term. hence likely to get rejected at 4200 and drop upto 3950$ per troy once.
Gold need to create a strong consolidation base at 3950 to further go up. Presently it is likely to get rejected at 4200$

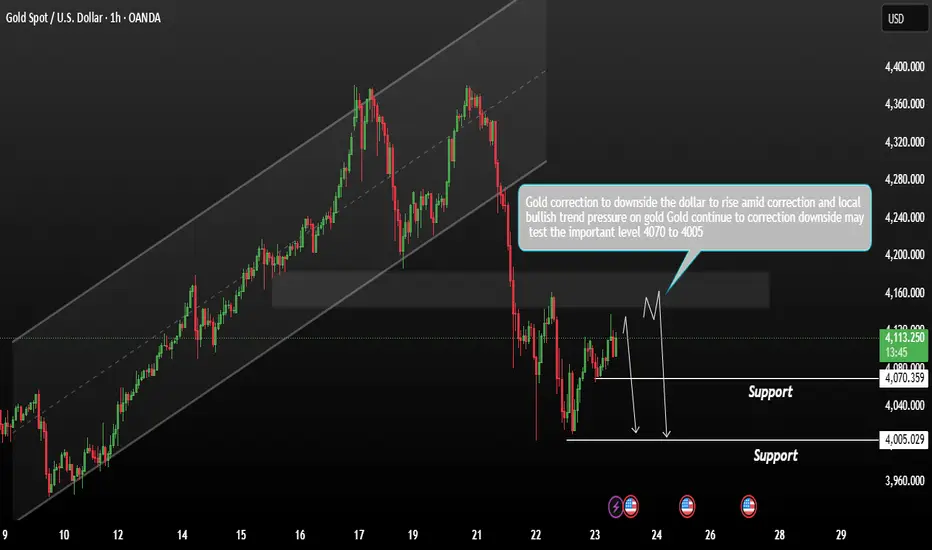
Gold forming a consolidation range What should Next?Gold prices continue to correct to the downside, forming a consolidation range near current levels. The market remains supported, but momentum is weakening as the US Dollar strengthens amid a local bullish trend.
As long as the dollar maintains its upward correction, downside pressure on gold is likely to persist. a break below the trading range support could trigger further declines toward the 4,070 4,005 zone (support area). This level may act as a potential retest zone for buyers. For now, it’s best to wait for price action to slow down near the lower boundary of the range before considering new trades — patience and confirmation are key to avoid false breaks.
You may find more datils in the chart,
Trade wisely best of Luck Buddies.
Ps; Support with like and comments for better analysis Thanks for Supporitng.
If $GOLD is at its peak, is $BTC next?Gold has been rejected at the 0.618 level of the Fibonacci channel on the 3M chart.
The Stoch RSI demonstrates a striking similarity to past cycles:
The bullish structure, which continued in the overbought region in October 2010, peaked 273 days later in July 2011.
Momentum, which continued in the overbought region again in October 2019, reached its peak 365 days later in October 2020.
Today, history paints a similar picture once again.
The bullish structure, which began in the overbought region in October 2024, may have reached its peak approximately one year later, in October 2025, just as in previous cycles.
Gold appears to be completing its historical rhythm once again.
Note: The Bitcoin / Gold pair is developing in the opposite direction.

XAU/USD – Triangle Breakdown Potential Toward 3,900 ZoneGold (XAU/USD) has been in a strong uptrend for the past few months, recently reaching new highs above US $4,300 before showing signs of slowing down. In your chart, the price has formed a triangle pattern (labelled A–B–C–D) after a sharp drop from the peak. This pattern usually means the market is taking a pause and preparing for the next move — either a breakout up or down. Based on the structure, momentum, and recent price behavior, the pattern looks more likely to break downward, which could send the price toward the support zone around US $3,900–3,950 (the blue area on your chart).
From a technical view, this makes sense because:
The strong rally lost strength after the sharp fall from the top.
The triangle is getting tighter, meaning volatility is compressing before a breakout.
Indicators like the RSI and Awesome Oscillator (AO) are showing bearish divergence, signaling weaker buying pressure.
If price breaks below US $4,100–4,050, it would confirm a bearish breakout and likely trigger a move to the support area marked in blue.
From a fundamental view, gold recently rallied due to expectations of Federal Reserve rate cuts, high inflation, and strong central bank demand. But in late October 2025, the market is cooling because the U.S. dollar has strengthened slightly and Treasury yields have bounced, causing short-term selling pressure on gold. Many traders are also taking profits after such a strong run.
Putting both sides together, the technical chart and the current fundamentals support a short-term bearish correction — a pullback that could test the US $3,900 zone before the next big move. However, if the price fails to break below the triangle and instead closes above US $4,180–4,250, it would cancel the bearish setup and signal a possible continuation of the uptrend toward new highs above US $4,350–4,400.
In short:
Bias: Short-term bearish correction
Breakdown trigger: Below US $4,050–4,100
Target zone: Around US $3,900
Invalidation: Above US $4,250

XAU/USD: Bullish Rally to 4225?OANDA:XAUUSD is priming for a bullish rally on the 1-hour chart , with price pulling back to a critical support zone after a sharp decline, forming a potential reversal point as buyers defend against further downside amid overall uptrend signals. This setup highlights a classic dip-buy opportunity near the confluence of support and recent lows.
Entry zone between 4007-4037 for a long position. Target at 4225 near the resistance zone for attractive upside potential. 📊 Set a stop loss on a close below 3991 to manage risk effectively. 🌟 Keep an eye on confirmation through a bullish engulfing pattern or increased volume pushing above the entry, leveraging gold's volatility in response to USD movements.
Fundamentally , today's US Initial Jobless Claims and Existing Home Sales data could introduce volatility to gold and the dollar—Jobless Claims are forecasted at around 233K, while Existing Home Sales are expected near 4.00M, potentially strengthening USD if figures beat expectations and pressuring gold prices. 💡
📝 Trade Plan:
✅ Entry Zone: $4,007 – $4,037 (buy zone near support)
❌ Stop Loss: Close below $3,991
🎯 Target: $4,225 (resistance zone / take-profit area)
💎 Risk-to-Reward: More than 1:4, offering a strong technical edge.
What's your outlook on this trade? Share below! 👇

4H weekly outlookKeeping it simple, expect a minor rise, hit FVG continue down, then a reversal from major support which should cover the news throughout the week. Personally I think we will see a 200 retest from the ATH if it makes it.

Gold Long PredictionArpad Nadassy gold long prediction
I predict a large pullback to the daily demand at around 3000 and that will be our perfect chance to go lond again.

XAUUSD - Signal#XAUUSD - Signal
H4 - Formation of the 3rd wave + breakout of the triangle line in continuation of the downtrend. Stop behind the high of the 2nd wave.
Entry: 4037.059
TP: 3973.036 - 3906.486 - 3845.833 - 3750.641
Stop: 4142.359

XAUUSD/GOLD SELL LIMIT PROJECTION 27.10.25Pattern Context
There’s a descending triangle or M-pattern that has been broken to the downside.
Labels such as “BREAKED M PATTERN NECKLINE HERE” and “BREAKED TRIANGLE PATTERN” indicate bearish structure.
Trade Setup
The chart projects a sell limit order in the region around 4,062–4,083 (highlighted red zone).
Stop loss is above the recent high — around 4,083.185.
Entry appears to be at the retest zone near 4,062.189 (“BREAKER ZONE RETEST & SELL”).
The target (take-profit area) points toward temporary support at approximately 4,031.150, suggesting a bearish continuation.
Trend Lines
A broken uptrend line and triangle breakout support the short bias.
The blue uptrend line and black triangle structure confirm the confluence zone where the retest and rejection may occur.
Summary of Bias
Direction: Bearish (Sell setup).
Confirmation: Triangle & M-pattern breakdown, retest expected.
Risk Management: Stop above 4,083; target near 4,031 (risk-reward ratio ≈ 1:2 depending on entry).
