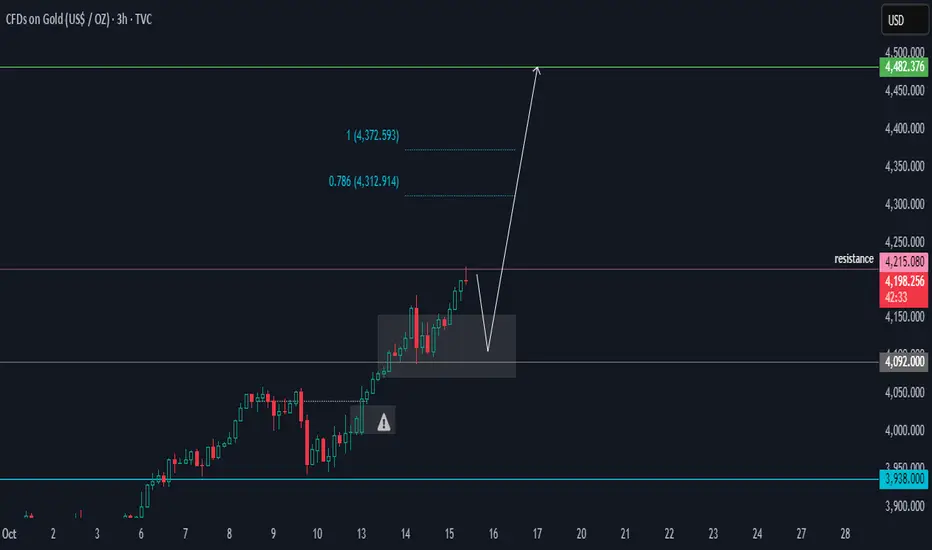
Gold Slowing but Aiming Higher.Hi
The price at 4215.080 is showing hesitation and acting as resistance. Gold may drop before rising again, with a target price of 4482.376. There are two price targets to watch. If the price falls deeper, it could reach 4039.060.
Happy Trading!
K.
_
Not trading advice
Trade ideas
Gold Buy Limit on SupportGold is about to test its support... Let's take a 1:1 Buy-Limit trade here.

XAUUSD - Signal#XAUUSD - Signal
H4 - Double top formation + potential rebound from the level. Stop loss beyond the local maximum. Reduce risks.
Entry: 4345.714
TP: 4283.916 - 4186.789 - 4066.133 - 3991.360
Stop: 4386.930

GOLD REBOUNDS AS INVESTORS BUY THE DIP AFTER ETF SELL-OFFGOLD | Prices Rebound Despite ETF Outflows 💰
Gold prices recovered after an earlier dip triggered by the largest single-day ETF outflow in five months, signaling profit-taking and a technical correction.
Despite investor caution, the metal maintains bullish momentum while trading above 4101, supported by safe-haven demand amid uncertainty ahead of U.S.–China trade talks.
Technically, as long as gold trades above 4101, upside targets remain 4124 → 4163 → 4189.
A clean 1H close below 4075 would shift momentum bearish, opening room toward 4053 and 4011.
Pivot Line: 4101
Resistance: 4124 – 4163 – 4190
Support: 4075 – 4053 – 4011

XAUUSD SELL IDEAPrice falls below the $4,000 level. It calls for possible short sell. I’m looking forward to selling XAUUSD from the current market price. Therefore a sell opportunity is envisaged.

Delivered 1:4 to the downside late NYSellers are still strong!
Potentially dropping further down to the 4900 level.
But retracement can be aggressive as the market is currently testing the previous Buyer zone.
Trade Safe!
Let's see how it will develop.
Great Scalp today.
@TeamWePrint

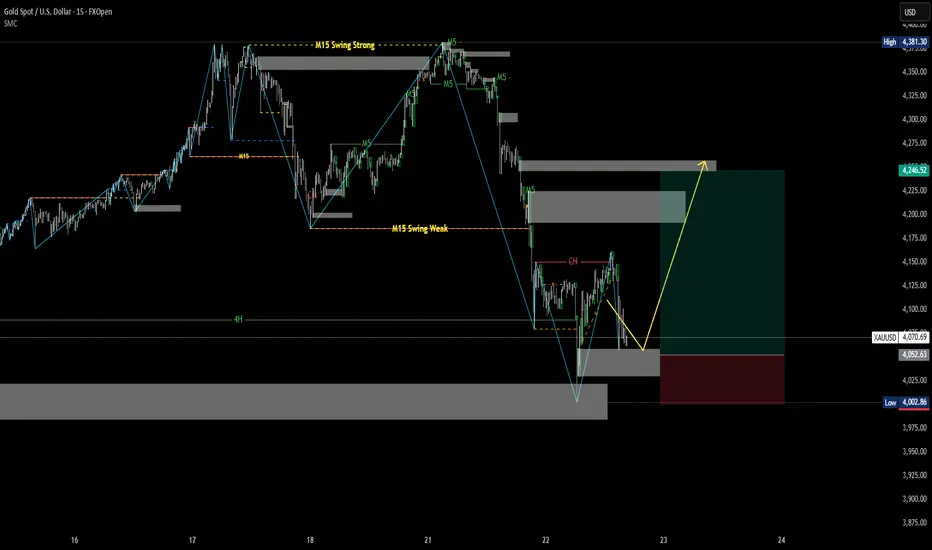
Structural analysis of XAUUSD on M5, M15 timeframesM15 swing is bearsh.
M5 swing is bullish.
We can buy according to the structure of M5
GOLD -SELL 3-monthly chart Reg. Channel GOLD is way overbought, and yes one can find reasons for the increase of value, but we should understand that the value is overdone. I feel strongly at a personal viewpoint, that a decline back towards $ 2,900 area is very possible.
Strategy SELL medium-term between $ 4,000-4,350 (or add even when short since $ 3,800 is fine). Take profit between $ 2,900-3,100.
also note I will be providing lesser updates, due to a lot of activities and managing funds, making it a little difficult to update regularly.

XAUUSD 1 HOUR TIMEFRAME CASESTUDY📅 23 Oct 2025 | 1H Chart | Yogiraj Trading Academy
After a strong reversal confirmation, Gold has perfectly respected the Inverse Head & Shoulders structure on the 1-hOUR chart.
As highlighted earlier, the key breakout zones of 4323 and 4380 acted as the decision points — once broken and sustained, the market confirmed trend continuation.
🔍 Technical Breakdown:
Timeframe: 1 hOUR
Pattern: Inverse Head & Shoulders
Breakout Zone: 4111–4150
Current Status: Breakout confirmed; retest expected
Next Target: 4173+ zone If breaked 4293
Stop-loss Zone: Below 4050 (structure invalidation) Use Stoploss And Trail Always
⚙️ Market Psychology:
This setup shows how markets transition from accumulation to expansion.
Traders who entered prematurely during consolidation faced whipsaws, while disciplined traders who waited for neckline breakout confirmation entered at optimal risk-reward points.
🧘 Lesson from This Case:
Confirmation > Prediction.
Patterns reflect emotions — fear at lows, greed near breakouts.
Structure-based entries build long-term consistency.
🚩 Yogiraj Trading Academy Insight:
At Yogiraj Trading Academy, we integrate Technical Analysis + Trading Psychology + Discipline to guide traders toward independence and emotional mastery.
Always trade with risk management, clarity, and patience — the real pillars of professional trading.
📊 Watchlist Levels:
Support: 4080 / 4050
Resistance: 4185 / 4283
Continuation likely if sustained above 4200
⚔️ Trade at your own risk with proper discipline and capital protection.
#YogirajTradingAcademy #XAUUSD #TechnicalAnalysis #MarketPsychology #HeadAndShoulders #TrendContinuation #TradingMindset

XAUUSD, Long trade. for intraday or small swing...It can be a good trade, but make sure you are following your risk-reward ratio

Gold Analysis and Trading Strategy | October 27✅ Last week, gold closed with a long upper shadow candle, indicating strong selling pressure at higher levels. Since rising from 3311 on August 20, the weekly chart has recorded nine consecutive bullish candles, with last week marking the first bearish close, suggesting that the long-term uptrend is weakening and market sentiment is turning more cautious. Structurally, the medium-term bullish momentum is fading, and if gold fails to stabilize, it may gradually enter a corrective phase.
✅ The Federal Reserve’s interest rate decision will be announced this Wednesday. If the outcome and statement do not trigger significant changes in policy expectations, market volatility may remain limited, and gold is likely to continue oscillating within the $4000–$4200 range. It is worth noting that rate-cut expectations have already been largely priced in; if the statement is hawkish, gold may come under short-term pressure, while a dovish tone or any geopolitical risk events could trigger a temporary rebound.
✅ 4-Hour Chart Analysis:
Gold continues to move within a downward channel, with short-term moving averages (MA5, MA10, MA20) aligned in a bearish formation. The price is trading near the lower Bollinger Band, indicating that bears remain dominant. If the price breaks below 4000, it could open up further downside potential.
✅ 1-Hour Chart Analysis:
Gold currently shows a “double-top + consolidation” structure, with lower lows continuously forming. After touching the lower Bollinger Band at 4015, the price rebounded slightly, suggesting a short-term technical correction, though the upside remains limited. The middle band near 4080 serves as a key level to gauge rebound strength. If the price fails to break above 4080–4100, the bearish trend is likely to continue.
🔴 Resistance Levels: 4075–4085 /4100-4115
🟢 Support Levels: 4010–4000 / 3950-3930
✅ Trading Strategy Reference:
🔰 If gold rebounds to 4075–4085 and faces resistance, consider light short positions, with a stop loss of 8–10 USD and targets at 4100–4050.
🔰 If gold pulls back to 4010–4000 and stabilizes, consider short-term long positions, with a stop loss below 3995 and targets at 4050–4075.
🔰 If gold breaks below 4000, the next downside targets are 3950–3930.
✅ After nine consecutive weeks of gains, the first bearish weekly candle indicates that bullish momentum is weakening. In the short term, the market remains in a sideways consolidation phase. Focus on the 4100 breakout zone and the 4000 support area. Before a clear breakout occurs, maintain a range-trading strategy — sell at highs and buy at lows, with strict risk management.

GOLD sellsSells idea for continuation bears if friday US CPI data comes in as expected or even higher. which could signical that inflation is still persistant so the FEd my be hesitant to continue any future rate cuts which can results in more capital investor inflows due to the higher returns offered by higher rates.

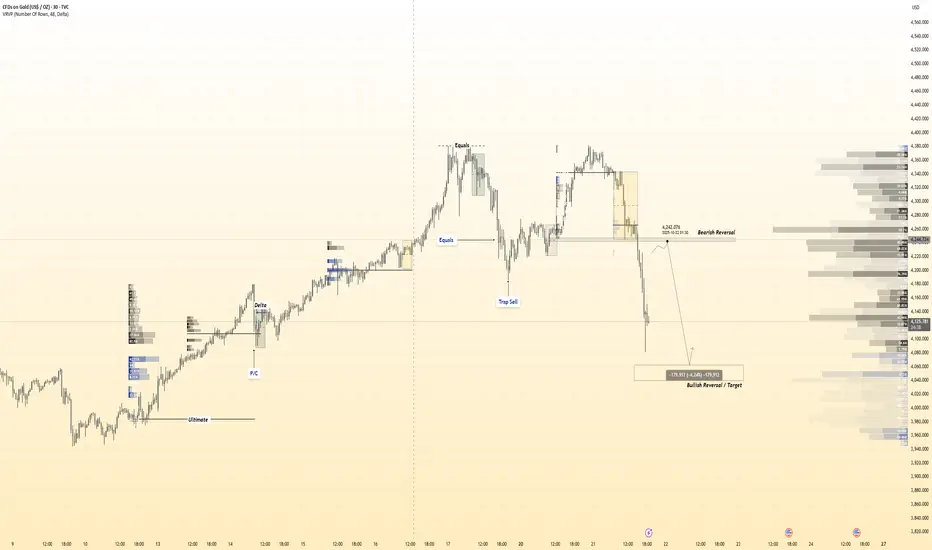
( HANZO Gold Protocol ) Bearish Reversal DetectedTime Frame: 30-Minute Warfare
Entry Protocol: Only after volume-verified breakout
🩸Bearish Reversal - 4240
🆚 Reasons To Enter The path
————
➕ Volume Engaged & Confirmed
➕ Time Zone Aligned (London / NY)
➕ Liquidity Cleared Below
➕ Cluster Shield Active
➕ Delta Shift Showing Buyer Control
➕ Reversal Formation Detected
➕ Price Below POC – Ready for Retrace
➕ Entry Prepared with Zero Emotion
short-term GOLD analysis🟡 Pattern Observed: Bullish Harmonic Formation (Potential Gartley/Deep Crab Variant)
The chart shows a completed harmonic reversal zone around point D, with a clear five-point structure (X-A-B-C-D).
This pattern indicates exhaustion of the prior down-leg and signals a potential bullish reversal in the short term.
📈 Bullish Projection
Immediate Reaction Zone: ₹ 4 020 – ₹ 4 030
Short-Term Upside Targets:
₹ 4 110 – ₹ 4 130 – initial profit-booking zone (previous minor swing).
₹ 4 170 – ₹ 4 190 – main harmonic target.
Extended Target (if momentum expands): ₹ 4 240 – ₹ 4 260.
Momentum oscillators are expected to turn upward from oversold regions once D is validated.
⚠️ Invalidation / Risk
Invalidation: A daily close below ₹ 4 000 (≈ below point X) negates the bullish setup.
Stop-loss Zone: ₹ 3 985 – ₹ 3 995 for traders.
Probability of Reversal: ≈ 70 % based on harmonic symmetry and candle positioning.
🧠 Summary
Parameter Observation
Pattern Type Bullish Harmonic (Gartley/Deep Crab)
Reversal Zone (PRZ) ₹ 4 000 – ₹ 4 030
Trend Expectation Short-term rebound
Targets ₹ 4 110 → ₹ 4 190 → ₹ 4 250
Stop-loss Below ₹ 4 000
Bias Bullish
Confidence ~70 %
📊 Conclusion
Gold appears to be completing a harmonic reversal zone near ₹ 4 000, signaling a short-term recovery phase.
A sustained bounce above ₹ 4 050 will confirm reversal strength, with potential for a ₹ 150–200 up-move.
Traders should stay long with tight risk management, watching for follow-through candles.
Disclaimer:
This analysis is for educational purposes only and does not constitute financial advice. Always use appropriate risk controls and confirm setups with your own system before trading.


Is gold about to experience a new rally?Is gold about to experience a new rally?
Currently, the gold market is experiencing significant volatility at high levels, and it's time to choose a direction, as shown in the chart.
After a series of sharp gains, there has been a significant technical pullback this week, but the core logic driving gold's long-term upward trend remains unchanged.
Policy expectations are in focus:
The market currently generally expects the Federal Reserve to cut interest rates by 25 basis points at next week's meeting.
This is the most important event currently hanging over the market, and any unexpected announcement could trigger significant market volatility.
Beware of volatility amplification: Due to unstable market sentiment and major events expected next week, gold price volatility has significantly increased.
Exchanges have also increased margin requirements for gold futures, which may force some leveraged traders to exit the market, further exacerbating market volatility.
As shown in Figure 4h:
Technical Analysis: Strong support exists in the $4,000-4,050 range. The pullback from the high has formed a bearish flag pattern, with significant resistance above.
Current Position: After plummeting from its all-time high of $4,379 to $4,010, gold is currently stabilizing above the key psychological level of $4,100.
Support and Resistance:
Key Support: $4,080, $4,030, and $4,000 are three key support levels.
If $4,000 falls below, the correction could intensify.
Key Resistance: Upside resistance lies near $4,170 and $4,220. A break above $4,220 could lead to a retest of $4,300.
Technical Pattern: Short-term consolidation.
The key trading strategy for Monday (October 28) is range-bound trading.
Key Trading Strategy:
Buy on dips: If gold can hold between $4,090 and $4,100 after Monday's opening, consider building a position in batches, with a short-term target of $4,150 to $4,170.
Short on rallies: If gold rebounds to resistance near $4170 or $4220 and shows signs of resistance, consider shorting with a small position, with a short-term target below $4100.
Risk Management Tips:
Stop-loss for long positions: It is recommended to set a stop-loss below $4080. If the price falls below $4080, be wary of the risk of a further decline to $4030.
Stop-loss for short positions: It is recommended to set a stop-loss above a key resistance level (such as $4220).
Important Tips:
Trade cautiously and maintain a small position: With the Federal Reserve's interest rate decision expected early next Thursday (October 31st), market uncertainty is extremely high.
It is recommended to reduce positions and avoid heavy holdings before mid-next week.
Avoid chasing highs and lows: In the current volatile market, chasing orders is extremely risky and can easily be wiped out by short-term fluctuations.
Always wait for the price to retreat to support or rebound to resistance before taking action.


Gold rebounds from lows – key levels to watch: 4100 & 40081. Market Overview
Gold (XAU/USD) recovered from an early drop to $4054, now trading around $4069–$4070 as technical buying emerges near support. The market is consolidating after last week’s decline, with short-term momentum turning neutral.
2. Technical Analysis
• Resistance 1: $4100 – short-term top with EMA50 (H4) confluence.
• Resistance 2: $4135 – strong medium-term barrier.
• Support 1: $4045 – key intraday base.
• Support 2: $4008 – major medium-term floor.
• EMA20 (H1): $4078 acting as dynamic resistance.
• RSI (H1): recovering to 50 → neutral zone.
The overall structure remains slightly bearish, but candles show buyers defending the $4050 area effectively.
3.Outlook
Gold is in a technical recovery within a broader downtrend. A confirmed breakout above $4085–$4100 could target $4118–$4135.
Failure to hold above $4045 may reopen a path toward $4022–$4008.
4.Trading Plan
🔻 SELL XAU/USD : $4102–$4105
🎯 TP: 40 / 80 / 200 pips
🛑 SL: $4109
🔺 BUY XAU/USD: $4045–$4048
🎯 TP: 40 / 80 / 200 pips
🛑 SL: $4041

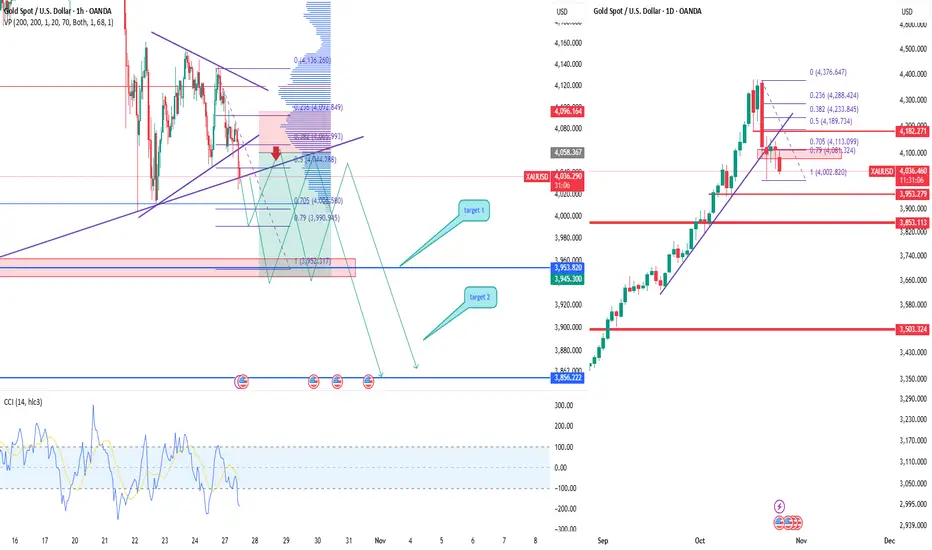
XAUUSD Gold testing support, correction possibleAfter a strong rally, gold entered a correction phase. Price broke the ascending channel and now trades around 4030–4050. The chart structure suggests a potential retest near 4070–4090 before continuation to 3960 (Target 1) and 3856 (Target 2).
CCI confirms weak buying momentum and volume profile shows high liquidity zones above current price — favoring a pullback.
Investors are taking profits after gold’s rally amid softer Fed outlook and possible dollar rebound. While long-term fundamentals stay bullish, short-term correction looks likely.
Sell setup from 4070–4090 zone with targets 3960 and 3856, stop 4110.
Valid while price remains below 4110.
Gold the safe haven Good morning fams, Gold is showing some sign of not going down further in the triangle respecting the trend line hopeful if it doesn't break and stay below 4055 we may see more bullish movements back to 4158 - 4160 but if it breaks 3954 is the next target... let keep observing as will sit on our and wait patiently ( Remember the market takes from the inpatient and give to the patient.)

XAUUSD BUY WITH LIMIT ORDER!!!XAUUSD is still super bullish i want to see price create an inducement order for a buy opportunity at 4,065 which will stand as my limit order
LETS SEE YOUR THOUGHTS ON THIS.....

Gold is still in a downward channel
News:
On Wednesday (October 22nd), spot gold trading saw increased volatility, trading above $4,000 before the US market opened. Previously, the price of gold retreated rapidly from its stage high: it once reached $4,161 in the European session and then came under pressure again; in sharp contrast to the previous stage peak of $4,380, the retreat was significant, and the market became increasingly sensitive to the offensive and defensive switches of the "four thousand mark".
Overall, the market is in a data vacuum. Affected by the government shutdown, the economic schedule on Wednesday was empty, with only a small number of Treasury auctions and repurchase operations supporting liquidity. However, global macro events have quietly amplified the cross-market linkage effect.
Specifically:
Judging from the 4-hour market trend, the current focus is on the short-term suppression of 4090-4080 on the top, and the short-term support of 4000 on the bottom. If the bulls cannot break through, gold will continue to maintain a downward trend. The operation should be mainly high-altitude, and wait patiently for key points to enter the market. I will remind you of the specific operation strategy in the channel, so please pay attention to it in time.
Trading strategy:
Buy: 4090-4080, SL: 4105, TP: 3990-3965

Gold final bull/bear battle level 4340 +/-. 21/Oct/25XAUUSD possible having triple top with strong seller taking control over bull near 4340 +/-..
