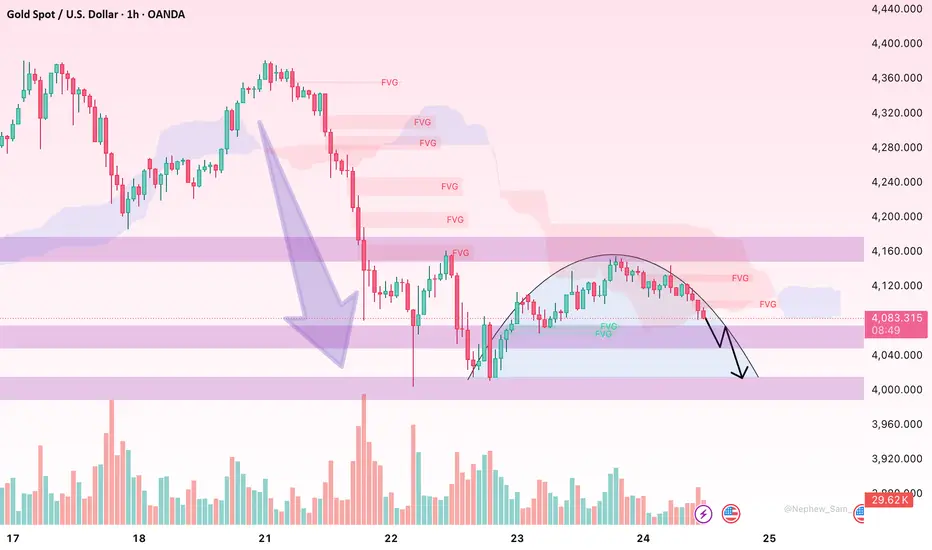
Technical Correction – Bullish Structure Remains IntactHello everyone, after a strong rally to new highs, gold (XAU/USD) is entering a necessary corrective phase before deciding its next direction. On the H1 timeframe, price is temporarily consolidating around $4,090 – a key support area where buyers are beginning to show signs of defence.
From a technical perspective, the overall bullish structure remains intact as price continues to form liquidity zones followed by FVG fills. The $4,090–$4,080 zone still acts as the short-term defensive line for buyers. If this area holds, gold may rebound to retest $4,120–$4,130 – a region where selling pressure previously intensified. Ichimoku Cloud remains below price and has yet to signal a bearish reversal, indicating that this move is still a correction rather than distribution.
On the news side, gold continues to receive medium-term support from expectations of a Fed rate cut in December, a cooling US dollar, declining bond yields and lingering geopolitical risks. While US–China trade dialogue may offer temporary signs of easing tension, institutional capital still favours defensive positioning, keeping gold within its broader uptrend.
In the short term, I prioritise the scenario of gold extending its correction to gather liquidity around $4,080–$4,090 before potentially resuming its upside. Only a decisive break below this zone with strong bearish momentum would expose the psychological level at $4,000.
What do you think about gold’s current trend – is this just a healthy pullback or an early warning of a deeper decline?
Trade ideas
SELL ASSET GOLD {XAUUSD}🔴 SELL SIGNAL ACTIVE — XAUUSD (GOLD)
Bears are stepping in as price shows signs of exhaustion at key resistance levels.
This setup marks a high-probability short-term downside opportunity, ideal for traders who look to capitalize on momentum reversals and clean structural shifts.
✳️ Market Snapshot
Structure Shift: Price forms a lower high, signaling potential weakness ahead.
Momentum Turn: Sellers are reclaiming control after a failed bullish push.
Entry Zone: A defined area where downside acceleration is likely to begin.
Risk Control: Stop-loss levels remain tight (around 40–50 pips) to safeguard capital.
💰 Trading Outlook
Consider short positions near the highlighted resistance or confirmation candle.
Targets: Short-term take-profits at recent support or liquidity sweep zones.
Tip: Keep position sizing aligned with your risk plan — focus on accuracy, not aggression.
⚠️ Trader’s Note
This signal is intended for short-term momentum trading. Always apply your own analysis, follow strict risk management, and treat this as a trade idea, not financial advice.

XAUUSD Update - Bullish Scenario to reach 4500 levelIf next week, 3997 support still holding, so a bullish continuation may appears.
If market will make a bullish continuation, the target is fibo extention zone at 4500-4600 zone.
Stay carefully as price still consolidation at 4161 - 4005 zone ( Triangle pattern ) .
Waiting for a confirmation is more wiser.
Have a blessing week ahead !
* This scenario could be cancelled if selling pressure continues and the price makes a deeper correction.

Gold analysis with trading ideasAfter nine consecutive weeks of strong gains, gold has entered a sharp correction phase. Driven by intense selling pressure, its nearly three-month winning streak has officially come to an end. However, given the persistently high levels of global geopolitical and economic uncertainty, the likelihood of a significant further decline in gold prices remains low, as safe-haven trading activity remains robust and dynamic. Currently, trade negotiations between the U.S. and China are still ongoing, while President Trump has announced the termination of all trade talks with Canada. Meanwhile, due to the U.S. Congress’ prolonged failure to pass an appropriations bill, the release of economic data continues to be disrupted, shifting traders’ focus back to central bank policies once again.
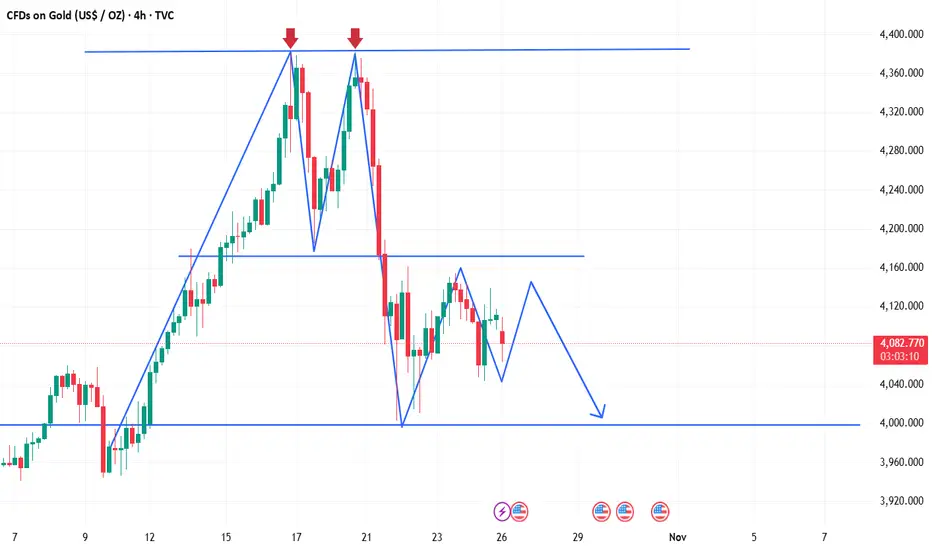
From a technical perspective, following the formation of a "double top" pattern on the 1-hour chart, gold has been oscillating under the resistance of the pattern’s neckline. Despite the bullish CPI data last Friday, gold bulls failed to push prices above the 4,160 level, indicating that short-term bullish momentum is still under significant pressure and gold is likely to remain in a wide-range consolidation. Looking at the 4-hour chart, after prices fell from the "double top" pattern, they rebounded with support from the acceleration line: the lower boundary of the range was reclaimed last Thursday, followed by a second bottoming-out and rebound on Friday—signaling that the short-term support at the lower boundary has been basically confirmed.
The key range currently lies between 4,060 and 4,170, and these two levels can be regarded as the dividing lines for short-term bullish and bearish trends. A break above 4,170 would suggest strengthened rebound momentum, potentially leading to a further test of the upper channel edge around the 4,300 area. Conversely, a break below 4,060 may trigger a continued decline toward the 4,000 support level—this forms the core framework for the current market movement.
Today’s trading strategy will revolve around the 4,000–4,170 range, prioritizing short positions at higher levels and long positions at lower levels. If prices break above 4,170, it will indicate that gold bulls have regained control, requiring a timely strategy adjustment to enter long positions on pullbacks.
Gold Price in Free Fall👋Hello everyone, let’s take a look at OANDA:XAUUSD and see what’s happening!
At the time of writing, the precious metal continues to move within a downward wave. At one point, gold dropped close to the $4,000 mark, down more than $350 compared to the same time in the previous session — a decline of nearly 5%.
This marks the sharpest drop after nine consecutive weeks of gains. The main reasons behind this move are the strengthening U.S. dollar, profit-taking pressure, and diminishing caution as U.S.–China trade tensions show signs of easing.
In addition, optimism over the potential reopening of the U.S. government, reduced political uncertainty, and improving trade sentiment have lessened investors’ urgent demand for safe-haven assets like gold.
From a technical perspective: Gold had previously fallen after forming a double-top pattern, breaking through several key support levels. It is now reacting around $4,100, gaining temporary momentum from the $4,000 support zone.
In the short term, I expect a minor rebound before the downtrend may resume, but from a medium to long-term view, I remain optimistic, supported by expectations that the Fed will soon ease monetary policy, Trump’s tariff measures, and continued gold buying by central banks.
What about you — how do you see gold’s next move today? 💬Share your thoughts in the comments below.
Good luck and happy trading!

Oct 27, 2025📢 Quick Update
Taking a rest today — it’s been a busy weekend and I need to prepare for my Monday interview.
Strategy and insights will be updated as usual on Tuesday. Thanks for your understanding and support!

XAUUSD Bearish OutlookGold has faced strong selling pressure near the all-time high just below the $4,400 psychological level. Key support sits around $4,050–$4,000, and a break below could trigger a sharper correction toward $3,500.
On the macro side, potential progress in U.S.–China trade talks and resolution of the U.S. government shutdown could boost market optimism and reduce safe-haven demand for gold. Meanwhile, markets remain heavily positioned for FOMC rate cuts — any disappointment or less-dovish tone from the Fed could unwind those bets, adding further downside pressure.

XAU/USD | Gold Under Pressure, Support & Resistance to WatchGold continues to trade under pressure, holding below both the MA50 and MA200, keeping short-term momentum firmly tilted to the downside. Price is currently hovering just below the 4,095 support level, with the market remaining range-bound within a broader corrective structure.
Buyers will need a confirmed break above 4,137 to trigger a potential recovery toward 4,178 and 4,234.
On the downside, the 4,042–3,987 Support Zone serves as an intermediate area to monitor for short-term reactions. A failure to hold this zone could extend the decline toward the Deeper Support Zone, which remains a major reaction area where dip-buyers are expected to re-enter the market.
📌 Key levels to watch:
Resistance:
4095
4136
4178
4234
4285
Support:
4042
3987
3944
🔎 Fundamental focus:
Gold remains under pressure as traders weigh ongoing U.S. government shutdown risks and delayed economic data, which have limited visibility into the real state of the economy.
While short-term price action remains corrective, safe-haven demand and macro uncertainty are still expected to support gold on deeper dips toward key demand zones.

GOLD TRAPPED ORDERFLOW OB DAILY TIME FRAME-NEUTRAL BIASMONTHLY-respect candle/rejection candle
WEEKLY-Bullish orderflow
DAILY-trapped orderflow
NB.Wait for one side of the PD-array to be disrespected
NO clear context
H1-LTF entry model
APPLY RISK MANAGEMENT

Gold XAUUSD Macro map for 27 to 31 Oct 2025Macro map for 27 to 31 Oct 2025
Concentration of policy and inflation prints means policy expectations and real yields will drive the United States dollar, global equities, bitcoin, and gold. The hinge events are Wednesday FOMC, Thursday US GDP advance and German data, Friday US Core PCE and Chicago PMI. Secondary drivers are BoJ policy guidance and ECB tone, plus BoC.
Watch list
Real ten year yield and the DXY dollar index after FOMC and PCE
EUR front end versus USD front end after ECB and FOMC
VIX around the FOMC window and into PCE
US liquidity windows around 14:00 Eastern on Wednesday and 08:30 Eastern on Thursday and Friday
Gold outlook for next week
Set up
Gold trades the sign and size of moves in real yields and the dollar. Policy guidance and inflation prints are therefore the core drivers. A patient or cautious Fed, softer Core PCE, and any rise in macro uncertainty support gold through lower real yields and safe haven demand. A hawkish tilt and firmer PCE pressure it by lifting the opportunity cost of holding a non yielding asset.
Baseline view
The tape prefers a slow glide toward price stability without a growth accident. That backdrop keeps real yields contained or drifting lower and supports gold on dips. The opposite mix lifts real yields and weighs on the metal. Flows often scale in after the first spike around FOMC and PCE once spreads and liquidity stabilize.
Scenarios and probabilities
Upside continuation or breakout. Probability forty. Triggers are a patient FOMC and cooler PCE that push real yields down. A softer dollar would reinforce the move.
Balanced consolidation inside the recent weekly band. Probability thirty. Triggers are mixed signals across events and no major shift in real yields.
Pullback to prior support. Probability thirty. Triggers are firmer PCE or hawkish communication that lifts real yields. Dollar strength would confirm.
Key confirms and risks
Track the ten year real yield and the DXY. If real yields fall while the dollar is flat the setup still favors gold. If both rise, risk control becomes priority. Liquidity can thin quickly in the first minutes after data and during press events. Use predefined risk units and avoid adding into fast markets.

Gold Technical Analysis Gold Technical analysis
###🔍 **Overall Chart Context**
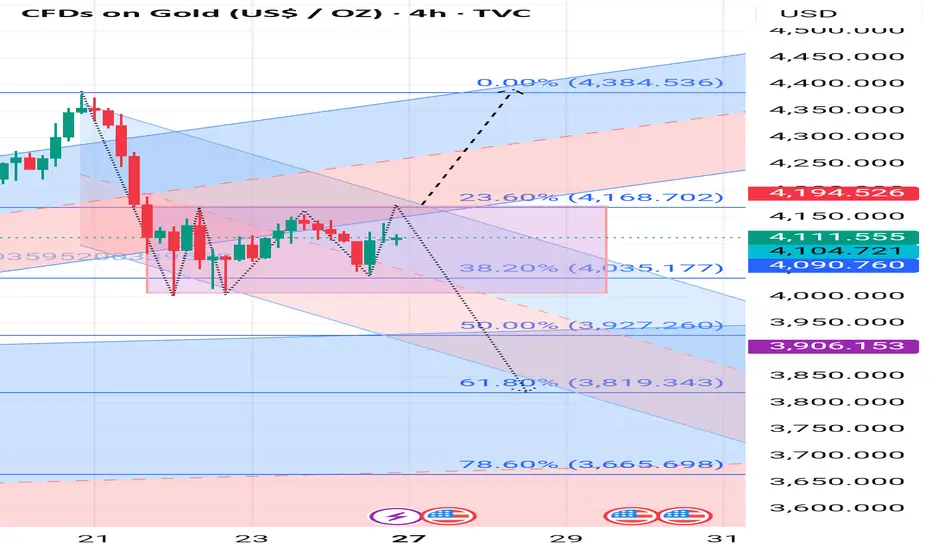
* The chart shows a **downward correction** after a recent swing high near **$4,384.536**.
* The current price is around **$4,111.55 USD/oz**, moving sideways within a **rectangular consolidation zone** (highlighted in pink).
* The **Fibonacci retracement tool** is drawn from the recent swing low to the swing high, showing potential retracement levels where price might react.
---
### 📉 **Fibonacci Levels and Key Zones**
| Fibonacci Level | Price Zone (USD) | Technical Meaning |
| --------------- | ---------------- | ------------------------------------------- |
| 23.6% | 4,168.702 | First minor resistance in a corrective move |
| 38.2% | 4,035.177 | Short-term support; currently being tested |
| 50.0% | 3,927.260 | Intermediate support (often key pivot) |
| 61.8% | 3,819.343 | Strong golden-ratio support zone |
| 78.6% | 3,665.698 | Deep retracement; could trigger reversal |
---
### 🧭 **Key Support and Resistance Levels**
**Resistance Levels:**
1. **$4,168 – $4,195** → 23.6% Fibonacci + upper channel zone; major resistance area.
2. **$4,384** → Recent swing high and strong structural resistance.
**Support Levels:**
1. **$4,035 – $4,090** → Current range bottom; 38.2% Fibonacci level.
2. **$3,927** → 50% retracement and midpoint of the trend channel.
3. **$3,819** → 61.8% Fibonacci (golden zone) — strong potential rebound area.
4. **$3,665** → Final major support; if broken, trend may turn fully bearish.
---
### 📊 **Current Price Action**
* Gold is **consolidating sideways** within a rectangular box between **$4,035 – $4,168**, showing **indecision** before the next major move.
* The candles indicate **buying pressure near the bottom** and **selling pressure near the top** of the box.
* The trend channel (red and blue parallel zones) indicates **bearish momentum dominance** in the short term.
---
### 🔮 **Forecast (Next Move Outlook)**
**📈 Bullish Scenario:**
* If price **breaks above $4,170 – $4,195** with strong volume, next targets:
* **$4,250**, then **$4,384** (previous swing high).
* Momentum would shift toward a recovery rally.
**📉 Bearish Scenario:**
* If price **breaks below $4,035**, expect:
* First drop toward **$3,927 (50% Fib)**, then **$3,819 (61.8%)**.
* A sustained move below **$3,819** may confirm a **bearish continuation** targeting **$3,665**.
**🎯 Neutral / Range-Bound:**
* Until a clear breakout occurs, Gold may **oscillate between $4,035 and $4,170**, forming a **consolidation base** before the next directional move.
---
### 🧠 **Summary**
| Trend | Status |
| -------------- | -------------------------------------------------------------------------------------------------- |
| Short-Term | Sideways / Consolidating |
| Medium-Term | Bearish bias below $4,170 |
| Key Support | $4,035 / $3,927 / $3,819 |
| Key Resistance | $4,168 / $4,195 / $4,384 |
| Forecast | Possible drop toward $3,927–$3,819 if $4,035 breaks; bullish breakout above $4,195 targets $4,384+ |
---

Technical Analysis – Rising Wedge Breakdown ProbabilityAnalysis
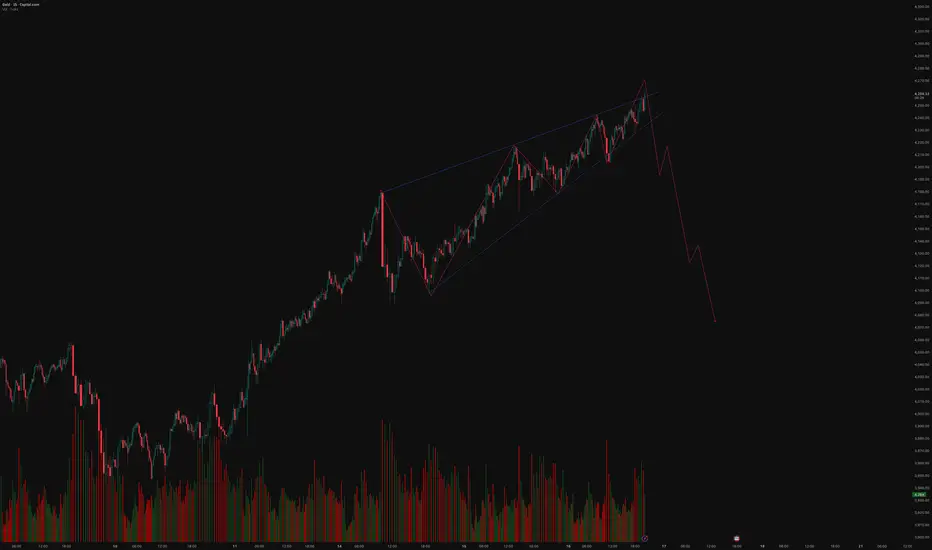
Pattern: A rising wedge has formed with converging trendlines — higher highs and higher lows narrowing into the apex.
Volume: Noticeable volume contraction during the formation, which often precedes a breakdown.
Current Position: Price appears to have made an upward breakout attempt, which may turn out to be a false breakout, a common precursor to a sharp downside move.
Projection: Once the lower trendline breaks decisively, a fast and impulsive decline toward lower support zones is probable — as shown by the projected path in red.
Summary
The structure suggests bearish momentum building up beneath the surface, with the recent false breakout likely to trap late buyers.
If confirmed with a close below the wedge support, this pattern could trigger a strong downside wave, potentially retracing the entire wedge formation.
Disclaimer
This analysis is for educational and technical discussion purposes only.
It does not constitute investment advice or a trading recommendation.
Please conduct your own research or consult a certified financial advisor before taking any trading positions.
Gold: Building a bottom, but caution remainsWeekend Greetings!
Over the past week, gold has been consolidating within the 4160–4000 range. Technically, this range suggests a short-term bottoming phase. However, given that prices recently reached new highs and have since formed a double-top pattern, it’s still too early to confirm a bottom. In the upcoming sessions, traders should remain cautious, avoid chasing highs, and be alert for potential bull traps or a fifth-wave decline, as mentioned last week.
On the 4H chart, higher lows are being established, and Friday’s close was above both the MA5 and MA20, with the MACD maintaining a bullish configuration. The MA60 and MA30 are currently positioned around 4180 and 4163, respectively, serving as key resistance zones. If gold can hold above these levels, there’s a good chance it will approach or even reclaim the 4300 level.
On the daily chart, gold remains supported by the MA20, with long lower wicks indicating active bullish participation, which favors further upside. However, the MA5 and MA10, located around 4154 and 4188, still act as short-term resistance. For a stronger bullish confirmation, the price needs to stabilize above 4160, ideally holding firm above 4180.
On the 30M/1H charts, moving averages are closely aligned, showing short-term consolidation. Notably, the last three candles on the 30M chart form a Morning Star pattern, a typical bullish signal. If this formation remains intact after the market opens, prices are likely to move higher.
From a fundamental perspective, no bearish news emerged over the weekend. Unless unexpected developments occur before the market opens, the technical outlook favors an upward move during Monday’s session.
XAUUSD Analysis todayHello traders, this is a complete multiple timeframe analysis of this pair. We see could find significant trading opportunities as per analysis upon price action confirmation we may take this trade. Smash the like button if you find value in this analysis and drop a comment if you have any questions or let me know which pair to cover in my next analysis.

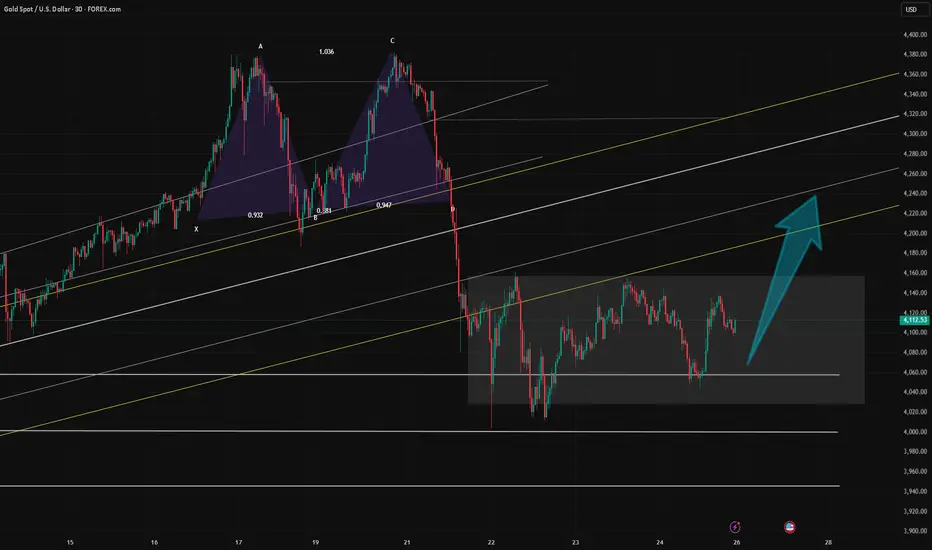
Buy Pressure Building on GoldGold is displaying signs of buyer re-entry after a period of controlled downside movement. The recent liquidity sweep around the lower range indicates that short-term selling pressure has been largely absorbed, creating favorable conditions for a potential upward expansion.
Market activity suggests renewed interest from institutional participants accumulating within the current price zone. The consolidation phase appears to be forming a base, signaling the possibility of a directional shift as liquidity gradually migrates upward. Increasing momentum on the lower end of the range reflects confidence returning to the market, setting the stage for a possible continuation toward higher valuation areas.
The outlook remains constructive as long as current accumulation behavior sustains, with market sentiment leaning toward a recovery-driven advance in the near term.
