Trade ideas

BULLS READY TO TAKE CHARGE AGAINChart Overview
Pair: XAUUSD (Gold / USD)
Timeframe: 1 Hour (1H)
Current Zone: Around 3960–4015
Type of Structure: You’ve drawn a descending wedge / falling channel pattern.
📉 Pattern Explanation
Your drawing shows:
Sharp impulsive drop → heavy selling pressure earlier.
Consolidation inside a wedge → price making lower highs and lower lows, but the slope is narrowing.
Circle area (highlighted) → likely key reaction zone / breakout area.
That means you’re expecting:
The market to retest the lower boundary once more.
Then reverse upward from support near 3920–3940.
Targeting breakout toward 4010–4040 zone.

Mapping the Next Possible Move | Key Breakout and Demand ZonesGold (XAUUSD) is currently consolidating between key structural zones, showing a balanced tug-of-war between buyers and sellers. The 4025 area remains the short-term resistance to watch — a clean break and close above this level could confirm bullish continuation toward 4075 and the major supply zone around 4150.
On the other hand, failure to sustain above 4025 may trigger a short-term pullback. The 3925–3960 zone has acted as a strong demand area where buyers have consistently stepped in, making it a crucial support for potential bullish rejections and trend continuation.
At this stage, the next possible move will likely depend on how price reacts around these two major zones:
Bullish scenario: Break and retest above 4025 → potential rally toward 4150.
Bearish scenario: Rejection at 4025 → possible correction toward 3925 demand.
Overall sentiment remains neutral-to-bullish as long as price holds above the demand area. Watching for a confirmed breakout or clear rejection structure before taking directional trades is key.

GOLD at Cut n reverse region? What's next??#GOLD... market perfectly place a low in region.
That is our most important region and our key region for next move.
Keep close and if market holds then buying expected otherwise not at all.
I repeat it again that is full n final region..
NOTE: we will go for cut n reverse below region on confirmation.
Good luck
Trade wisley

Gold as of the momentGold continues its bullish run, pushing toward the $4,050 mark — momentum remains strong as investors rally behind the trend.”
Gold is eyeing $4,050, extending its bullish momentum! Market sentiment stays optimistic as demand strengthens.”
“Bullish energy in the gold market! Prices are climbing toward $4,050, reflecting growing investor confidence.”
XAU/USD Gold support breakdown strong bearish trend📉 GOLD (XAU/USD) Sell Setup Alert 💰✨
🔹 Current Trend: Bearish momentum continues on the 1H timeframe
🔹 Support Breakdown Possible: from $3935 zone
🎯 Technical Targets:
1️⃣ TP1: $3894
2️⃣ TP2: $3826
⚠️ Watch for confirmation candles & volume before entry
📊 Always follow your risk management plan — protect your capital!
💬 What’s your view on this setup?
👇 Drop your thoughts in the comments!
📈 Like | 🔁 Share | 💬 Comment | 🔔 Follow for more live trade updates & insights!
#XAUUSD #GoldAnalysis #ForexTrading #PriceAction #SellSetup #RiskManagement #TraderMindset

GOLD (XAUUSD) | Smart Money Buy Setup from Demand Zone 📝 Description:
Gold is showing a potential reversal structure from the lower demand zone after a liquidity grab near $3,962.
The price is now reacting bullishly from the mitigation block and aiming toward the supply zone at $3,984–$4,019.
Trade Plan:
Entry: From $3,972–$3,975 demand zone (after liquidity sweep)
Stop-Loss: Below $3,962 (structure invalidation)
Target: $4,019 (supply zone / PDH area)
Bias: Bullish – expecting continuation toward previous highs
R:R: ~1:3 setup
If price cleanly breaks above $3,984, expect further continuation to $4,029 (Previous Day High).
A failure to hold above $3,962 would invalidate this bullish setup.

Gold (XAU/USD) AnalysisGold (XAU/USD) Analysis – November 3, 2025 | Key Rejection Zone Ahead
Gold remains under short-term pressure as price struggles to sustain above the $4,010–4,020 zone. After a minor rebound from the $4,000 psychological level, buyers failed to create a new higher high, suggesting that the current structure may evolve into a lower-high formation before a possible continuation to the downside.
Technical Outlook:
Trend: Bearish bias on H1 and H4
Resistance levels: 4,060 – 4,110 – 4,160
Support levels: 3,950 – 3,900
EMA cluster: 20/50 EMA still pointing downward, showing weak bullish recovery
RSI: Below 50, confirming momentum loss in buyers
Trading Strategy:
Watch for price action rejection around the 4,050–4,060 resistance area.
If the market forms a double-top or bearish engulfing pattern in this zone, sell continuation setups could target 3,950 and 3,900.
Invalidation occurs if gold closes above 4,110 on the H1 timeframe.
Summary:
Gold is consolidating within a corrective structure, and the current setup favors sellers if resistance holds. A clean break below $4,000 could trigger another bearish leg in the short term.
If you find this setup useful, save it and follow for daily technical updates and trading insights.

All is nothing...When the war begins, all resistance, all supply, all trendline, all dream about discount is nothing.

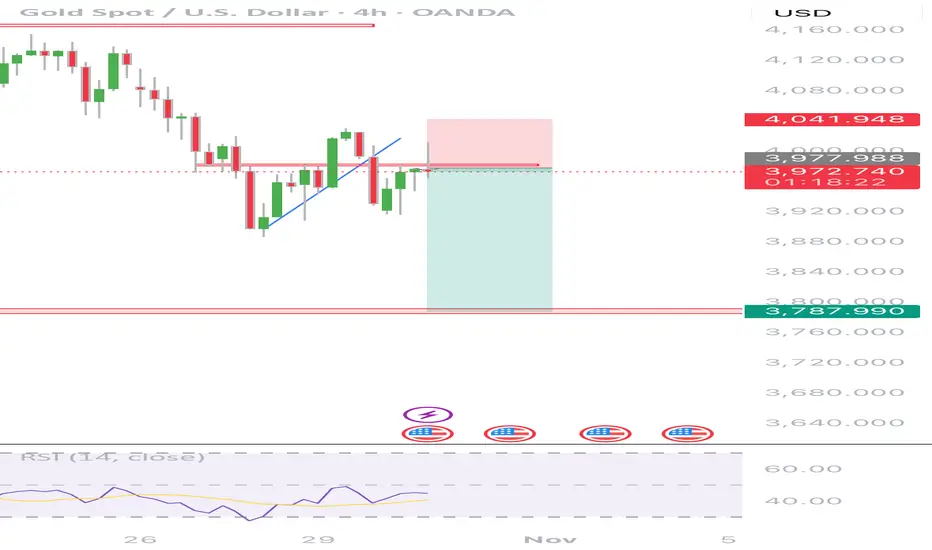
Gold 4-Hour Timeframe Analysis(Nuclear testing Resumed)Gold appears to be setting up for another potential short opportunity. Despite yesterday’s rate-cut announcement, price action showed limited bullish momentum, even after Chair Powell signaled the likelihood of an additional cut in December. This lack of upside response suggests continued bearish sentiment.
Additionally, geopolitical risk remains elevated. Reports indicate former President Trump may push to resume nuclear testing, in response to President Putin’s recent strategic posturing and threats involving advanced weapons systems. While such developments typically support safe-haven assets, gold has yet to reflect meaningful bullish follow-through following these headlines.
Overall, current structural behavior on the 4-hour chart continues to favor bearish movement unless a significant shift in fundamentals or market sentiment emerges
XAUUSD Short term SwingThis probably will be a good setup, since its bearish now i suspect price will bounce around recent high to recent low to continue the trend.
Its also near the premium zone of 1H and its near breakout zone in 1D.
So we just need to wait a small liquidity grab inside 5m OB and CHOCH, and that is my entry.
If everything work accordingly, this can be 6R trade.
If there is any constructive feedback, please do so, i am still learning

Structure Neutral Until Breakout Confirmation”Currently, price is moving between two key zones
the upper OB (4040–4045) acting as resistance and the lower OB (3960–3980) serving as strong support.
Two Possible Scenarios...
Bullish Case: A break and hold above 4000 could push price toward the upper OB (4045 zone).
Bearish Case: A rejection from the mid-level 3980
may drag price back toward the lower OB / support zone (3960).
Key Levels:
Resistance: 4045
Support-1: 3998
Support-2: 3960
Wait for clear confirmation from either side before entering. This zone is no-trade territory until breakout.

XAUUSD (GOLD) – ASIA SESSION ANALYSIS RESULTS4️⃣ High-Probability Trade Scenarios
📉 SELL Setup (Main Bias)
• Entry Zone: 3,955 – 3,964 (Golden Zone)
• Confirmation: 5M/15M bearish engulfing or CHoCH after liquidity sweep.
• TPs: 3,940 → 3,930 → 3,916 → 3,898 → 3,886
• SL: Above 3,976
💡 Rationale: Rejection from fib zone aligns with H1 structure continuation; best risk-reward short setup.

GOLD Analysis Outlook The market has bounced strongly from the recent demand zone, showing renewed bullish momentum.
Price is currently trading above the 20 EMA (green) and testing the 200 EMA (red), adding confluence to a potential bullish continuation.
A sustained move above 4,025 could extend gains toward 4,200, 4,360, and 4,480.
However, a break below 3,910 would invalidate the bullish structure and shift bias to neutral.

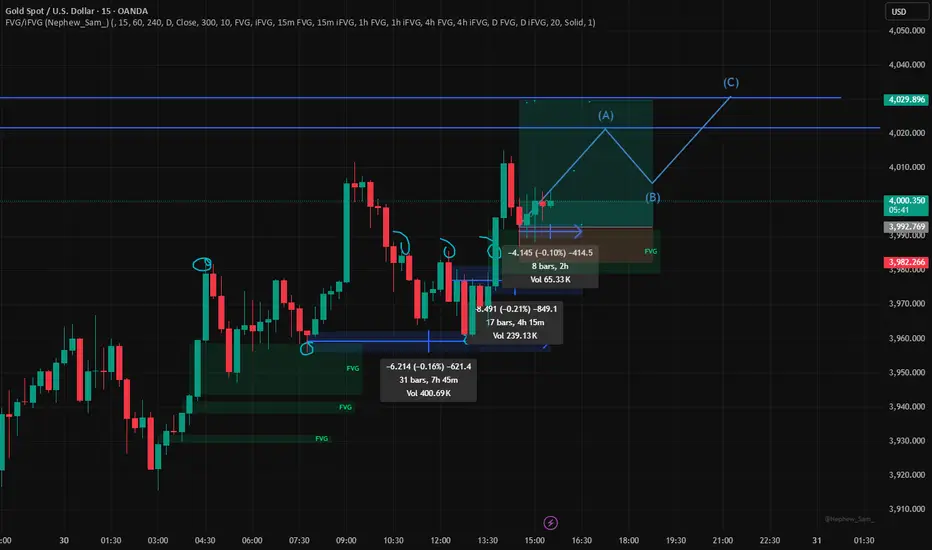
XAUUSD – GOLD PREPARING FOR A POTENTIAL BOUNCE FROM SUPPORTXAUUSD – GOLD PREPARING FOR A POTENTIAL BOUNCE FROM SUPPORT
🧲 1. Overview
After sweeping liquidity around 4016, gold is moving back toward the rising trendline on the M15 chart, likely building momentum for a potential rebound. The market structure suggests a possible bullish reaction targeting the upper Order Block zone.
📊 2. Technical Breakdown
Market structure remains mildly bullish in the short term.
The liquidity zone around 4000–4004 aligns with the ascending trendline – a key area to watch for reactions.
A small FVG is being filled, which may complete the price rebalancing before a push higher.
The bearish OB around 4038–4055 is the next logical target if buyers regain control.
The OTE zone (0.618–0.705) at 4004–4006 overlaps with liquidity and trendline support, creating a strong ICT confluence.
🎯 3. Trade Scenario (for reference only)
Buy: 4004–4006
Stop Loss: 3998
Take Profit: 4022 – 4038 – 4055 – 4080
⚠️ 4. Key Levels
4015–4018 → Short-term resistance / FVG zone
4004–4006 → Entry zone + liquidity + trendline support
4038–4055 → Main OB target
4080 → Extended target if momentum builds

Gold Under Pressure Sell Setup Near 3975XAU/USD is positioned near 3975, showing potential for a downside move as selling pressure builds and short term bullish momentum fades. If the current resistance holds, the pair could test the next support zone.
Key Levels:
Sell Entry: 3975
Take Profit: 3950
Stop Loss: 3995
Reasoning:
Technically, Gold has stalled near 3975, forming a local ceiling. Price action suggests that sellers may push the pair lower toward 3950.
Fundamentally, gold is facing headwinds from a firm U.S. dollar and rising interest rate expectations. Diminished haven demand and improving market sentiment in risk assets further limit upside potential.
Disclaimer:
This analysis is for educational purposes only and does not constitute financial advice.

technical analysis of your provided XAU/USD (GoldTimeframe: 15 minutes
Current Price: $3,963.81
Trend Structure: Price recently broke out from a descending channel.
Key Levels:
Support Zone: $3,920 – $3,940
Immediate Resistance: $3,980
Target Zone: $4,142
📉 Technical Breakdown
Descending Channel Breakout
The chart shows gold had been moving in a clear downward channel.
The recent candles show attempts to break above the upper trendline, suggesting potential bullish momentum building up.
Support Level
A strong demand zone is visible around $3,920 – $3,940.
This zone has been marked as a possible retest area before continuation to the upside.
Price Projection
The chart projects a bullish scenario, where price may retrace slightly to support before targeting the $4,142.60 level.
This suggests a swing-buy setup, with confirmation depending on a strong bounce from the support level.
Market Structure
The formation of higher lows near the lower boundary of the channel signals momentum reversal.
A confirmed breakout with volume above $3,980 will lik TVC:GR10Y TVC:GR02Y EURONEXT:PSI1! EURONEXT:EV6X2025 EURONEXT:GE8Z2025 EURONEXT:PO6X2025 ely validate the bullish continuation.
🎯 Trading Plan Suggestion (Analytical View)
Buy Zone: $3,940 – $3,950 (after confirmation candle)
Take Profit Target: $4,142
Stop Loss: Below $3,915 (to protect against false breakout)
⚠️ Notes
Watch for price rejection near $3,980, as it could form temporary consolidation. EURONEXT:PO6X2025 EURONEXT:SNAX2025 EURONEXT:EV8Z2025 EURONEXT:PSI1! EURONEXT:XA8Z2025 EURONEXT:XA6X2025 EURONEXT:PO8Z2025
If price closes below $3,920, bearish momentum may resume.

Detailed Technical Analysis Description (XAUUSD, 1H)
## 📈 Detailed Technical Analysis Description (XAUUSD, 1H)
### 1. **Overall Price Action and Trend**
The chart covers the period from roughly **October 1st to the beginning of November**.
* **Early October Rally:** The price starts low (around 3,930 to 3,940) and experiences a **strong, sustained bullish trend** throughout the first half of October, peaking around **4,350-4,375**. This rally is characterized by frequent **"BUY" signals** and a prominent green-shaded indicator area.
* **Mid-October Reversal and Downtrend:** After the peak, the market undergoes a sharp reversal and enters a significant **downtrend**. This correction is marked by a large red-shaded indicator area, a **"SELL" signal** near the high, and continuous price drops, breaking through the previous structure.
* **Late October/Early November Consolidation:** The downtrend finds a temporary low around **3,940**. The most recent price action (late October/early November) shows the price attempting to recover, moving sideways-to-up within a **defined, short-term range** (roughly 3,975 to 4,025).
### 2. **Key Indicator Overlay (The Shaded Area)**
The most prominent feature is the shaded, ribbon-like indicator (green for up-trend, red for down-trend), which likely represents an adaptive moving average or a custom trend-following tool:
* **Bullish Phase (Green):** The **green ribbons** are spread out and consistently below the price, indicating strong upward momentum and serving as dynamic support. Frequent "BOS" (Break of Structure) labels suggest the upward trend is continuously creating higher highs.
* **Bearish Phase (Red):** The **red ribbons** dominate the second half of the chart, running consistently *above* the price. The ribbons start very wide, showing strong downward momentum, and then contract as the price starts to flatten, suggesting momentum is slowing.
* **Current State:** The current price action is hovering around the transition point, with a small green ribbon beginning to appear again.
### 3. **Identified Trading Ranges and Structures**
The chart features several labeled structures:
* **High-Volume/Wide Trading Range (Labeled "Wide Trading Range"):** This box (around 4,000-4,350) covers the peak and the initial, volatile drop, suggesting a major area of distribution and reversal.
* **Recent Trading Range (Labeled "VL&D Trading Range"):** A smaller, red-bordered box (around 4,000-4,200) highlights a key consolidation period during the mid-to-late October drop.
* **Current Structure (Late October/Early November):** The very recent price action is contained within a **small, blue-lined upward-sloping channel or flag pattern**. This is an **ascending wedge or channel** that typically suggests a continuation of the previous trend (down) or a potential short-term breakout.
### 4. **Signals and Labels**
* **BUY/SELL Signals:** These markers indicate specific entry/exit points generated by the custom indicator system. They appear strategically, often at key turning points, though not all lead to sustained moves.
* **BOS (Break of Structure):** Appears often in the uptrend, confirming the establishment of new higher highs, a classic sign of a strong trend.
* **LL (Lower Low):** Appears during the downtrend, confirming the progression of the bearish move.
* **Current Key Price Levels:**
* **Resistance:** The recent high around **4,030-4,035** and the level where the blue channel's upper line sits.
* **Support:** The bottom of the blue channel, currently around **3,980**, and the horizontal green line around **3,975**.
In summary, the chart shows Gold moving from a **strong parabolic rally** to an **aggressive bearish correction**, and is now attempting to **consolidate and potentially reverse** within a tighter, short-term ascending pattern.
---

GOLD BEARS ARE GAINING STRENGTH|SHORT
GOLD SIGNAL
Trade Direction: short
Entry Level: 4,004.18
Target Level: 3,900.47
Stop Loss: 4,072.59
RISK PROFILE
Risk level: medium
Suggested risk: 1%
Timeframe: 4h
Disclosure: I am part of Trade Nation's Influencer program and receive a monthly fee for using their TradingView charts in my analysis.
✅LIKE AND COMMENT MY IDEAS✅

At the moment, D1 and H4 are synchronized — bearish bias. Target
Analysis at 09:00 (UTC +2)
At the moment, D1 and H4 are synchronized — bearish bias.
Target: D1 Fractal.
The continuation of the bearish structure looks logical, but there’s a caveat.
The W1 IMB has been mitigated, and on D1 a lot of liquidity has already been taken.
Considering the aggressive rally since August and the current correction on W1, there’s a high probability that a bullish setup may start forming from the current price level.
However, we have a problematic zone — FTA / D1 IMB.
For confident longs, the price needs to secure a close above this zone.
Until that happens, the short scenario remains valid.
For today:
There’s an H4 bearish BPR, from which we can expect confirmation for a move lower; inside it there’s an AH, which could be a potential entry point.
Asian session narrative: it swept its own liquidity and built a bullish sentiment. The upward move looks strong, so to confirm a short we need bearish confirmation on H1, since the long may still continue.
A local long from the H1 IMB toward AH is possible if the zone gets tested and AH remains intact.
If the price closes above PDH, the bearish scenario will start to lose strength — we’ll need to wait for more information.
Every zone I’ve marked requires additional confirmations on lower timeframes (LTF).
Concept: Smart Money

Gold (XAUUSD) – 30 Oct | Key OB (3937.9 – 3930.3) in Focus🟡 Gold (XAUUSD) Analysis – 30 October
Hello Disciplined Traders,
Welcome to the Chart Is Mirror Community 👋
Market Context
• After the recent H4 bearish structure shift , the M15 structure has turned bullish , indicating that H4 is currently in a pullback phase while M15 remains in an active bullish trend.
• Following the M15 bullish CHoCH yesterday, the market pulled back to retest the key demand zone 3916.5 – 3905.7 , which has been respected multiple times.
• Today morning, the Asian session also took support twice from this demand zone , holding the day’s low level and showing internal structure shift to the upside , suggesting that the market is likely aiming to break the 4030.5 previous day high .
Key Observations
• The 3916.5 – 3905.7 demand zone remains a strong intraday base for buyers.
• As per current price action, we will look for a short-term long setup from the buy zone 3937.9 – 3930.3 OB .
• If the market pulls back to this zone and shows LTF bullish confirmation , we will execute our buy setup accordingly.
• A sustained move below 3905.7 will invalidate the current internal bullish structure.
Execution Plan
• Wait for price to retest the 3937.9 – 3930.3 OB zone .
• If the zone is respected and LTF confirmation aligns , we will execute our long setup accordingly .
• If price fails to hold above 3905.7, stand aside and reassess the structure before taking new positions.
• The market remains volatile — manage position size and risk carefully .
Stillness between confirmation and execution defines discipline.
📘 Shared by @ChartIsMirror

Gold price analysis October 29✳️ XAUUSD Update – 29/10
The early Asian session saw some buying pressure, but the overall trend is still unclear. The 4015 zone is currently acting as an important resistance – buyers need to break this zone decisively to expect the uptrend to be restored.
On the contrary, if the price continues to be rejected at 4014–4015, there is a high possibility that the downtrend will be extended and the price may return to test deeper support zones around 383x.
📉 Trading strategy:
SELL when the price rejection signal appears at the 4014 zone
Target: 3930
If the price closes above 4015, switch to the BUY plan following the uptrend.

XAUUSD support and resistance AOI (SHORT AND WHY)Strong support and resistance AOI (Area of interest) on 4H.
Wait for price to break under the AOI and retest it before entering. Big potential 1:3 to 1:4 RR if tight stop loss.
Weekly is bearish, Daily is bearish and and 4H is bearish for the moment. In 30 min chart 50 EMA has also ben tested twice so big confluence.
Beautiful head and shoulder on the 15M chart that the neckline has been broken. Wait for the restest again before entering short.
So I believe the break and retest of the zone is going to happen anytime market opens.
