Non-Farm Payrolls Ahead: How to Position for Gold?
During Thursday's Asian trading session, gold fluctuated between slight gains and minor pullbacks, consolidating around $4060. With the US September non-farm payrolls report finally due, the market remained cautious, with investors generally choosing to postpone adding new directional positions. The current sideways pattern also reflects the market's increasing sensitivity to macroeconomic uncertainties. The core factor influencing gold prices remains changes in interest rate expectations. Investors are remaining on the sidelines ahead of the crucial US non-farm payrolls report. Expectations of a December rate cut by the Federal Reserve continue to cool, and the dollar has risen to its highest level since May, putting pressure on non-yielding gold. A recovery in risk appetite in the stock market has further weakened safe-haven demand, but uncertainty surrounding the momentum of the US economy due to the prolonged government shutdown limits the downside potential for gold prices. The market is awaiting the non-farm payrolls data to determine the dollar's trend and the further direction of gold.
Recently, the likelihood of a December rate cut by the Federal Reserve has further decreased. Given the cautious policy stance, the dollar has strengthened and risen to its highest level since May, thus significantly suppressing gold, which does not generate interest. The latest FOMC meeting minutes showed that while some officials favored further interest rate cuts, several others believed that further easing could exacerbate future price pressures. The market subsequently readjusted its pricing of the policy path, putting short-term pressure on gold. Meanwhile, global stock markets generally showed a positive sentiment, and the recovery in risk appetite weakened the safe-haven demand for gold. However, the data gap in the US economy due to the prolonged government shutdown has led to market skepticism about the true economic momentum. Investment institutions pointed out: "Because the data recovery after the shutdown is incomplete, the actual growth momentum may be lower than apparent, therefore, support for gold still exists." Under the interplay of multiple factors, gold prices, although under pressure, did not experience a one-sided decline. Regarding the geopolitical environment, recent developments in external negotiations have further improved risk sentiment and suppressed the upward momentum of safe-haven assets. This news strengthened the market's willingness to allocate to risk assets, prompting some funds to flow from gold to other assets.
Market Trend Analysis: Today, the highly anticipated non-farm payrolls report is about to be released! This is not just any ordinary employment data; it is the first employment data released after the US government reopened, drawing immense attention! Why is this non-farm payroll data attracting so much attention? Think about it: during the government shutdown, many economic data points couldn't be released normally. Now that the government has finally reopened, this data is like a ray of light in the darkness, illuminating the latest situation in the US job market. Moreover, it has a crucial impact on the Federal Reserve's future monetary policy direction, meaning it could potentially trigger significant market volatility! Looking at Tuesday's ADP data, the focus is undoubtedly on weak employment and increased expectations of interest rate cuts! However, there are already various speculations and analyses in the market, and no one can guarantee what the data will actually show. If the data far exceeds expectations, it could give the dollar a strong boost. How will the stock market, gold, and commodity markets react? If the data falls short of expectations, will expectations of a Fed rate cut intensify further? All these questions will be answered today.
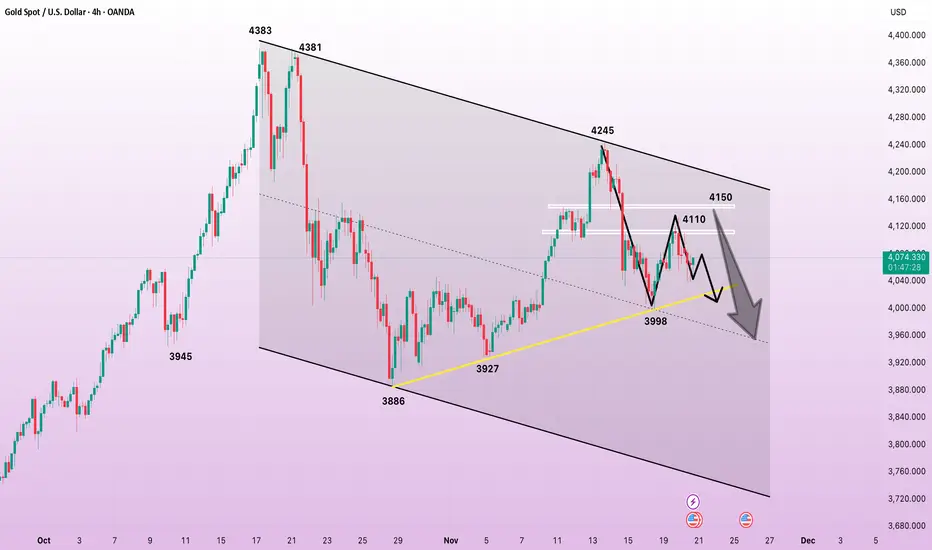
Gold prices have fluctuated wildly these past two days, but this is in line with our expectations. If you recall yesterday's analysis, we predicted a rise followed by a fall, and the market cooperated. All three of our long positions yesterday were profitable. Today, gold prices plunged in the Asian session. My strategy for today's Asian session is to sell on rallies. This isn't a direct, one-sided drop, but rather a decline within a range. Every rebound is an opportunity to sell. Yesterday's daily chart showed a doji candlestick with a very long upper shadow, and the 5-day and 10-day moving averages have converged, indicating resistance around 4090. My strategy for today's Asian session is to continue shorting around 4090, with a target of 4000. Gold has formed a double-step decline pattern. Unless gold rises to 4111, the outlook remains bearish. Gold has been very volatile recently, so timing is crucial. Avoid long positions before the US session; look for opportunities to short. The real action will come with the US non-farm payroll data. If gold breaks 4000, you can add to your short positions. In summary, today's short-term trading strategy for gold is to primarily sell on rallies and secondarily buy on dips. The key resistance level to watch in the short term is 4100-4110, while the key support level is 4030-4000. Please keep up with the pace.
Trade ideas
THE KOG REPORT THE KOG REPORT:
Last week was an extremely decent week in Camelot with all Gold targets hitting and completing.
Quick KOG Report this week.
We’re expecting a potential range to form here between the with the key level of support being the 4040 level while 4080 will need an engulfing to attack this region. Above, the bias level is 4095 which we’re looking for the break on to then attempt the 4120-30 region initially. Although we have a reversal in play on most time frames, we would say play caution here as this could just be a swing low in formation before another opportunity for the market to get buyers in higher and flushing again.
RED BOXES:
Break above 4095 for 4104, 4110, 4120 and 4127 in extension of the move
Break below 4080 for 4065, 4055 and 4040 in extension of the move
Please do support us by hitting the like button, leaving a comment, and giving us a follow. We’ve been doing this for a long time now providing traders with in-depth free analysis on Gold, so your likes and comments are very much appreciated.
As always, trade safe.
KOG

Gold next move (weekly forecast) (17th Nov - 21st Nov-2025)Go through the analysis carefully, and do trade accordingly.
Anup 'BIAS for the week (17th Nov - 21st Nov-2025)
Current price- 4085
1st scenario
"if Price stays below 4120, then next target is 4060, 4040, 4020 and 4007 and above that 4140 and 4180"
2nd scenario (applicable if daily candle doesn't closes below, see the chart below)
if price stays above 4000, then the next target is 4060, 4100, 4150, 4250.
Best of luck
Never risk more than 1% of principal to follow any position.
Support us by liking and sharing the post.

GOLD WEEKLY CHART MID/LONG TERM ROUTE MAPHey everyone,
Please see our weekly chart timeframe Routemap and Trading plans for the week ahead.
After securing 4059 last week, we now have a long range candle body close gap above at 4294, with 4059 acting as support. We can expect price action to play between these two levels. A further EMA5 cross and lock above 4059 will strengthen the gap toward 4294. Conversely, a candle body close back below 4059 would reopen the broader retracement range.
We’ll keep these long timeframe structures in mind as we continue with our plan to buy dips.
We will keep you all updated as this chart idea unfolds.
Mr Gold

Gold bulls stage a strong comeback!Market awaits rate cut signal
On Wednesday (November 19), gold rose modestly for the second consecutive trading day, attempting to extend the previous day's rebound from the psychological level of nearly $4,000, and is currently trading around $4,110. The decline in Wall Street stocks indicates that market concerns about the US economy have led to fragile risk sentiment, putting dollar bulls on the defensive. Coupled with the ongoing geopolitical risks from the Russia-Ukraine conflict, these factors have become key factors supporting the rise of the safe-haven precious metal. However, due to weakened market expectations for another Fed rate cut in December, a substantial depreciation of the dollar is unlikely. This, in turn, may limit the upside potential of gold, a non-interest-bearing asset. Before positioning for the next directional move in gold, the market may prefer to wait for more clues about the Fed's rate cut path. Therefore, market focus will be on the Fed's FOMC meeting minutes released later today, and the delayed US non-farm payroll report to be released this week—currently showing signs of a slowdown in the labor market.
As the longest government shutdown in U.S. history continues, investor concerns about weakening economic momentum persist, weighing on market sentiment and supporting safe-haven gold. The Ukrainian military stated on Tuesday that it had used U.S.-supplied ATACMS to strike targets within Russia. Amid the ongoing conflict, Zelenskyy will visit Turkey to restart stalled Russia-Ukraine peace talks. U.S. envoy Steve Vitkov is expected to participate in the talks. However, Kremlin spokesman Peskov stated that Russian representatives will not attend, and geopolitical risks continue to support precious metals. The dollar struggled to find substantial buying interest, fluctuating around 99.55. Several Federal Reserve officials have recently signaled caution regarding further monetary easing next month. Federal Reserve Vice Chairman Philip Jefferson stated earlier this week that the Fed needs to proceed cautiously with policy. Meanwhile, Governor Christopher Waller continued to justify further rate cuts due to concerns about a slowing labor market and hiring. Data from the U.S. Department of Labor showed that continuing jobless claims rose to 1.957 million in the week ending October 18, indicating that the unemployment rate may have climbed in October. Currently, market pricing indicates a roughly 50% probability of an interest rate cut, a significant decrease from 94% a month ago. Therefore, the delayed September non-farm payroll report, due Thursday, is in focus. Combined with the release of the Fed meeting minutes later today, this will provide clues about the Fed's interest rate path and influence the dollar and gold price movements.
Gold Price Analysis: Reviewing yesterday's gold price action, the overall trend was one of bottoming out and rebounding. After finding support at 3998, the price broke through 4030 in the US session, officially turning bullish. After a pullback to 4029, it rose again, reaching a high of 4082 at one point, closing with a small bullish candle with a long lower shadow. From the daily chart perspective, yesterday's gold closed with a small bullish candle with a lower shadow. This candlestick pattern contains rich market information; the presence of the lower shadow indicates that in the battle between bulls and bears, the bulls gained the upper hand, driving the price rebound higher. Ending a three-day losing streak, a "king's return" scenario! Today's focus will shift to the Fed meeting minutes.
Although yesterday's trading session closed with a positive candle, the overall situation is not optimistic. The short-term moving averages above are providing significant resistance, and no substantial breakthrough has been achieved. Given the three consecutive negative days, the single positive candle's rebound is likely only a temporary correction. The market is expected to continue its pullback this morning, with support around 4050, a level that has acted as a support/resistance level and will serve as a key dividing line between bullish and bearish trends. The European session's movement will be crucial and will continue to influence the US session's trend. The significant resistance remains around 4100-05, the previous high of the negative candle. This area will be the last line of defense for both bulls and bears in the short term. Whether the current daily moving average system can break through this resistance remains to be seen. Given yesterday's rebound and this morning's pullback, there is still some room for continuation today. A long position can be considered if the price retraces to around 4055-50. A special reminder: the non-farm payroll data will be released this Thursday. While there is anticipation for a bullish move, the impact of the non-farm payroll data should also be closely monitored. In summary, the recommended short-term trading strategy for gold today is to primarily buy on dips and secondarily sell on rallies. The key resistance level to watch in the short term is 4100-4110, while the key support level is 4050-4030.

A great opportunity to sell gold!- Bearish Channel as an corrective pattern in Short Time Frame
- Order Block
- Demand Zone
- Change of Characteristics
- Fibonacci Level - 23.60% / 38.20%

Gold Weak Below 4084 as Market Awaits PMI DataGOLD – Technical & Fundamental Outlook
FX:XAUUSD attempted a bounce from the 4030 support and is currently trying to approach the 4085 resistance, but overall momentum still appears weak.
From the fundamental side, recent data was mixed — NFP showed growth while the unemployment rate increased, creating higher volatility. Rate-cut expectations also remain muted, with markets pricing around 40% probability for another Fed cut, keeping the Fed cautious about premature easing.
Today, gold traders will monitor the PMI data, which may shape intraday volatility and short-term direction.
Technically Gold maintains a bearish structure in both the short and medium term while trading below 4084.
Below 4084, price is expected to retest 4030,
and a break below this zone can extend the decline toward 4008 – 3982,
as long as the fundamental backdrop remains unchanged.
On the upside, a 1H candle close above 4084 would invalidate the bearish setup
and open the door for a move toward 4104.
Pivot Line: 4051
Resistance: 4084, 4104, 4133
Support: 4030, 4008, 3982

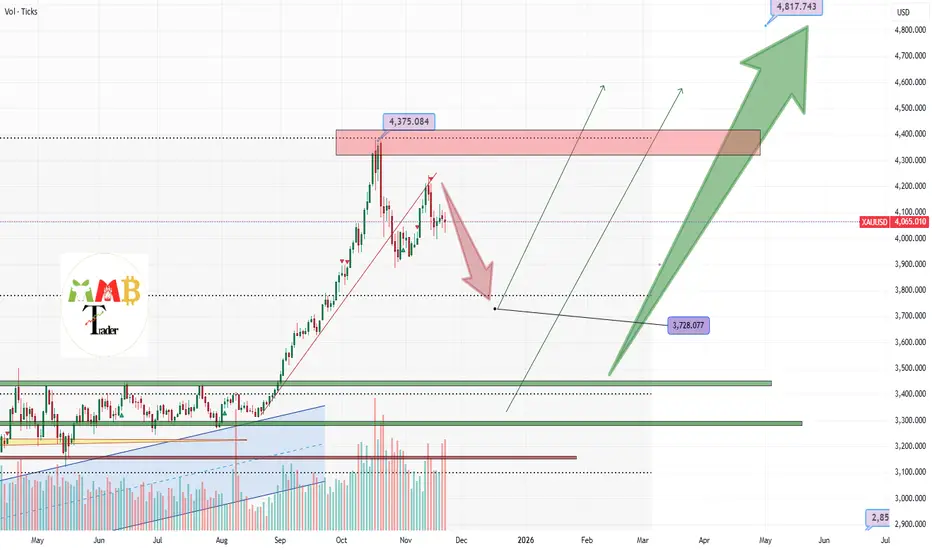
GOLD dump is just started Gold has decisively broken below its key bullish trendline on the daily timeframe and has now completed a retest of this level as new resistance. This technical development suggests a potential shift in momentum, indicating that a corrective phase may be underway. Should this bearish structure hold, we could see a downward move toward initial technical targets around the $3,700 level, which represents the next significant support zone.
DISCLAIMER: ((trade based on your own decision))
<<press like👍 if you enjoy💚
Gold: Consolidation Is Not Over YetGold turned sharply lower in October, pulling back around 10%, which is quite normal after such a strong and aggressive recovery this year. The key question now is whether this is now wave four of an ongoing extended black wave five cycle, or if wave five already completed leg out of triangle, at the 4380 area !?
Well, notice that Gold turned lower at the end of last week from the trendline resistance after only an ABC rise into the 61.8–78.6% Fibonacci zon e, and the market then dropped enough to overlap the 4042 level . This makes me think we are in the middle of a complex correction.
It can be a triangle, it can be a flat, it can even be a WXY formation, so overall it looks like metals will stay inside this correction for a bit longer.
There is also a risk that lower supports will be retested first. The first important support is around 3940, but if that one gives way then the next bigger zone is down at 3700–3800. So, ff we are correct, metals will still resume higher later on, but right now we are still stuck inside this corrective phase, so it’s better to stay patient.
GH

GOLD – Bullish Momentum Above 4104 | Key Breakout LevelsGOLD | OVERVIEW
Gold maintains a bullish momentum as long as the price trades above 4104, which will support a continuation toward 4133, and a breakout above that level opens the path toward 4147.
However, a 1H close below 4104 will signal a shift in momentum, supporting a bearish move toward 4083. A break below 4083 may extend weakness further.
Technical Levels
Pivot Line: 4105
Support: 4083 · 4055
Resistance: 4133 · 4147

XAUUSD_1H_BuyGold Analysis Short and Medium Term Uptrend Trades from Buy to Sell Channel $4000 Buying Opportunity Target 4220

GOLD At Perfect Place For Sell Now , 200 Pips Waiting !Here is My 15 Mins Gold Chart , and here is my opinion , we again Below 4050.00 With 4H Candle and the price come back to retest it ! and we have a 4H Candle closure below it And Perfect Breakout and this give us a very good confirmation , so we have a good confirmation now to can sell now ! and we can targeting 100 to 200 pips . if we have a daily closure above this area this mean this idea will not be valid anymore .
Reasons To Enter :
1- Perfect Touch For The Area .
2- Clear Bearish Price Action .
3- Bigger T.F Giving Good Bearish P.A .
4- Over Bought .
5- Perfect 30 Mins Closure .

Gold Rallies 2700 pips ! Is a Correction Coming?🔥 Hello Traders!
Gold chart updated. As per our previous analysis, we expected an upward move, and the price followed it perfectly. Now it has reached supply zones, and a price correction is likely.
💰 Profit from this analysis: 2700 pips
📌 Follow me for more updates!

GOLD Breakout Done , Long Setup Valid To Get 300 Pips !Here is My 15 Min Gold Chart , and here is my opinion , the price going up very good and we have a 4H Candle closure above our Res 4100.00 And Perfect Breakout and this give us a very good confirmation , so we have a good confirmation now to can buy after the price go back to retest the broken area 4100.00 For the first time and hope it will give us a good chance to enter with good stop loss , and we can be targeting 100 to 300 pips . if we have a daily closure below this area this mean this idea will not be valid anymore .
Reasons To Enter :
1- Perfect Breakout .
2- Clear Bullish Price Action .
3- Bigger T.F Giving Good Bullish P.A .
4- The Price Take The Last High .
5- Perfect 4H Closure .

LiamTrading – XAUUSD H4 | Gold accumulates on the trendlineLiamTrading – XAUUSD H4 | Gold accumulates on the trendline, waiting to break the structure for a breakout
After testing the upward trendline twice, gold bounced up and then moved sideways around the 4065 area. On H4, this price zone has accumulated for almost a week – indicating that the selling force is not liquid enough to push the price down deeply, while there is still plenty of price gap above according to Fibonacci. My preferred scenario: gold continues to "compress" within the triangle, then breaks out to create a new wave.
Macro – Fed context
Fed member Collins emphasized that there is still reason to be cautious about cutting rates in the December meeting. She stated:
This is a complex phase, and it's not unusual for internal disagreements within the Fed.
The Fed must balance between the two goals of employment and inflation, which are moving in opposite directions.
This makes it difficult for the market to clearly price the interest rate scenario, so gold continues to choose to accumulate around important technical zones instead of breaking out in one direction.
Technical Analysis – Trendline, Fibonacci, Volume Profile
The current H4 structure is a triangle model with:
A downward sloping trendline from the old peak 42xx.
An upward sloping trendline from the late October low, acting as dynamic support.
Zone 4060–4070: the "balance" price zone last week – where the price moved sideways the longest, serving as a reference point for the short-term trend.
Key levels: 4132: near resistance, coinciding with the VAH area of the current Volume Profile.
4171: higher resistance, near the Fibonacci 1.0 area of the recovery wave.
4242: Fibonacci extension confluence zone (1.618) + historical resistance – where strong profit-taking is likely.
4347: 2.618 expansion zone – reference target if the peak is successfully broken.
4022 and 3997: important support close to the lower trendline – main buy zone if there is a liquidity sweep.
When the price decisively breaks out of one of the trendlines, the new trend on H4 will be clearer; the trading plan will follow this breakout direction.
Risk management and invalidation
H4 closes below 3997: the triangle structure is broken downward, fully prioritizing sell orders to lower zones – at that point, medium-term buy orders should not be held.
H4 closes above 4245 with good volume: considered a successful triangle peak breakout, discard all sell orders in this area and focus on buying according to the new trend.
Which scenario are you leaning towards for next week: breaking up to test 4242–4347 or sweeping down to 4022–3997 before bouncing back? Leave a comment and follow the LiamTrading channel on TradingView for daily XAUUSD updates.

GOLD Local Long! Buy!
Hello,Traders!
GOLD bounced from the horizontal demand after sweeping sell-side liquidity. Bullish displacement confirms a shift in order flow, suggesting price may continue toward the buy-side liquidity resting at the marked target level.Time Frame 5H.
Sell!
Comment and subscribe to help us grow!
Check out other forecasts below too!
Disclosure: I am part of Trade Nation's Influencer program and receive a monthly fee for using their TradingView charts in my analysis.

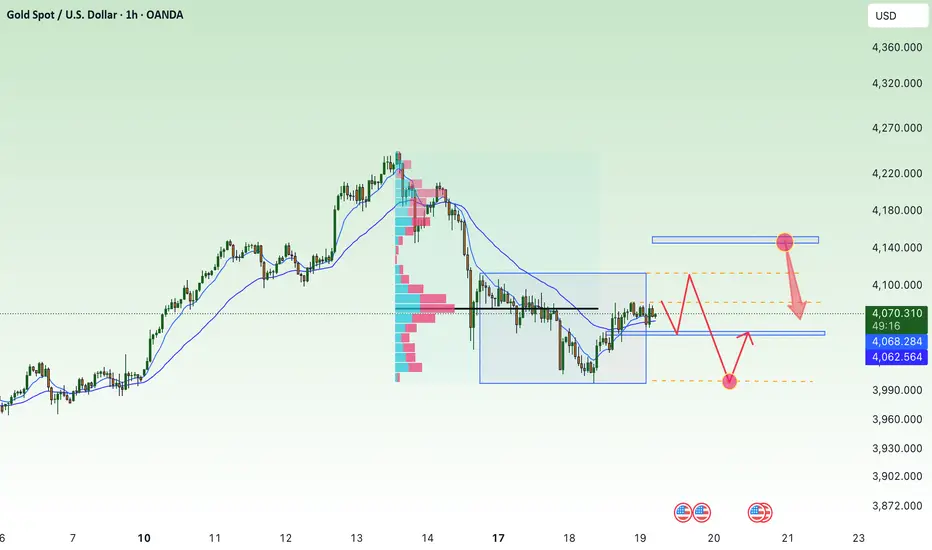
Don't miss this excellent opportunity to buy gold at low prices.In the current gold market, the price action is becoming clearer, with key support and resistance levels emerging. The 4050-4030 support zone deserves particular attention, as it offers strong support. If the price retraces to this level and successfully stabilizes, it would be an excellent entry point for long positions, potentially allowing bulls to launch an upward attack. Resistance is seen around 4110-4120. When the price first touches this area, it may face pullback pressure due to technical factors. However, if the price can consolidate and effectively hold above 4120, the possibility of further upward movement towards the 4150 target this week will significantly increase. Based on the current overall performance of gold, the market can be considered to be trading within the 4030-4120 range. The trading strategy should focus on buying on dips, taking advantage of rebounds from support levels to generate profits. At the same time, strict position control is crucial, as market conditions are constantly changing. Furthermore, it is essential to closely monitor real-time data and market dynamics to flexibly adjust trading strategies.
Gold trading recommendation: Buy gold in batches around the 4050-4030 range, with a target of 4080-4100.

Gold buy set up Gold is currently in a short-term bullish trend.
During the Asian session, gold stopped dropping and began forming higher highs and higher lows, signaling buyers stepping in.
How to Confirm the Long Setup
Wait for a 15m candle to close above the previous candle’s high.
This confirms continuation of the bullish structure and momentum.
When NOT to Take the Trade
If the 15m candle closes below the previous candle, avoid entering.
This indicates weak confirmation or potential reversal.

Gold Nonfarm: Buy OB 4030, Target Break 4111🔍 Market Context – November 20, 2025
Gold initially dropped nearly 70 pips at the start of the day but quickly rebounded sharply from the 4030–4032 zone, demonstrating strong buying pressure and a refusal to decline further.
The market structure on the H1–H2 timeframe is forming a classic, well-defined Inverse Head & Shoulders pattern—a quintessential bullish reversal pattern—signaling a potential upward expansion if the neckline is successfully broken.
📅 Key News Events Today:
🇺🇸 Non-Farm Payrolls (NFP)
📉 US Unemployment Rate
🏛 FOMC Meeting Minutes
🗣 Speeches by Trump, Barkin, Williams
🧾 Initial Jobless Claims
⚠️ These events could trigger sharp volatility and will determine the confirmation or rejection of the reversal pattern.
📊 Technical Analysis
🛒 BUY SETUP – Primary Priority
✅ Entry: 4030 – 4032
🛡 Stop Loss (SL): 4027
🎯 Take Profit (TP):
TP1: 4039
TP2: 4047
TP3: 4059
💡 Rationale: Price bounced strongly at the OB + SSS zone. This is a crucial technical support area and the base of the Inverse H&S pattern. The objective is to break the neckline to trigger the uptrend.
🔻 SELL SETUP – Short-Term Strategy
📍 Entry: 4093 – 4095
🛡 SL: 4098
🎯 TP:
TP1: 4088
TP2: 4077
TP3: 4060
TP4: 4033
💡 Rationale: This strategy is only applicable if the price forms a false breakout of the BSL zone and reverses. This is an ideal entry point for quick scalping if the market reacts negatively to the news.
🔑 Key Price Zones
Buy Zone (OB + SSS): 4030 – 4032
→ Strong demand zone, the base of the Inverse Head & Shoulders pattern, confirming the reversal signal if held.
Breakout Neckline Zone: 4101 – 4111
→ The neckline of the Inverse H&S pattern. Breaking this zone will open up opportunities for a sharp rise.
Final Resistance Zone: 4133 – 4140
→ The final target if the breakout is successful and the bullish pattern is confirmed.
✅ Strategy Conclusion
🎯 Main Strategy: Priority is to BUY in the OB zone 4030–4032.
🩸 SELL is only for short-term scalping if there is a signal of rejection at the BSL zone.
🕓 Caution: Be careful entering trades near the Nonfarm news release time—wait for price action to confirm the direction.

continue to accumulate and wait for NF this week⭐️GOLDEN INFORMATION:
Gold (XAU/USD) climbs toward $4,070 in early Asian trading on Wednesday, ending a three-day losing streak as risk-off sentiment lifts demand ahead of the long-awaited return of US economic data. Traders now focus on the FOMC Minutes later today, followed by Thursday’s US September NFP report.
The September and October 2025 NFP releases were delayed by the US government shutdown, complicating the Fed’s rate outlook heading into its December meeting. This uncertainty could continue to support safe-haven assets like gold
⭐️Personal comments NOVA:
Gold price after returning to the liquidity zone of 4000, continue to accumulate below 4115 and wait for NF news this week
⭐️SET UP GOLD PRICE:
🔥SELL GOLD zone: 4112 - 4114 SL 4119
TP1: $4100
TP2: $4090
TP3: $4080
🔥BUY GOLD zone: 4000 - 3998 SL 3993
TP1: $4010
TP2: $4025
TP3: $4040
⭐️Technical analysis:
Based on technical indicators EMA 34, EMA89 and support resistance areas to set up a reasonable SELL order.
⭐️NOTE:
Note: Nova wishes traders to manage their capital well
- take the number of lots that match your capital
- Takeprofit equal to 4-6% of capital account
- Stoplose equal to 2-3% of capital account
The gold market will remain on an upward trend until Friday.According to my analysis, gold will experience a decline up to 3678.24 or during the market's peak on the next day.

XAUUSD Analysis todayHello traders, this is a complete multiple timeframe analysis of this pair. We see could find significant trading opportunities as per analysis upon price action confirmation we may take this trade. Smash the like button if you find value in this analysis and drop a comment if you have any questions or let me know which pair to cover in my next analysis.

Down for goldHi traders,
Last week gold made a small upmove and a correction down.
So next week we could see a small upmove again to finish the correction up and another downmove to finish the bigger correction down.
After that it could go up again.
Let's see what price does and react.
Trade idea: Wait for a small correction up on a lower timeframe and a change in orderflow to bearish to trade short term shorts.
This shared post is only my point of view on what could be the next move in this pair based on my technical analysis.
But I react and trade on what I see in the chart, not what I've predicted or expect.
Don't be emotional, just trade your plan!
Eduwave
