Gold prices fell as expected,The next big opportunity is brewingGold Technical Analysis: Let's first discuss why the price has fallen so sharply, and the core point hits the nail on the head! Expectations for a Fed rate cut have completely cooled down! This is the most direct trigger! Recent US ADP employment data has surged higher than expected, suggesting the economy isn't as weak as it seemed. The previously certain "December rate cut" has now completely changed, with some institutions even saying there might only be one rate cut this year! It's important to understand that gold is a non-interest-bearing asset. As interest rates are expected to rise, the cost of holding gold increases, causing funds that previously rushed to buy to immediately withdraw. With a wave of selling, how can the price of gold not collapse?
Today, after gold broke through the key support level of 4150, we suggested shorting. As expected, it fell sharply. Unfortunately, gold continued to decline without giving us another chance to rebound. So let's wait patiently for an opportunity. We can't rush into the market in the current situation. Be patient and wait. If there's no opportunity, we'll try again next week. Have a peaceful weekend. As market expectations for a December rate cut continue to decline, gold prices are under increasing pressure.
Tonight, watch the 5-day moving average around 4035-4030 for gold. If it closes below this level today, market sentiment at the beginning of next week will likely be bearish and expect a correction. The 4035-4030 area is quite important, as it was the breakout point for the bulls on Monday and a previous support/resistance level. Given that it's Friday, bears shouldn't be greedy before a breakout and should wait for the weekly close. Normally, a market decline cannot be completed in one go, and a rebound is expected in the 4035-4030 range. As expected, we seized the opportunity to take profits, and the timing was exactly in line with our prediction. The rebound was met with resistance at 4110, and the market continued to fall. This round of decline is heading towards a break below 4000, followed by a test of 3886-3600! In the evening, the focus for gold remained on holding short positions and shorting at higher levels. If the price does not rise above 4120 tonight, short positions can be held over the weekend. Try to maintain a stable approach and wait and observe if there are no good entry points. In summary, today's gold trading strategy is to primarily sell on rallies and secondarily buy on dips. The key resistance level to watch in the short term is 4110-4120, while the key support level is 4030-4000. Please keep up with the pace. It is essential to manage position size and stop-loss orders carefully, strictly set stop-loss orders, and never hold onto losing positions.
Trade ideas

The timing for bullish entry has been precisely identified!Yesterday, the market experienced significant volatility, with gold prices surging to around 4132, a gain of 1.6%. However, as the US dollar index continued its upward trend and reached a near two-week high, coupled with hawkish signals from the latest Federal Reserve meeting minutes, market sentiment was severely dampened. Gold prices gave back all of the day's gains, ultimately closing only slightly higher at around 4077. Currently, investors' focus has completely shifted to the upcoming US September non-farm payroll report, hoping to find clear clues about future monetary policy and a new direction for gold.
From a technical perspective, on the daily chart, Friday's large bearish candlestick broke through key moving averages, setting the tone for a volatile week. Currently, the 5-day moving average area of $4120-$4130 has become a strong resistance level. If gold prices continue to be constrained by this level, the downside risk will significantly increase. The key support level is around $4050-$4030. If this level is effectively broken, it will confirm the continuation of the short-term correction trend, and gold prices may further test the important psychological level of $4000. However, the current price is still stable above the Bollinger Band's middle line, and the daily chart shows consecutive positive days, indicating that there is still some resilience in the market, and the bulls have not completely given up. Before the release of the key US non-farm payroll data, gold prices are expected to be trapped in a range-bound trading pattern. The subsequent upside potential depends on whether it can successfully break through the $4200 resistance level, while a deeper decline would require new negative fundamental factors to drive it.

1H XAU Scenarios 🟡 XAUUSD – 1H Technical Outlook
Gold continues to trade within a clear descending channel after failing to hold above the key resistance zone around 4097. The recent spike above the channel looks like a potential fakeout, as price was quickly rejected back below resistance.
Currently, XAUUSD is hovering near a mid-range support area, but bearish momentum remains intact as long as price stays under the red resistance zone.
Key scenarios:
🟢 Bullish Pullback Scenario:
A short-term recovery toward the channel’s upper boundary is possible. If price retests the 4090–4100 area and fails again, it may provide a high-quality sell setup.
🔴 Bearish Continuation Scenario:
Rejection from resistance and a breakdown from the lower channel could open the way for a deeper drop toward the major demand zone near 3920–3940.
Bias:
Still leaning bearish unless price can reclaim and hold above the 4097 structure. Watching for signs of exhaustion on any bullish retrace.

Gold: Open path to lower grounds?The price of gold was following general market sentiment during the previous week, and was traded in swings. The start of the week was marked with an increased demand for gold, bringing the price to the level of $4.243. However, Friday trading session brought a modest correction, where gold was headed toward the $4.035, but closed the week at $4.079.
The RSI closed the week at the level of 53, after previously reaching the level of 61. The indicator is showing that the market is struggling to take a clear path toward the oversold market side. The MA50 and MA200 lines are still moving without change - as two parallel lines with an uptrend.
Current charts are showing that the gold has an important level around $4.100, while strong support holds at $3.930. Friday trading session showed that the support at $4.1K was breached, which leaves the path open toward testing the $3.930 support. In this sense, the first stop for the price of gold might be the $4K level, before it continues its move further to the support line. With respect to the opposite side, there is currently some probability that the level of $4.1K could be tested again, and much lower probability for the level of $4,2K.

Gold Falls as Rate-Cut Bets Fade | Bears Take ControlGOLD | Overview
Gold extends its decline for the fourth straight session as traders scale back expectations for further Fed rate cuts this year.
Several Fed officials have signaled caution, pushing rate-cut odds below 50%, while investors wait for delayed U.S. economic data to gauge the economic outlook.
This shift in sentiment continues to pressure gold in the short term.
Technically:
Gold remains in a bearish structure while trading below the 4054 pivot level, with downside momentum targeting 4015 and 3983.
A break below 3983 would extend losses toward 3962.
A bullish recovery would require a 1H candle close above 4055, which could lift the price toward 4083 and 4105, with further extension to 4135 if buying strength increases.
Key Levels
Pivot Line: 4054
Support: 4015 · 3982 · 3962
Resistance: 4083 · 4105 · 4135

Smart Money Concept (GOLD)📊 PROFESSIONAL BREAKDOWN
1️⃣ Accumulation + Liquidity build-up
Price formed a solid range where liquidity was built on both sides, preparing the institutional move.
2️⃣ ChoCH + BOS: Real bullish shift
The sequence confirms bullish intent with both a structural break and a change of character.
3️⃣ Fake Out / Liquidity Grab
A sweep above the range confirms manipulation and removes buy-side liquidity before the true move.
4️⃣ Clean rejection at support
The current rejection aligns perfectly with institutional demand, validating the BUY zone.
5️⃣ Optimal BUY at 4,056
Confluences:
• ChoCH retest
• Support zone
• Previous FVG
• Strong rejection
6️⃣ Professional SL at 4,028
Placement is clean, safe, and protected from volatility spikes.
7️⃣ Target areas
• TP1: 4,112 → resting liquidity
• TP2: 4,150 → FVG mitigation in 1H
Both targets align with institutional price delivery.
🌟 Motivational Message
“Mastery comes from understanding the story behind each candle. Keep sharpening your institutional eye.” GOOD LUCK TRADERS

GOLD Bullish Analysis (SMC)🟦 PROFESSIONAL BREAKDOWN
🔎 1. Market Context
Price creates a strong bearish displacement, leaving a clean FVG unmitigated.
Then a significant ChoCH forms at a demand zone, signaling the first shift in market intention.
🧱 2. Institutional Accumulation Zone
Between the OB-5M and the support zone, we see:
• Consecutive rejections
• Order absorption
• Indecision candles
All of this reveals institutional buyers defending the level.
📉 3. Liquidity Sweep & Manipulation (Fake Out)
Price temporarily breaks below support, generating:
• Sell-side liquidity
• Immediate buy-side absorption
• Clean return into the range
This follows the classic SMC blueprint:
Liquidity → Mitigation → Expansion.
📈 4. Bullish Confirmation
A clean BOS confirms internal bullish structure.
The sequence becomes:
1. ChoCH
2. Liquidity sweep
3. OB mitigation
4. Bullish BOS
5. Expansion towards targets
Perfect institutional flow.
🎯 5. Entry Zone
📍 BUY 4,015
Confluences:
• 5M Order Block
• Strong support zone
• Fake out with absorption
• FVG mitigation
• Structural confirmation (BOS)
🛡️ 6. Stop Loss
📍 SL 3,990
Placed below the liquidity sweep — beyond this level, the idea is invalid.
🎯 7. Take Profits
• TP1: 4,045 → first distribution target.
• TP2: 4,067 → major buy-side liquidity target where institutions offload positions.
🧠 Professional Conclusion
This setup is built on:
✔ Liquidity engineering
✔ Clear structure
✔ Mitigation principles
✔ Institutional rejection
✔ Organic expansion
A high-probability bullish setup, fully aligned with institutional price behavior.
💬 Motivational Message…
“Great traders don’t chase the market — they anticipate it. Trust your process, respect your levels, and execute with confidence. Consistency is built candle by candle.”

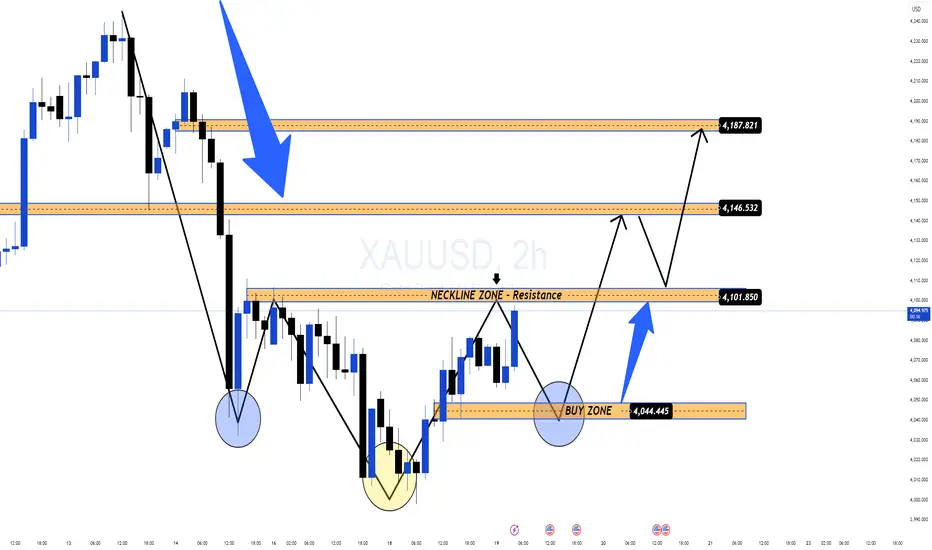
Gold Forms Inverted Head & Shoulders: Reversal Signal!After a short-term corrective decline, the $4,000 level has triggered strong BUY momentum, creating a clear price rebound at the end of yesterday's session. The increase in buying volume indicates that the BUY side is returning to the market after several sessions of being pushed down.
📊 Prominent Technical Structure
On the 2H chart, gold is completing the Inverted Head & Shoulders pattern – one of the strongest bullish reversal patterns.
• Head: liquidity bottom at 4,00x
• Two shoulders: forming symmetrically with good bounce
• Neckline: area 4,101–4,102, currently a key resistance
Price is likely to:
1️⃣ Slightly adjust to the neckline area or BUY ZONE 4,044–4,046
2️⃣ Retest – Accumulate – Confirm breakout
3️⃣ Break out towards 4,146 → 4,187 when the pattern is complete
🎯 Short-term Expectations
Volatility may increase ahead of upcoming economic data, so the reasonable strategy remains:
✅ Prioritize BUY according to the pattern
• Wait for retest of neckline or area 4,044–4,046
• Observe confirmation force (Volume – Momentum – Rejection)
• Target towards 4,146 → 4,187 if the pattern is activated
⚠️ Note
– The reversal trend is only truly confirmed when the price clearly breaks the 4,101–4,102 area.
– Market sentiment currently leans towards recovery, but clear signals are needed before entering large (long-term HOLD) positions.
XAUUSD_1H_BuyGold Analysis Short and Medium Term Elliott Wave Analysis Style The market is completing wave B and entering wave C.

Final session of excellent weekAs discussed throughout this week's commentary: 'As discussed throughout my Friday's session commentary: 'Technical analysis: Gold is showing increasing Selling presence on Weekly (#1W) chart as it is virtually unchanged (the (#1W) candle at # +1.86% currently) as Price-action is on parabolic downtrend within July’s High’s and October Low’s. This has effectively constructed an series of red Daily chart's candles hence the Bearish values on almost all charts which was an ideal Selling opportunity for Short-term Traders however Gold is struggling to stage more serious decline below #4,000.80 benchmark which I mentioned many times as possible 'floor'. Personally I remain on Medium-term Buying set-up as Daily and Weekly chart (#1W) remains heavily Bullish indicating that the latest decline was simply another accumulation and distribution phase of the recently started renewed Bull market. However the Price-action just touched the Weekly chart’s (#1W) #4,052.80 benchmark for the first time since recent upswing which was essentially the start of the parabolic rise. As a result when the #4,100.80 breaks, the next are of my importance is new ATH's level before possible Stabilization zone where Medium and Long-term Sellers will re-appear. If that happens then I will add to my portfolio giving a horizon of #20 - #30 session horizon until Gold hit #4,300.80 benchmark. However it is important to mention that if DX continues the spiral downtrend and Gold re-captures (confirmation by market closing) Resistance zone, Gold can correct #4,100.80 today.
My position: I have placed my Buys on #4,032.80 - #4,042.80 Long-term and my Targets are #4,100.80 - #4,127.80 zones. I maintain my #5,100.80 Long-term Target as these declines are excellent Buying opportunities / fuel for more up.'
My position: I have closed first batch of my Buying orders on #4,102.80 (#3 Buying orders engaged on #4,032.80 - #4,035.80) delivering spectacular Profits and I have Traded the #4,062.80 - #4,082.80 belt throughout yesterday's session (aggressive Scalp orders). As I have mentioned many times throughout my recent comments, I do expect #4,000.80 benchmark to pose as an Ultimate 'floor' and inside yesterday's session strong decline towards #4,000.80 benchmark. I have engaged set of Buying orders on #4,010.80 and closed all the way on #4,052.80 benchmark delivering excellent Profits. Gold holds some Bearish bias however as long as #4,000.80 benchmark is posing as an strong configuration, I will continue Buying Gold.'
My position: Yet another week has gone in spectacular manner as I was continuously waiting Gold to deliver Ultimate Low's and Buy there (did most of my Buys within #4,000.80 - #4,032.80 Ultimate Bottom) as #4,000.80 remains 'floor' as I mentioned many times throughout my remarks. Well done for Traders who followed my calls and are Buying Gold aggressively on each more serious dip, well done! (didn't had time to answer to all). Next week I will provide more Intra-day calls, enjoy the Profits and have a great weekend!

Excellent Profits on Bottom Buying twiceAs discussed throughout my Friday's session commentary: 'Technical analysis: Gold is showing increasing Selling presence on Weekly (#1W) chart as it is virtually unchanged (the (#1W) candle at # +1.86% currently) as Price-action is on parabolic downtrend within July’s High’s and October Low’s. This has effectively constructed an series of red Daily chart's candles hence the Bearish values on almost all charts which was an ideal Selling opportunity for Short-term Traders however Gold is struggling to stage more serious decline below #4,000.80 benchmark which I mentioned many times as possible 'floor'. Personally I remain on Medium-term Buying set-up as Daily and Weekly chart (#1W) remains heavily Bullish indicating that the latest decline was simply another accumulation and distribution phase of the recently started renewed Bull market. However the Price-action just touched the Weekly chart’s (#1W) #4,052.80 benchmark for the first time since recent upswing which was essentially the start of the parabolic rise. As a result when the #4,100.80 breaks, the next are of my importance is new ATH's level before possible Stabilization zone where Medium and Long-term Sellers will re-appear. If that happens then I will add to my portfolio giving a horizon of #20 - #30 session horizon until Gold hit #4,300.80 benchmark. However it is important to mention that if DX continues the spiral downtrend and Gold re-captures (confirmation by market closing) Resistance zone, Gold can correct #4,100.80 today.
My position: I have placed my Buys on #4,032.80 - #4,042.80 Long-term and my Targets are #4,100.80 - #4,127.80 zones. I maintain my #5,100.80 Long-term Target as these declines are excellent Buying opportunities / fuel for more up.'
My position: I have closed first batch of my Buying orders on #4,102.80 (#3 Buying orders engaged on #4,032.80 - #4,035.80) delivering spectacular Profits and I have Traded the #4,062.80 - #4,082.80 belt throughout yesterday's session (aggressive Scalp orders). As I have mentioned many times throughout my recent comments, I do expect #4,000.80 benchmark to pose as an Ultimate 'floor' and inside yesterday's session strong decline towards #4,000.80 benchmark. I have engaged set of Buying orders on #4,010.80 and closed all the way on #4,052.80 benchmark delivering excellent Profits. Gold holds some Bearish bias however as long as #4,000.80 benchmark is posing as an strong configuration, I will continue Buying Gold.

GOLD Bearish Pennant! Sell!
Hello,Traders!
GOLD bearish pennant has already broken down, confirming displacement and shifting orderflow bearish. Price is now likely to target the next liquidity pocket below. Time Frame 5H.
Sell!
Comment and subscribe to help us grow!
Check out other forecasts below too!
Disclosure: I am part of Trade Nation's Influencer program and receive a monthly fee for using their TradingView charts in my analysis.

Gold sideways, selling pressure returns to 4000⭐️GOLDEN INFORMATION:
Gold (XAU/USD) comes under renewed pressure in Friday’s Asian session, though it continues to trade within its weekly range amid mixed signals. Expectations for a December Fed rate cut have faded further after the delayed September NFP release, supporting the US Dollar’s climb to its strongest level since late May and weighing on the non-yielding metal.
⭐️Personal comments NOVA:
Downward trend, gold price continues to accumulate at the end of the week: 4000 - 4100
⭐️SET UP GOLD PRICE:
🔥SELL GOLD zone: 4144 - 4146 SL 4151
TP1: $4130
TP2: $4120
TP3: $4100
🔥BUY GOLD zone: 4006 - 4004 SL 3999
TP1: $4020
TP2: $4040
TP3: $4060
⭐️Technical analysis:
Based on technical indicators EMA 34, EMA89 and support resistance areas to set up a reasonable SELL order.
⭐️NOTE:
Note: Nova wishes traders to manage their capital well
- take the number of lots that match your capital
- Takeprofit equal to 4-6% of capital account
- Stoplose equal to 2-3% of capital account

Gold Intraday Trading Plan 11/18/2025Yesterday gold did rejected from 4050 and almost touched 4100 but dropped from there to as low as 4008, which is almost touching the channel top. The fact that gold didn't break 4030 is suggesting bull is not over yet. Therefore, I am still looking to buy as long as 4030 holds. It will be interesting to see the close of the next 4hr candle. If it's a green candle, I will buy toward 4150. If not, I will wait and see the daily close for better ideas.

DeGRAM | GOLD is preparing to rebound from the $4k level📊 Technical Analysis
● XAU/USD is holding above the 4,040–4,060 support zone, aligning with the rising trendline that has produced multiple higher lows, indicating sustained buyer defense.
● Price is compressing beneath the descending resistance line; a breakout toward 4,138 and then 4,211 becomes likely once structure lifts above 4,097.
💡 Fundamental Analysis
● Gold is supported by cooling U.S. yields and steady safe-haven demand as global risk sentiment remains fragile.
✨ Summary
Support: 4,040–4,060. Targets: 4,138 → 4,211. Bias remains bullish above rising support.
-------------------
Share your opinion in the comments and support the idea with a like. Thanks for your support!

DeGRAM | GOLD will test the $4000 level📊 Technical Analysis
● The XAU/USD hourly chart shows price failing to break above the descending resistance line, reinforcing a bearish structure.
● Price is now approaching the longterm rising support line near ~4,000; a break below this trendline would open downside toward ~3,930.
💡 Fundamental Analysis
● Gold faces pressure as U.S. Treasury yields climb and real U.S. rates remain elevated, reducing the appeal of zero-yielding bullion.
✨ Summary
Resistance: ~4,110. Support: ~4,000 → ~3,930. Short-term bias: bearish while below resistance and at risk of breakdown below trendline.
-------------------
Share your opinion in the comments and support the idea with a like. Thanks for your support!

Continue to accumulate - gold price moves slowly around 4050⭐️GOLDEN INFORMATION:
Gold (XAU/USD) trades firmer near $4,075 in early Asian hours on Monday, supported by rising expectations of a Fed rate cut following comments from John Williams. Attention now turns to Tuesday’s US September PPI and Retail Sales data.
Williams noted Friday that the Fed could still lower rates soon without derailing progress on inflation. Markets now see nearly a 74% chance of a December cut, up from 40% last week, according to the CME FedWatch Tool. Softer rates would lower the opportunity cost of holding non-yielding gold, offering the metal additional support
⭐️Personal comments NOVA:
Gold price continues to accumulate and move sideways in the range: 4000 - 4100, The market did not have many major changes at the beginning of the week.
⭐️SET UP GOLD PRICE:
🔥SELL GOLD zone: 4143 - 4145 SL 4150
TP1: $4130
TP2: $4120
TP3: $4100
🔥BUY GOLD zone: 4003 - 4001 SL 3996
TP1: $4016
TP2: $4028
TP3: $4040
⭐️Technical analysis:
Based on technical indicators EMA 34, EMA89 and support resistance areas to set up a reasonable SELL order.
⭐️NOTE:
Note: Nova wishes traders to manage their capital well
- take the number of lots that match your capital
- Takeprofit equal to 4-6% of capital account
- Stoplose equal to 2-3% of capital account

Will gold prices fall again after bottoming out and rebounding?Gold Technical Analysis: Gold prices initially fell below 4000 today, but rebounded during the US session. A significant reversal in initial jobless claims data propelled gold to around 4082, reversing the overall downward trend and pushing prices back into range-bound trading. While there were intraday rebounds, gold ultimately met resistance and fell, with higher highs continuing to decline, indicating a clear overall weakness. As I repeatedly emphasized yesterday, gold was poised for a drop, and I stressed the 4100 resistance level. I also repeatedly highlighted the strategy of selling on rallies. The key resistance level to watch is the 4080-4100 range, which was the sideways trading area at the end of yesterday's session.
Currently, the bears still have the upper hand. The short-term effective support is in the 4000-3990 range, while the resistance has been emphasized in the 4080-4100 area. If this area is touched again, another short position can be taken. In short, today's theme is still a weak downward trend with fluctuations. In terms of operation, you can wait for entry based on the above support or resistance levels. The slowdown in the fluctuation pace has extended the market cycle, so every entry requires sufficient patience.

Bullish bounce off?Gold (XAU/USD) has bounced off the pivot which aligns nicely with the 61.8% Fibonacci retracement and could potentially rise to the 1st resistance.
Pivot: 4,043.08
1st Support: 3,973.06
1st Resistance: 4,149.32
Disclaimer:
The opinions given above constitute general market commentary and do not constitute the opinion or advice of IC Markets or any form of personal or investment advice.
Any opinions, news, research, analyses, prices, other information, or links to third-party sites contained on this website are provided on an "as-is" basis, are intended to be informative only, and are not advice, a recommendation, research, a record of our trading prices, an offer of, or solicitation for, a transaction in any financial instrument and thus should not be treated as such. The information provided does not involve any specific investment objectives, financial situation, or needs of any specific person who may receive it. Please be aware that past performance is not a reliable indicator of future performance and/or results. Past performance or forward-looking scenarios based upon the reasonable beliefs of the third-party provider are not a guarantee of future performance. Actual results may differ materially from those anticipated in forward-looking or past performance statements. IC Markets makes no representation or warranty and assumes no liability as to the accuracy or completeness of the information provided, nor any loss arising from any investment based on a recommendation, forecast, or any information supplied by any third party.

Gold Key Levels (3900-4400)These are the Gold key levels ( Support and Resistance Levels) which I’ll be using for trading.
Here’s how I trade these levels:
- Close above a level → Buy setup
When a candle closes clearly above a level, it confirms bullish momentum and I look to enter long immediately after the close.
- Close below a level → Sell setup
A confirmed candle close below support signals bearish strength, and I enter short right after the close.
- Rejection from a level → Opposite trade
If price shows a strong rejection from a level, I trade in the opposite direction - rejection from resistance = sell setup, rejection from support = buy setup.

Gold price analysis November 19Gold is showing a very positive reaction around the large-frame trendline, where buying pressure is quite strong. The break of the key resistance zone 4080 has opened up a new bullish momentum and sent the market straight towards the psychological level of 4100. The bullish structure is more clearly consolidated and the current momentum is targeting the resistance zone 4145 – the upper range of today's trading session.
The previous BUY setups have worked out well, especially the position from 4075 which has given impressive profits. The overall trend remains in favor of the buyers while the important support zones continue to be well defended.
💡 Reference strategy:
Current BUY around 4090
BUY when price rejection signal at support 4080
BUY DCA when price breaks 4103
Target: 4175 – even extend to 4200
Risk: trend invalidated if price breaks trendline and closes candle below 4050

GOLD MARKET ANALYSIS AND COMMENTARY - [Nov 17 - Nov 21]Last week, OANDA:XAUUSD prices rose from $3,999/oz to $4,245/oz, but then fell sharply to $4,032/oz and closed the week at $4,084/oz.
The reason gold prices rose sharply last week after news of the US government reopening was because White House press secretary Karoline Leavitt said the Bureau of Labor Statistics (BLS) may never release October employment and inflation data because the federal government was shut down during this period, not doing statistical work. These comments put the USD under selling pressure, pushing gold prices above $4,200/oz.
However, hawkish comments from Fed officials later pushed gold prices down sharply to $4,032/oz. Specifically, St. Louis Fed Governor Alberto Musalem said that the labor market is expected to remain at near full employment and the Fed needs to be cautious in operating monetary policy at this time. Meanwhile, Minneapolis Fed Governor Neel Kashkari emphasized that inflation is still too high, meaning the Fed should pause interest rate cuts.
The sharp decline in market expectations of a Fed rate cut in December may continue to have a negative impact on gold prices in the short term. However, gold prices will hardly fall sharply as macro risks and geopolitical conflicts persist and central banks’ demand for gold continues to increase.
📌According to technical analysis, the support level for gold prices next week is at 3,930 USD/oz. If it holds above this level, gold prices will continue to hover around 4,000 USD/oz in the short term. However, if gold prices fall below this level next week, they may fall to the 3,800 USD/oz area.
SELL XAUUSD PRICE 4176 - 4174⚡️
↠↠ Stop Loss 4180
BUY XAUUSD PRICE 3949 - 3951⚡️
↠↠ Stop Loss 3945

GOLD: Rate-Cut Odds Hit 74% — Breakout Coming?FX:XAUUSD bounced from the 4043 support zone, maintaining moderate volatility as markets await a packed week of U.S. economic data alongside rising geopolitical uncertainty. Traders remain focused on the 4030–4113 trading range.
The probability of a December Fed rate cut has increased to 74% following comments from New York Fed President John Williams.
On the geopolitical front, any signal of de-escalation in the Russia–Ukraine conflict may trigger corrective pressure on the metal.
Key Events to Watch This Week
~ U.S. PPI & Retail Sales
~ Q3 GDP & Core PCE Index
~ Existing & New Home Sales
Gold remains highly sensitive to Fed communication and geopolitical developments.
Stronger U.S. data could reduce easing expectations, while rising rate-cut odds continue to limit the downside.
A decisive breakout is likely after inflation and GDP figures.
Technical Outlook
Gold maintains bearish momentum while trading below 4087, targeting 4059, and then 4043.
However, price may retest the resistance zone at 4099–4113 before resuming a bearish move.
A 15-minute close above 4087 will support a push toward 4099 → 4113.
Key Levels
Pivot Line: 4087
Support: 4059 · 4043 · 4030
Resistance: 4099 · 4113 · 4133
