all scenario on gold 4hourpersonaly i have sellstop in LAST low, SL like always last high
3 scenario posible , we have 3 angel pattern
let see gold futures daily chart and AC indicator on it,,,,it say= IF LAST LOW NOT BREAK,gold will go up
i will looking for buy near 3740 , dont pick buy now , i am looking for sell now=highest high
i want you win
Trade ideas

Gold – Outperforming During Market UncertaintyThe price of Gold has wobbled at times this week under the pressure of a period of broad-based risk aversion that can at times force traders to unwind popular positions to balance their portfolios, but it hasn’t yet buckled! In fact, after opening on Monday around 4080 and initially selling off with global stock indices and crypto currencies to a low of 3998 early on Tuesday morning, Gold briefly recovered to touch a high of 4132 on Wednesday before moving back down to trade closer to opening levels around 4075 (0630 GMT)
Part of the resilience of Gold could be long term investors and central banks buying the dip as a diversification away from the dollar as their main safe haven asset, but it could also be down to an unstable global growth outlook, with the US and Chinese economies at potential crucial inflection points, concerns about financial risks in the private credit sector, as well as on-going geo-political uncertainty. However, Gold’s resilience may be about to face a sterner challenge of a surging US dollar.
Overnight, while stronger than expected Q3 earnings and sales forecasts from NVIDIA have helped stabilise risk sentiment in the short term, the Federal Reserve minutes of their October rate meeting showed that Fed officials were leaning towards keeping rates unchanged for the rest of the year. As a rule, a lower interest rate environment is supportive of Gold prices as it is a non-interest-bearing asset and vice versa.
Not only that, this hawkish tilt from the Fed minutes has seen the US dollar rally, a move that can also weigh on Gold which is priced in dollars, as it makes it more expensive for foreign investors. Further US dollar strength could be an area of concern moving into the release of the delayed September Non-farm payrolls report later today at 1330 GMT. This data may provide traders with more clarity about how quickly the US labour market is slowing, with an increased potential for greater swings in Gold prices as traders readjust positions for what the data could mean for the prospects of future Federal Reserve policy and the US dollar.
Gold Technical Update: Is This April to July 2025 All Over Again?
Gold hit an all‑time high of 4381 in October, but since then price action has been choppy, with a sharp 11.25% two‑week sell‑off into the recent lows. This kind of consolidation can often follow strong acceleration phases, raising the question of whether the popular metal is now entering a similar corrective pattern to the one seen between April and July 2025, when repeated swings and sideways trading dominated price action.
Between April and July 2025, Gold surged to a high of 3500, before a sharp 11% sell‑off took price down to the 3120 May low. From there, the market shifted into a sideways consolidation phase, unwinding the earlier upside price overextension. This pause allowed the Bollinger mid‑average to ‘catch up’ with price, providing a support base. Once the average was tested, fresh price strength emerged to resume the broader uptrend.
It’s worth stressing that while Gold consolidated between April and July, there’s no certainty the same pattern will repeat now. What history does show is that consolidation phases often act to unwind both upside and downside extremes, and that risk could be present in Gold over the coming days, weeks, or even months, as the market digests the recent volatility.
Possible Shorter Term Support /Resistance Over Payrolls:
While longer‑term risks point to possible consolidation, the short‑term focus in Gold is could be shaped by today’s September Payrolls release. This event could trigger price volatility, making it important to track daily support and resistance levels. Traders may be monitoring how price reacts around these key levels, as they may define the immediate directional bias.
Potential Support Levels:
The latest price weakness from the 4245 November 13th high has so far found support at the daily Bollinger mid‑average, currently at 4042. This level appears to be helping stabilise price activity and even seeing signs of recovery, keeping it as an important short‑term reference point.
With the 4042-level established as the first potential support on Thursday, it may be monitored if weakness develops. A break below 4042 could open scope for further declines toward 3998, the November 18th low, and potentially to 3887, which is the October 28th low.
b]Potential Resistance Levels:
With a rally emerging from the support at 4042, traders could now be monitoring the November 13th high at 4245 as the first resistance. Since selling pressure has recently capped strength at this level, a closing break above 4245 may be needed to suggest further attempts at upside momentum.
A break above 4245 might lead to renewed strength, with the focus then possibly shifting toward the October 20th all‑time high at 4381 as the next key resistance level.
Today’s payrolls release could see increased short‑term price volatility, bringing daily support and resistance levels into focus. However, unless the data provides a clear directional signal, the broader risk backdrop could suggest Gold continues its consolidation, unwinding the recent over‑extended upside conditions further.
The material provided here has not been prepared accordance with legal requirements designed to promote the independence of investment research and as such is considered to be a marketing communication. Whilst it is not subject to any prohibition on dealing ahead of the dissemination of investment research, we will not seek to take any advantage before providing it to our clients.
Pepperstone doesn’t represent that the material provided here is accurate, current or complete, and therefore shouldn’t be relied upon as such. The information, whether from a third party or not, isn’t to be considered as a recommendation; or an offer to buy or sell; or the solicitation of an offer to buy or sell any security, financial product or instrument; or to participate in any particular trading strategy. It does not take into account readers’ financial situation or investment objectives. We advise any readers of this content to seek their own advice. Without the approval of Pepperstone, reproduction or redistribution of this information isn’t permitted.

Gold XAUUSD at Key Support: Watching for a Retrace & BreakoutGold has recently traded down into a major support zone, a level that has historically attracted strong buying interest. 🪙📉➡️📈
If this support continues to hold and bullish momentum resumes, I’ll be monitoring the 30-minute timeframe for a clean pullback into discount pricing. From there, a decisive break in market structure would provide a high-probability opportunity to position long with the trend. 🔍⏳✨
As always, confirmation is key — chasing early entries in consolidation zones can expose traders to unnecessary risk.
🛑 Disclaimer: This is not financial advice. Educational purposes only.

XAUUSD-- Triangle Squeeze Before the Next Major MoveGold is currently consolidating inside a symmetrical triangle, right after a massive bullish rally. This compression pattern typically precedes a strong breakout — and based on market structure, the bullish scenario is more probable.
Bullish Scenario (Primary Outlook)
If price breaks above the triangle resistance and confirms:
Targets (Bullish):
$4,250
$4,380
$4,500 (extended target)
Stop Loss (for long position):
• $3,940
(Below triangle support + below 50-day SMA)
Bearish Scenario (Alternative)
If gold loses triangle support:
Targets (Bearish):
$3,950
$3,880
$3,800 (major support)
Stop Loss (for short position):
• $4,120
(Above triangle resistance)
Summary
Gold is tightening inside a symmetrical triangle and preparing for a decisive move.
Trend bias remains bullish, and a breakout could send XAUUSD toward new highs above $4,400.

Gold - This bullrun is now over!🚨Gold ( TVC:GOLD ) won't create new highs:
🔎Analysis summary:
All the way back in 2019, Gold confirmed its rounding bottom formation. This breakout was then followed by a major rally of about +200% over the past couple of years. But at this moment, Gold is retesting a major resistance trendline and will therefore end its bullrun.
📝Levels to watch:
$4,200
SwingTraderPhil
SwingTrading.Simplified. | Investing.Simplified. | #LONGTERMVISION

Seeing What Price Alone Can’t Show: The Power of Volume ProfileElements of a Volume Profile
The Volume Profile is a powerful charting tool that shows how trading volume is distributed across different price levels.
While normal volume bars appear below the chart showing activity per candle, the Volume Profile appears horizontally on the price scale, showing where most buying and selling took place.
It helps traders understand which price levels attracted the most interest, and where the market might find support or resistance in the future.
Price and Volume Relationship
The core idea of a Volume Profile is that price levels with high volume indicate fair value zones, where both buyers and sellers agree on a price.
On the other hand, low-volume areas indicate rejection zones, where price moved quickly because there was little interest to trade there.
Value Area (VA)
This is one of the most important parts of the profile.
The Value Area represents the range of price where approximately 70% of total trading volume occurred during a selected period.
Value Area High (VAH): The upper boundary of the value area.
→ Above this level, price is considered expensive or overvalued.
Value Area Low (VAL): The lower boundary of the value area.
→ Below this level, price is considered cheap or undervalued.
When price sustains out of the value area, it often indicates that new momentum or trend activity is beginning.
Point of Control (POC)
The POC is the price level with the highest traded volume within the profile.
It represents the price where the market spent the most time and volume. The level often acts as a magnet for future price movements.
Traders watch this level closely as it often becomes a strong support or resistance zone.
High Volume Nodes (HVN)
These are thick areas on the Volume Profile, showing where the market traded heavily (less than POC)
They indicate acceptance zones that is, the price levels where many transactions happened because buyers and sellers agreed on value.
When price returns to an HVN, it often pauses or consolidates before choosing direction again
Low Volume Nodes (LVN)
These are thin or narrow areas on the profile where very little trading occurred.
They mark rejection zones that is, the areas where price moved quickly without much interest.
When price approaches an LVN, it often moves rapidly through it again, because there is less resistance.
Profile Shapes
The overall shape of the Volume Profile also tells a story about market behavior:
D-shaped Profile: Balanced market - fair value established (typical during consolidation).
P-shaped Profile: Short-covering rally - bullish bias
b-shaped Profile: Long liquidation - bearish bias
Double Distribution: Two separate areas of interest - potential trend continuation.
For more on Volume Profile shapes refer
Key Takeaways
The Volume Profile helps traders see where the market traded most heavily at each price level.
Key elements such as the Value Area, POC, High and Low Volume Nodes, and profile shape reveal how the market perceives value and interest.
Understanding these elements helps traders identify strong support/resistance zones, potential breakout areas, and market balance or imbalance situations.
Do you use Volume Profile in your trading? Share your thoughts in the comments below!


Focus on opportunities to buy on dips.My thoughts on today's gold price movement!
From a technical perspective, gold is currently still consolidating at high levels, with the consolidation narrowing. Gold will face a choice in the near future. Looking at the price action, yesterday's US session saw gold prices rebound to a high below 4110 before encountering resistance and trending lower again. This area remains a significant resistance zone, and it's a key resistance level for short sellers to watch. Since the price hasn't broken through this level yet, we should continue to analyze the consolidation, buying low and selling high. The main resistance level is around 4100-4110. Therefore, if gold prices directly retest the 4100-4110 area and a clear bearish pattern forms, short positions can be initiated. However, if the price breaks strongly above this area, it's best to avoid short positions. Conversely, if the price first falls to test the 4040-4120 support level, long positions can be considered.

XAUUSD choppy swing Market is Trapping both buyers & Sellers.
And ranging between structural support and resistance.
What are my conditions For This setup?
- 1st buying area will be 4030-4020 and target will be 4090- 4115 & 4130 in extension.
-Also if H1 -H4 candle closes above 4090 then we'll spike towards 4145 then 4160 in extension
Second if H4 closed below 4020 then market will test 3975-3985 area.


XAUUSD GOLDGold can start a bullish move from the current price toward 4,111. The 3,962 level is a critical zone.

Elliott Wave Analysis XAUUSD – November 20, 2025
1. Momentum
D1:
The D1 momentum is turning upward, suggesting the market may see a mild bullish retracement or continue moving sideways within a narrow range.
H4:
H4 momentum is also preparing to turn upward. This indicates that today we may see a slight bullish push on the H4 chart, or price may continue to move sideways.
H1:
H1 momentum is preparing to turn upward, meaning we may see a small corrective bounce or continued sideways movement.
________________________________________
2. Wave Structure
D1:
Price is currently moving sideways with small candle bodies. Combined with rising momentum, this suggests the market may continue forming a short-range corrective bounce.
H4:
Our main expectation remains a 5-wave structure for wave Y (purple).
Currently, price may be:
• Entering the early phase of wave 3, or
• Still completing wave 2.
👉 A clear confirmation for wave 3 will only come when price breaks below 4001. At that point, we expect price action to turn fast and steep—characteristics of a true wave 3 decline.
H1:
I have temporarily labeled the current structure as a bearish wave sequence since our primary bias is a developing red wave 3.
In this scenario, price may already be in the early part of wave 3.
❗️If price breaks above the green wave 2 high at 4097, this wave count becomes invalid. It would mean the market is still in red wave 2, and I will update the plan if that happens.
________________________________________
3. Trade Plan
Sell Zone: 4093 – 4096
SL: 4016
TP1: 4000
TP2: 3885
TP3: 3746

XAUUSD – Descending Diagonal as Wave (1) of COn the 15m chart, the drop from the recent high is unfolding as a descending leading diagonal, which I am labelling as wave (1) of a larger C wave. Price is respecting the contracting channel with clear 5 overlapping swings, typical of a wave 1 diagonal rather than a clean impulse.
From here I expect a corrective wave (2) to the upside before a stronger sell-off in wave (3) of C:
Potential retracement area for wave (2): 0.5–0.618 of wave (1), roughly the 4,080–4,100 zone.
As long as price stays below the origin of wave (1) (~4,135), the diagonal scenario remains valid. A break above that level invalidates this count.
If the structure plays out, the projected targets for wave (3) of C sit near the 1.272 and 1.618 extensions of wave (1), around 3,990 and 3,950.
Trading plan idea: look for signs of exhaustion / reversal in the 4,080–4,100 area to position short for a potential wave (3) of C, with invalidation above 4,135 and partial profits around the Fibonacci extension levels.
This is an Elliott Wave scenario, not financial advice – manage your own risk and invalidate the count quickly if price action proves it wrong.

Gold rebound presents an opportunity,Why wait and do nothing?Following the release of supplementary US non-farm payroll data for September, the relatively strong job growth coupled with a resurgence in the unemployment rate has once again created a contradictory situation in the market. This has also led to growing disagreement within the Federal Reserve regarding whether to continue cutting interest rates in December. Judging from the recent tone of Fed officials' speeches, most officials lean towards a conservative and cautious approach, believing that maintaining the current interest rate is appropriate. The recent performance of the US dollar index best illustrates this point, putting significant pressure on gold, which has repeatedly weakened. However, there is clear buying interest at lower levels, with each sell-off followed by a rapid rebound, though the momentum has been weak. Intraday, gold retraced to around 4060, quickly rebounded to around 4080, and then fell back again. During the European session, it broke below the key short-term support around 4040, accelerating its decline and briefly touching around 4022. It then fluctuated before gradually stabilizing around 4030. Currently, the US session has seen another rapid rebound, mirroring yesterday's pattern. The recommended strategy is to look for opportunities to short after rallies. The short-term tone is set, and market sentiment is destined to be weak; at least avoid excessive shorting at lower levels.
Gold Trading Strategy: Sell gold in batches around 4080-4100, with a target of 4060-4030.
Excellent Profits on Bottom Buying twiceAs discussed throughout my Friday's session commentary: 'Technical analysis: Gold is showing increasing Selling presence on Weekly (#1W) chart as it is virtually unchanged (the (#1W) candle at # +1.86% currently) as Price-action is on parabolic downtrend within July’s High’s and October Low’s. This has effectively constructed an series of red Daily chart's candles hence the Bearish values on almost all charts which was an ideal Selling opportunity for Short-term Traders however Gold is struggling to stage more serious decline below #4,000.80 benchmark which I mentioned many times as possible 'floor'. Personally I remain on Medium-term Buying set-up as Daily and Weekly chart (#1W) remains heavily Bullish indicating that the latest decline was simply another accumulation and distribution phase of the recently started renewed Bull market. However the Price-action just touched the Weekly chart’s (#1W) #4,052.80 benchmark for the first time since recent upswing which was essentially the start of the parabolic rise. As a result when the #4,100.80 breaks, the next are of my importance is new ATH's level before possible Stabilization zone where Medium and Long-term Sellers will re-appear. If that happens then I will add to my portfolio giving a horizon of #20 - #30 session horizon until Gold hit #4,300.80 benchmark. However it is important to mention that if DX continues the spiral downtrend and Gold re-captures (confirmation by market closing) Resistance zone, Gold can correct #4,100.80 today.
My position: I have placed my Buys on #4,032.80 - #4,042.80 Long-term and my Targets are #4,100.80 - #4,127.80 zones. I maintain my #5,100.80 Long-term Target as these declines are excellent Buying opportunities / fuel for more up.'
My position: I have closed first batch of my Buying orders on #4,102.80 (#3 Buying orders engaged on #4,032.80 - #4,035.80) delivering spectacular Profits and I have Traded the #4,062.80 - #4,082.80 belt throughout yesterday's session (aggressive Scalp orders). As I have mentioned many times throughout my recent comments, I do expect #4,000.80 benchmark to pose as an Ultimate 'floor' and inside yesterday's session strong decline towards #4,000.80 benchmark. I have engaged set of Buying orders on #4,010.80 and closed all the way on #4,052.80 benchmark delivering excellent Profits. Gold holds some Bearish bias however as long as #4,000.80 benchmark is posing as an strong configuration, I will continue Buying Gold.

XAUUSD – Consolidation Before Possible Upside ExtensionGold has been fluctuating within a broad corrective phase, and recent swings suggest buyers may attempt to regain control if the current stabilisation continues. A continuation to the upside becomes a viable scenario should momentum support a renewed push in the coming sessions.
Disclosure: We are part of Trade Nation's Influencer program and receive a monthly fee for using their TradingView charts in our analysis.

Gold Non-Farm Payrolls Plus Government Opening
Gold prices fluctuated between slight gains and minor pullbacks during Thursday's Asian trading session, consolidating around $4080. With the US September non-farm payrolls report due later in the day, the market remained cautious, with investors generally choosing to postpone adding new directional positions.
The likelihood of a Fed rate cut in December has further decreased recently. With a cautious policy stance, the dollar has strengthened and risen to its highest level since May, thus putting significant pressure on gold, which does not generate interest.
However, the data gaps in the US economy caused by the prolonged government shutdown have led to market skepticism about the true economic momentum. Investment institutions pointed out, "Because the data recovery after the shutdown is incomplete, the actual growth momentum may be lower than it appears, therefore, support for gold remains."
Despite the combined effects of multiple factors, gold prices, while under pressure, have not experienced a one-sided decline.
From the 1-hour chart, gold is expected to trade within a range during the daytime session. The key resistance level to watch is 4110, while the key support level is 4030. Technically, a pullback is more likely. We will patiently await the non-farm payroll data tonight and adjust our strategy accordingly. However, we also reserve the possibility that the market might break down prematurely due to market expectations before the non-farm payroll data release.
In the middle positions, observe more and act less, be cautious about chasing orders, and patiently wait for key entry points. I will provide specific operational strategies in the channel, so please pay attention.
Strategy Signals:
Buy: 4105-4110,SL:4120,TP:4050,4030

How to choose a direction at the end of a triangular formation#XAUUSD TVC:GOLD OANDA:XAUUSD
Although gold is still in a volatile market in the short term, its current trend has entered the end of a converging triangle pattern, and the market is getting closer to choosing a direction.
The market has recently been driven primarily by news, and the current geopolitical tensions, coupled with the stalled Russia-Ukraine peace talks, may trigger a new wave of risk aversion. Therefore, during the European session, we can consider going long on gold when it retraces to the 4040-4030 range.

Gold is compressed; next week’s US data will pick a side.Gold is being compressed, the upcoming US data week will decide which side gets squeezed.
Good evening everyone, Brian here with a view on XAUUSD on the H2 and H4 frames for the upcoming week.
Fundamental Analysis – a "tailor-made" week for the USD
Next week is packed with US data, meaning gold will react more to numbers than narratives:
Core PPI, PPI, and Retail Sales
Initial Unemployment Claims
Prelim GDP q/q
Core PCE Price Index m/m – the Fed's preferred inflation gauge
If inflation and growth come out weak, the market will lean more towards the slow growth / easing policy narrative. This usually pressures the USD and supports gold, especially as real yields gradually decline.
Conversely, stronger-than-expected data will strengthen the USD, raise yields, and create short-term downward pressure on gold. In such a context, price and liquidity areas around news releases will be more important than usual – typically, fading emotional spikes back to structural areas is safer than chasing the initial move.
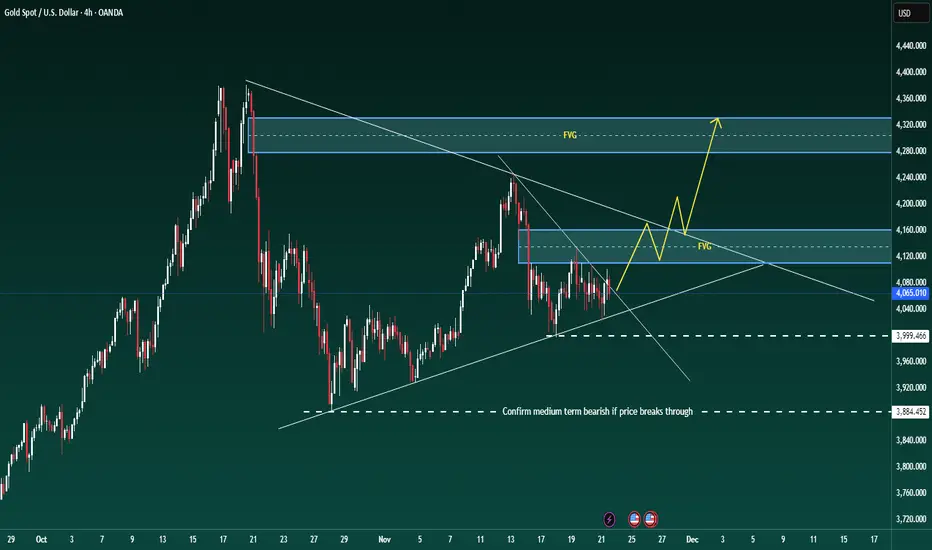
Technical Analysis – triangle, FVG, and key support areas
On the H4 frame, gold is still trading within a broad triangle structure. The previous decline has stalled, with prices continuously reacting at the upward support line and around 4,000, but there has yet to be a clear breakout from the pattern.
When zooming into H1–H2:
The price has broken a short-term downtrend line and closed strongly above – this is an early signal that selling pressure in this move is weakening.
The nearest support is around 4050–4040, deeper is the support band 4000–3998 (marked on the chart as important support). As long as it holds above 4,000, the structure remains positive.
Above, we have a very important confluence area around 4135–4160 including:
Fibo 0.382 of the most recent main decline
An old fair value gap (FVG) and resistance block
Chart note: "Gold will go strong if it passes this price range" – aligns with my view: if the price accepts above this area, the potential for a stronger upward move will open up.
Around 4100 is an area prone to a "large liquidity response" – expect strong profit-taking and position restructuring if the price returns to this area.
Currently, I see the market as accumulating above 4,000 in a corrective pattern, with a slight upward bias as long as 4,000 is maintained.
Key Price Areas
Resistance:
4100 – first liquidity area
4135–4160 – Fibo 0.382 + FVG + strong resistance
Support:
4050–4040 – nearest intraday support
4000–3998 – large frame support; if broken, it will change the picture
3940 area – stronger support if 4k is breached
Trading Scenarios for Next Week
(All are for reference only, not investment advice.)
Scenario 1 – Buy when the price adjusts above 4,000 (foundation for the next upward wave)
Idea: follow the forming upward bias as the price still respects the triangle support and the 4,000 mark.
Entry area: 4050–4040 or any clean retest of the broken downtrend line on smaller frames
Area for cautious position addition: 4025–4005 if there is a deep sweep to 4,000 with a strong rebound reaction
Stop Loss: below 3990–3988 depending on risk appetite
Targets:
First: 4100 (liquidity area)
Second: 4135–4140 (lower edge of FVG/resistance)
Extended: 4155–4160 if a strong continuation move appears
Signals to wait for: wick rejection from support, bullish engulfing candle, or clear intraday structural phase shift to a series of higher highs and lows.
Scenario 2 – Break & Retest Long above 4135–4140
If the price does not give a deep adjustment but runs straight up:
Condition: H2/H4 candle closes clearly above 4135–4140 and holds when retesting
Entry: when the price pulls back in a controlled manner to the 4135–4140 area, turning this area from resistance to support
SL: below 4120
TP: 4180 → 4200+ depending on momentum strength
This is the "gold goes strong" scenario as noted on the chart – viewing the FVG/0.382 area as a launchpad for a larger impulse wave.
Scenario 3 – Bearish scenario if 4,000 is broken
If fundamentals and cash flow turn against gold, decisively pushing the price below 4,000, the bullish view needs to be set aside.
Condition: daily candle closes clearly below 4000–3998
Plan: wait for the price to retrace up to retest 4000–4020 from below
Entry: short when rejection signals appear at that retest area
TP: 3960 → 3940, then reassess the structure
When below 4,000, the triangle will break down, and the market is likely to hunt deeper liquidity areas before potentially forming a new medium-term upward wave.
In summary: as long as 4,000 holds, I prioritize the buy scenario on adjustments, respecting the upward potential to 4135–4160 and beyond. If there is a decisive break below 4,000, the picture will reverse – then retracements up will be opportunities to look for shorts.
Trade according to what the structure shows, not what I hope for. Manage risk tightly around next week's data points and let the major price areas "do the heavy lifting."
If this perspective helps you plan better, don't forget to follow Brian for weekly gold analysis and share your scenarios in the comments to compare.
GoldXAUUSD
- Change of Characteristics
- Bearish Channel as an corrective pattern in Long Time Frame
- Fibonacci Level - 50.00% / 61.80%
- Bullish Channel in Short Time Frame
- Fair Value Gap

GOLD BEARISH BREAKOUT|SHORT|
✅ XAUUSD broke cleanly below the 4H supply after taking buy-side liquidity. With displacement confirming bearish order flow, price is expected to target the sell-side liquidity pool near the marked zone. Time Frame 4H.
LONG🚀
✅Like and subscribe to never miss a new idea!✅

It's not that the market is good.We made the right call.Federal Reserve Governor Robert Waller stated that he supports another rate cut at the December meeting due to growing concerns about a sharp slowdown in the labor market and employment. Waller said, "I'm not worried about accelerating inflation or a significant rise in inflation expectations. My focus is on the labor market. After several months of weakness, the September jobs report later this week or any other data in the coming weeks is unlikely to change my view that another rate cut is necessary." Waller specifically noted that he favors another 25 basis point cut. He stated, "I'm concerned that restrictive monetary policy is putting pressure on the economy, especially its impact on low- and middle-income consumers. A rate cut in December would provide additional protection against a faster weakening of the labor market and move policy in a more neutral direction." At the same time, he indicated that price data suggests tariffs will not have a long-term impact on inflation, and another rate cut would be a risk management approach.
The overall tone was neutral, and gold's technical indicators also showed a downward breakout. The next step is to continue the downward trend with consolidation, and the 4000 level will soon be tested. I will focus on the timing of shorting here. The price is severely oversold in the short term, so aggressive shorting is not advisable. The first resistance level to watch is the 4050-4070 area, followed by the 4100 level. Support lies at 4000-3980; a break below this level could see a further 100 USD drop to the 3900-3880 area. The Bollinger Bands on the daily chart are gradually tightening, awaiting the release of the non-farm payroll data to determine the medium- to long-term direction. Currently, the overall strategy remains to follow the technical trend and sell on rallies. For strategy: short gold in batches at 4050-4070 with a target of 4020-4000 (hold if it breaks through). A second short entry point is at 4095-4100. For a short-term long opportunity, watch the 4000 level (short-term counter-trend long positions should target a 15-20 USD profit).

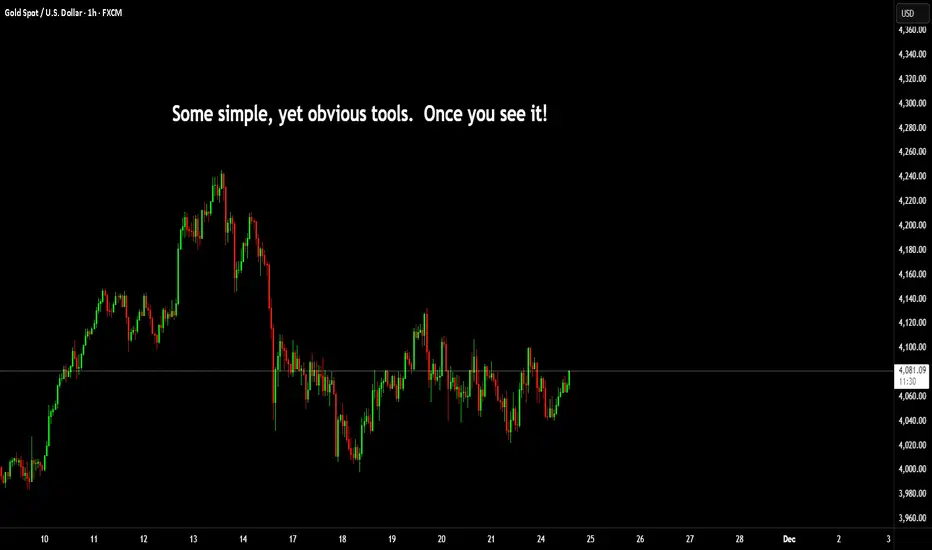
Very useful techniques to learnI have recently posted several posts around mechanical and simple charts. This is another insight into some professional techniques that are not often shown.
Gann talked about High and low candles and opposing ticks.
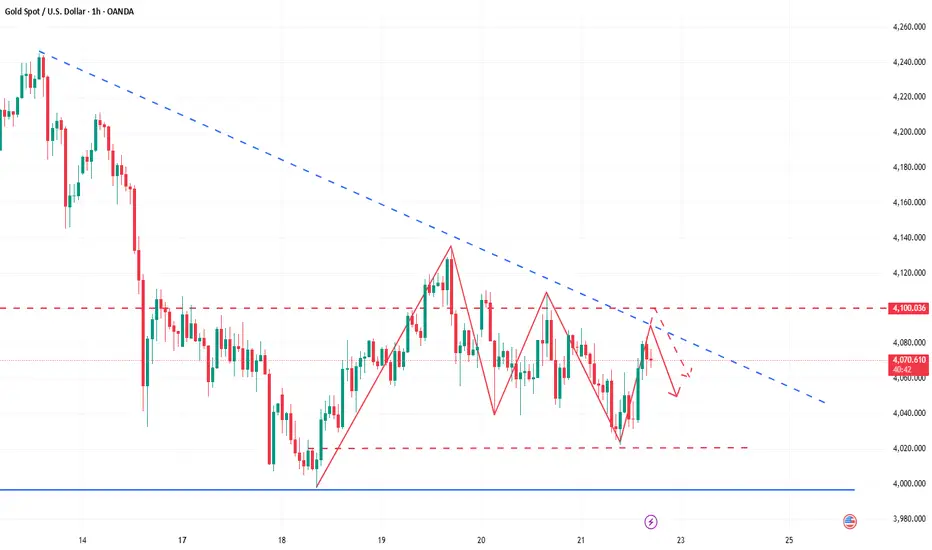
Lowest Tick of the Highest Bar: This refers to the lowest price point (or low tick) of the highest price bar (or highest price period) on the chart. It indicates a crucial support level. If the price falls below this point, it may signal a downward trend or a breakdown.
Highest Tick of the Lowest Bar: Conversely, this refers to the highest price point (or high tick) of the lowest price bar (or lowest price period). This represents a key resistance level. If the price rises above this level, it may indicate an upward trend or a breakout.
Here's an image showing this in an uptrend.
And another for a downtrend.
Then what you would expect from this, would be a move similar to this and of course you can't expect it every time. But to appreciate it, you need to understand the logic as to why this is important in the first instance.
The simple explanation of that is in an uptrend that lowest tick of the highest bar was in fact the exact area buyers failed and sellers took control. Obviously, the inverse is true of a downtrend. The highest point of the lowest candle, means buyers are back pushing prices higher.
Into the future you MIGHT but not always see these levels as support or resistance.
When you overlap this with the mechanical techniques, you can use this for range entries. Here's a post on mechanical techniques.
==========================================
Second tip is to do with volume.
Many people seem to have volume on their chart, but don't really know how to utilise it.
Now, imagine the areas I mentioned in the first tip. As price nears these zones (other other zones) order blocks, supply or demand, fib levels.
If you could quickly identify what story volume is trying to tell you. Then there is a huge benefit to know how you need to react to the price action.
In this image; Look at the spikes in volume until the orange arrow point.
What you can see from this next image, is the orange arrow is the turning point.
For it's next stop after breaking through the PoC of the range from the prior low to its high. You can draw a line, extended from the highest tick of the lowest candle.
Price comes back, and as explained in the example above. Buyers step back in and drive the price directly away from this level.
Now; let's go one step further.
In this image I have the volume profile on the left representing the swing low to high and then the profile on the right from that high to the fresh swing low.
You can see from the sell side pressure where price has interest to both parties.
Next you have both lines drawn on the chart of the opposing candles, like this.
Here. we can look at if the market is seeking outside or inside liquidity.
However, if you look back at the volume on the bottom of the chart. Are we seeing green candles and volume increasing? or red candles with volume increasing? This is where the second tip becomes very, very useful.
If you can identify the phase of internal or external, areas of interest. You can confirm this with volume clues on the chart and you will find yourself on the right side of the trade more often than not.
Have a great week all!
Disclaimer
This idea does not constitute as financial advice. It is for educational purposes only, our principal trader has over 25 years' experience in stocks, ETF's, and Forex. Hence each trade setup might have different hold times, entry or exit conditions, and will vary from the post/idea shared here. You can use the information from this post to make your own trading plan for the instrument discussed. Trading carries a risk; a high percentage of retail traders lose money. Please keep this in mind when entering any trade. Stay safe.