Buy XAUUSDTaking chances with XAUUSD here at 4008. We could see price rise to 3189 judging from this falling channel pattern and resting buy side liquidity
Trade ideas

Gold Recovers, Targeting FVG & Liquidity Zone 4.20x📊 Market Structure
Gold has completed a deep decline from the 4,20x zone and continuously created bearish BoS, indicating sellers controlled the period from 14–18/11.
However, a significant sign appeared when:
Price created an Order Block at 4,008 USD
Then surged to create a Change of Character (ChoCH) on the H1 timeframe
The market maintained higher lows on the intraday structure
This indicates that selling momentum has weakened, and buyers are starting to rebuild a short-term bullish structure.
Currently, the price is approaching the Supply & Resistance zone at 4,086 USD – the zone confirming the strength of the BUY side.
If the price decisively breaks this zone, the next targets are clear:
FVG 4,150 USD
Liquidity Zone 4,202 USD – where old peak liquidity is concentrated
💎 Key Technical Zones
• Order Block: 4,000 – 4,009 USD → the main reversal zone of the current rally
• Supply & Resistance: 4,078 – 4,086 USD → trend confirmation point
• FVG Zone: 4,132 – 4,150 USD → zone where a corrective reaction may occur
• Liquidity Zone $$$: 4,195 – 4,205 USD → target of large capital flows
🎯 Trading Plan – Prioritize BUY according to structure
1️⃣ BUY Setup – Trend Following
Activated when price breaks and retests the 4,086 USD zone:
Entry: 4,086 – 4,090
SL: 4,058
TP1: 4,132
TP2: 4,150
TP3: 4,202
→ This is the highest probability setup: a new uptrend is forming + retesting the invalidated supply zone.
2️⃣ BUY Setup 2 – Deep Retracement (safer)
If the price is rejected at 4,086 and returns to test the lower zone:
Entry: 4,050 – 4,058 (Premium Zone on chart)
SL: 4,028
TP: 4,086 → 4,132 → 4,150
→ This setup offers a higher R:R, suitable for patient traders.
3️⃣ SELL Scalp – For intraday only
If the price hits FVG 4,150 and shows strong rejection signals:
Entry: 4,148–4,150
SL: 4,160
TP: 4,130 → 4,100
→ Not for swing traders. This is merely a technical reaction at the FVG zone.
🧠 Vincent’s View
The main trend of the day leans towards recovery – expanding towards upper liquidity.
As long as the price remains above 4,008 USD, the BUY side will continue to lead the market.
“Follow the structure, follow the liquidity — the market never lies.”


Final session of excellent weekAs discussed throughout this week's commentary: 'As discussed throughout my Friday's session commentary: 'Technical analysis: Gold is showing increasing Selling presence on Weekly (#1W) chart as it is virtually unchanged (the (#1W) candle at # +1.86% currently) as Price-action is on parabolic downtrend within July’s High’s and October Low’s. This has effectively constructed an series of red Daily chart's candles hence the Bearish values on almost all charts which was an ideal Selling opportunity for Short-term Traders however Gold is struggling to stage more serious decline below #4,000.80 benchmark which I mentioned many times as possible 'floor'. Personally I remain on Medium-term Buying set-up as Daily and Weekly chart (#1W) remains heavily Bullish indicating that the latest decline was simply another accumulation and distribution phase of the recently started renewed Bull market. However the Price-action just touched the Weekly chart’s (#1W) #4,052.80 benchmark for the first time since recent upswing which was essentially the start of the parabolic rise. As a result when the #4,100.80 breaks, the next are of my importance is new ATH's level before possible Stabilization zone where Medium and Long-term Sellers will re-appear. If that happens then I will add to my portfolio giving a horizon of #20 - #30 session horizon until Gold hit #4,300.80 benchmark. However it is important to mention that if DX continues the spiral downtrend and Gold re-captures (confirmation by market closing) Resistance zone, Gold can correct #4,100.80 today.
My position: I have placed my Buys on #4,032.80 - #4,042.80 Long-term and my Targets are #4,100.80 - #4,127.80 zones. I maintain my #5,100.80 Long-term Target as these declines are excellent Buying opportunities / fuel for more up.'
My position: I have closed first batch of my Buying orders on #4,102.80 (#3 Buying orders engaged on #4,032.80 - #4,035.80) delivering spectacular Profits and I have Traded the #4,062.80 - #4,082.80 belt throughout yesterday's session (aggressive Scalp orders). As I have mentioned many times throughout my recent comments, I do expect #4,000.80 benchmark to pose as an Ultimate 'floor' and inside yesterday's session strong decline towards #4,000.80 benchmark. I have engaged set of Buying orders on #4,010.80 and closed all the way on #4,052.80 benchmark delivering excellent Profits. Gold holds some Bearish bias however as long as #4,000.80 benchmark is posing as an strong configuration, I will continue Buying Gold.'
My position: Yet another week has gone in spectacular manner as I was continuously waiting Gold to deliver Ultimate Low's and Buy there (did most of my Buys within #4,000.80 - #4,032.80 Ultimate Bottom) as #4,000.80 remains 'floor' as I mentioned many times throughout my remarks. Well done for Traders who followed my calls and are Buying Gold aggressively on each more serious dip, well done! (didn't had time to answer to all). Next week I will provide more Intra-day calls, enjoy the Profits and have a great weekend!

[WEEKLY] ANFIBO | Gold XAUUSD - Purple or Gray? [11.24 - 11.28]Hi guys, Anfibo’s here!
XAUUSD Weekly Trading Plan
Overall Picture:
OANDA:XAUUSD is entering a critical phase as price continues to consolidate within a tightening structure, signaling that a major directional move is likely to occur next week. After a period of strong volatility, the market is now compressing energy between the upper and lower boundaries of the current range. This setup is textbook for a break–retest–continuation model, and that’s exactly why my strategy for the upcoming week revolves around two clear scenarios: the “purple arrow” plan and the “grey arrow” plan.
The market will reveal its next major direction once either the upper boundary is broken or the lower boundary gives way. Until that happens, there is no reason to pre-commit to a biased direction — we trade what price confirms, not what we predict.
Trading Plan for Next Week:
We will react based on breakout confirmation:
>>> Scenario #1: Break ABOVE the range – Follow the “Purple Arrow” plan (BUY)
If gold pushes through the upper boundary with strength and confirms a retest, we will switch to a bullish continuation plan.
Key Resistance Levels to Watch: 4147, 4243, 4340, 4356, 4377.
A clean break above structure opens the path back into macro bullish territory, where gold may attempt to revisit or even surpass recent highs.
>>> Scenario 2: Break BELOW the range – Follow the “Grey Arrow” plan (SELL)
Once price breaks and retests the lower boundary, we will look for sell setups targeting the ladder of support levels outlined below.
Key Support Levels to Watch: 4000, 3917, 3890, 3862, 3820, 3793, 3760
A bearish breakout from the range could trigger a multi-wave continuation pattern, giving us multiple opportunities to scale in according to structure.
Risk Management:
Trade only after confirmed breakouts — avoid guessing tops and bottoms.
Keep tight SLs on retests to avoid liquidity hunts common during range boundaries.
Maintain Risk:Reward ≥ 1:2 across all setups.
Prioritize clean structure; avoid trading inside the choppy middle zone of the range.
Reassess bias immediately if the breakout fails or re-enters the range.
Conclusion:
Next week’s market will be all about patience and reaction, not prediction. With gold coiling tightly, a breakout is imminent, and both the “purple arrow” (bullish) and “grey arrow” (bearish) plans give us a clear and disciplined roadmap. Whether price breaks upward or downward, we already know exactly where our key levels are and how we will execute. Stick to structure, wait for confirmation, and let the market choose the direction for us.
HAVE A POWERFUL NEW WEEK, GUYS!

Gold Trade Plan 21/11/2025Dear traders,
👉 **“The market is still ranging, and the 3960–3970 zone represents a demand area at the bottom of the double trendline. If the price finds support in this zone, it has the potential to rally toward the 4100–4200 region. We will wait for the price to reach this area and observe the price action at the double-line support.”**
Regards,
Alireza!

GOLD / FORECASTGold trading between a clearly defined support zone and an overhead resistance zone. Price is currently pulling back toward the support trendlines, suggesting a potential bullish rebound. If buyers hold this zone, the market may rally toward the highlighted resistance area, where further reaction is expected.”
If the price respect and Growth momentum start we could see a next resistance 4100 to 4150,
"Thank you for your support! If you found this idea valuable or learned something new, please consider liking and leaving a comment. I’d really appreciate hearing your feedback and thoughts.

Gold continues to fluctuate; is it brewing a major move?Gold prices remained range-bound yesterday, reaching our suggested shorting points and support levels. The highest point reached was around 4110, before falling back to around 4040 in the US session before rebounding. The day closed with a bearish doji candlestick, a signal of a potential breakout. A breakout today would likely lead to further continuation of the downward trend. After a quick rebound to around 4088, prices fell again, with key support around the previous low of 4020. This level represents the last line of defense for the bears; a breach here would open up further downside potential, with the next target around 4000. However, this is only the first small target; a further break below this level could lead to a retest of the previous low of 3900.
The overall trend is currently weak and volatile. During the decline or rise, unexpected patterns may emerge. What we need to do now is patiently wait for the price to reach the resistance level or break out of the narrow range before following suit. Avoid blindly chasing highs and lows, as this could lead to losses during the consolidation phase. If gold rebounds to around 4065-4080, consider shorting, targeting 4050-4030. If it breaks through this level during the European session, look for opportunities to short during the US session rebound.

XAUUSD starting a new short-term Bullish LegGold (XAUUSD) is testing today once more its 4H MA50 (blue trend-line). Having held the Higher Lows trend-line two times already since the November 13 pull-back, a second break above the 4H MA50 can technically confirm a quick test of the Lower Highs trend-line of the Triangle. As a result, our short-term Target is 4180 (also just below the 0.618 Fibonacci retracement level).
A closing above the Lower Highs trend-line, potentially means the emergence of a Channel Up (blue), in which case we will re-buy the first 4H pull-back and have a final Target at 4275 (the 0.786 Fib). Long-term we believe Gold is going to have a bearish 2026.
---
** Please LIKE 👍, FOLLOW ✅, SHARE 🙌 and COMMENT ✍ if you enjoy this idea! Also share your ideas and charts in the comments section below! This is best way to keep it relevant, support us, keep the content here free and allow the idea to reach as many people as possible. **
---
💸💸💸💸💸💸
👇 👇 👇 👇 👇 👇

Gold Bull Pennant #3 Forming?Gold has been in a massive rally for 21 months now, sparking in February of 2024 after Austan Goolsbee seemingly dismissed continued high CPI prints, instead focusing on the rate cuts the Fed had started to forecast a year earlier. That's led to a historic run in gold prices and along the way, there's been a clean technical backdrop of higher-highs and higher-lows as a clear bullish bias continued to drive.
There have been two notable periods, however, where that rally took pause, and it seems like we're now in a third.
In the final two months of last year, right around the US Presidential Election, gold formed a symmetrical triangle. This, of course, was after the Fed started to cut rates but there was also a push-higher on inflation expectations, which drove Treasury yields up. Also notable is the fact that Bitcoin came to life in a very big way at the time, spurred along by the election of President Trump and his crypto-friendly campaign. This is when Bitcoin ran up to and beyond 100k for the first time.
That consolidation took two months, and bulls broke out in early-2025 trade as that symmetrical triangle took on the tone of a bull pennant.
The rally then pushed through the first three-and-a-half months of the New Year, with another high setting around Easter at the $3500/oz level.
Again, a symmetrical triangle developed as longs used bounces to take profits and buyers used the pullbacks to add exposure. Normally - a symmetrical triangle carries little to no directional bias, as it's essentially just lower-highs and higher-lows, illustrating consolidation. But when meshed with a prior trend of such strength, a bias can be borrowed; and given that greater profit taking didn't show and, instead, fresh buyers are coming in to bid dips at higher-lows, there's a bullish connotation to the otherwise directionless consolidation.
That second triangle took four months to build - and it finally broke out when Jerome Powell signaled his willingness to cut rates at the Jackson Hole Economic Symposium. After which, once again, gold went parabolic.
Now we have a third period of consolidation and similarly, this aligns with the Fed acting a bit more prudent, refusing to commit to a December rate cut. There's also the opacity around data as the government shutdown in the US has restricted the flow of inflation data that will be key for the Fed's decision making.
At this point, there's little reason to suggest that the big picture bullish trend is over, but one has to imagine that positioning remains heavy to the long side. So, pullbacks or tests of support can remain attractive, but caution must be exercised after rallies as longer-term bulls still holding positions may use those bounces to reduce exposure.
For now, $4k is the major line in the sand. If we get another breach below that, there could be excuse for longer-term bulls to take profits and that can lead to a deeper pullback.
But, for now, it appears as though we have a third bull pennant forming and this one is only about a month old compared to the two months of late 2024 and the four months from the middle of this year. - js

XAUUSD | Bullish Inverse H&S Structure on 30m (Educational Idea)📌 Market Overview
On the 30-minute timeframe, Gold (XAUUSD) has completed a bullish inverse Head & Shoulders pattern (yellow) and successfully reached its projected target.
When expanding the view, a larger inverse H&S structure (green) becomes visible, indicating a broader bullish accumulation phase.
On the right shoulder of the larger pattern, price action is forming a sideways ascending accumulation channel, which typically supports continuation once key resistance levels are breached.
📈 Bullish Scenario (Main Setup)
A clear breakout and sustained closes above 4105 will confirm bullish momentum, potentially triggering a strong upside move toward:
4141
4176
4211 – 4222
Each level requires candle closes above it to confirm continuation to the next target.
📉 Bearish Invalidation
The bullish structure becomes invalid if price breaks below 4038 and holds below it.
A sustained move under 4038 cancels the larger inverse H&S patterns.
🎯 Trade Bias
This analysis highlights a potential long opportunity if breakout conditions are met.
Confirmation through candle closes is essential before entering any long position.
⚠️ Disclaimer
This is my personal technical outlook for educational purposes only.
It is not financial advice. Traders should manage risk according to their own strategy.

Gold Surges, Resuming Bull Market!The bull market is back, and gold prices have risen as expected to above 4100. The opportunity has arrived, and it must be seized. Those who have been following the trend know that after the previous drop to 3888, we advised against excessive bearishness, suggesting a rebound from the lows, targeting 4050. A break above 4050 would trigger a one-sided trend. Although it consolidated for two weeks, Monday's opening saw a direct break above 4050, and the price has now surged to around 4140, a single-day gain of over $100 – this demonstrates the strength of the bulls' counterattack. Undoubtedly, gold is now in a bullish trend, forming a strong one-sided move. Therefore, the next targets for gold are 4186-4250, and a high of 4300.
This week is packed with positive news. The US government resumed its meetings on Monday, potentially ending the shutdown. CPI data will be released on Thursday, and PPI data on Friday. If the US government continues operating normally, the data released on Thursday and Friday will have a significant impact. The current market situation has both a solid foundation and strong intraday performance; it's just missing a data release to influence the market, otherwise the bulls would be even more aggressive. As analyzed on Monday, after gold broke through 4050 this week, we were expecting a one-sided trend, with targets at 4200 and 4300. The trend is now clear; Monday saw a direct break of 4050, a single-day increase of over $100. Having confirmed the one-sided trend, we expect it to continue today. Technically, after the daily chart's bottoming consolidation, the upward movement has broken through the Bollinger Band's middle band resistance. The next target is the upper Bollinger Band at 4300. Whether it breaks through the upper Bollinger Band will depend on the strength of the bulls. Until then, we must maintain our bullish outlook. The 4-hour Bollinger Bands have already widened, indicating the bullish momentum is just beginning. Therefore, there's not much to say; we must maintain a bullish stance and adhere to two principles: go long with the trend, don't try to predict highs, and absolutely avoid shorting. Therefore, the entry point for long positions today is around 4110, which is the support level on the short-term chart. The overall strategy is to buy on dips, targeting 4186, and potentially 4250 with a strong upward move. In summary, Jin Shengfu suggests a short-term trading strategy of buying on dips and selling on rallies. Key resistance levels to watch are 4186-4250, and key support levels are 4110-4115. Please follow the trend closely.
Selling Strategy: Sell gold in batches around 4186-4190, targeting 4160-4150, with a further target of 4130 if it breaks through.
Buying Strategy: Buy gold in batches around 4110-4115, targeting 4150-4190, with a further target of 4250 if it breaks through.

OLD (XAUUSD) – Bearish Correction Setupimeframe: 15M
Market Structure:
Price has broken below the trendline and is now retesting previous demand turned supply. Structure shifting bearish with liquidity targets below
Key Levels
Supply Zone (Short Trigger): 4062–4069
Invalidation/SL: Above 4077
First Target: 4030
Final Target: 4002–4008 liquidity zone
Trade Idea – Short Setup
Price is expected to pull back into the yellow mitigation zone, then reject and continue the downside move.
Entry:
🔻 Sell @ 4062–4069 (Mitigation Zone)
SL: 4077
TP1: 4030
TP2: 4008
TP3: 4002 (Full Target)
Bias:
📉 Bearish until price closes back above 4077
Structure favors downside after liquidity sweep + trendline break + supply retest.
Notes:
This idea is based on liquidity grab + BOS + retest.
Wait for bearish confirmation inside the zone for safer execution.
This is not a financial advice

GOLD Trade Plan 18/11/2025Dear Traders,
👉 **“The market is still ranging between 4000 and 4060. The price will likely drop to the channel bottom around 3950–3970, and from there move up toward the 4180–4200 target.”**
Regards,
Alireza!

XAUUSD - Short-Term Bounce Before the Next Move?Gold has pulled back sharply after completing its latest upward structure. The current drop still looks corrective, not the start of a full bearish reversal. As long as price holds above the lower trendline, we may see a short-term bounce to retest the previous zone before the market decides the next bigger move.
Short-term volatility is expected, but the structure suggests Gold might still push up slightly before any continuation.
Disclosure: We are part of Trade Nation's Influencer program and receive a monthly fee for using their TradingView charts in our analysis

Gold buy NY open buy setup Gold has broken the 200 EMA with a huge FVG .
How to trade it ......
#1 wait for price to hit 4100 ita the closest psychological number
#2 look for pin bar or engulfing candle to close above 4100 with high volume
Note : if price close below the FVG with full bear candle do not jump in the buy wait for price to close back above 4100 and look for the same confirmation above 👆

Gold price continues to fall back to 3933⭐️GOLDEN INFORMATION:
Gold (XAU/USD) extends its slide toward $4,030 in early Asian trading on Tuesday, pressured by fading expectations of a US rate cut next month. Markets now await Thursday’s US September Nonfarm Payrolls report for further direction.
Meanwhile, the US Dollar strengthens for a third straight day, making gold more expensive for foreign buyers. Traders continue to look for clarity on the Fed’s policy outlook after the record-long government shutdown delayed key economic data releases
⭐️Personal comments NOVA:
Continuously breaking support, gold price returns to 3933 below 4000. Selling pressure remains.
⭐️SET UP GOLD PRICE:
🔥SELL GOLD zone: 4108 - 4110 SL 4115
TP1: $4100
TP2: $4090
TP3: $4080
🔥BUY GOLD zone: 3933 - 3931 SL 3926
TP1: $3945
TP2: $3960
TP3: $3970
⭐️Technical analysis:
Based on technical indicators EMA 34, EMA89 and support resistance areas to set up a reasonable SELL order.
⭐️NOTE:
Note: Nova wishes traders to manage their capital well
- take the number of lots that match your capital
- Takeprofit equal to 4-6% of capital account
- Stoplose equal to 2-3% of capital account

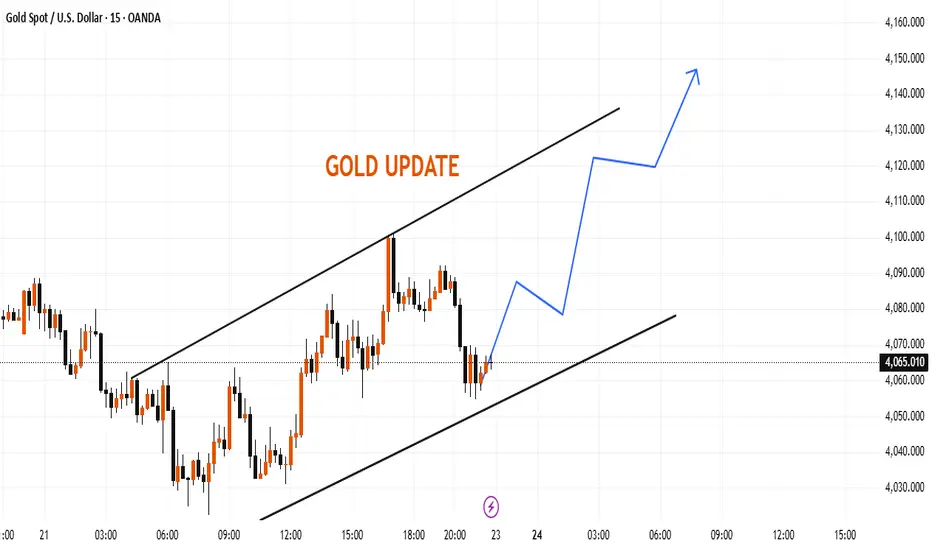
Gold Intraday Channel UpdateGold is currently moving within an ascending channel, with price reacting around the mid-range of the structure. The lower boundary of the channel is acting as a dynamic support zone, while the upper boundary remains the next reaction area to watch.
If price maintains stability above the lower trendline, the structure suggests space toward the upper channel region around the recent intraday highs. The chart highlights how price has been respecting both channel boundaries throughout the session.
This update focuses on the current market structure and key levels visible within the channel.
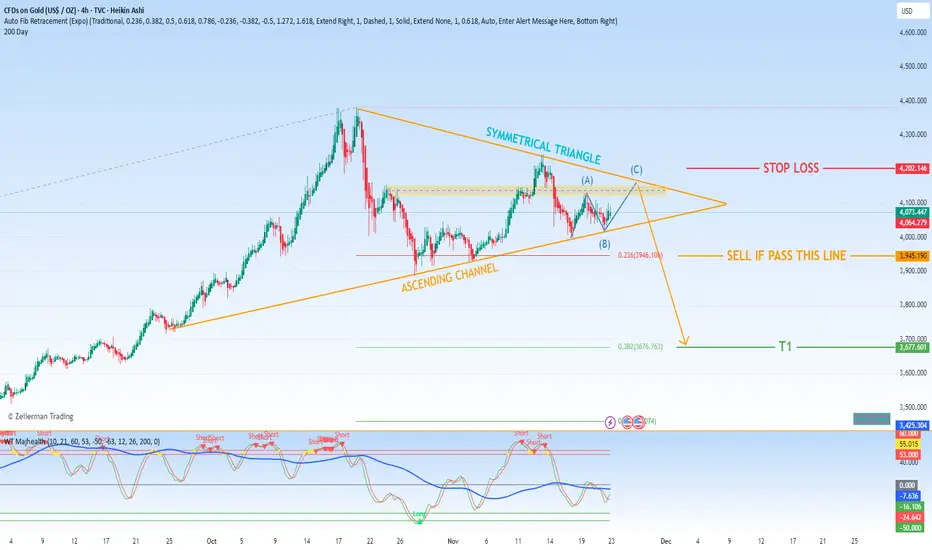
Technical Analysis & Trading Plan for $GOLDThe technical chart for TVC:GOLD is currently exhibiting a compelling and potentially powerful pattern configuration. The primary structure is an ascending channel, characterized by a consistent series of higher lows and higher highs. Contained within this broader channel, the price action has also begun to consolidate into a symmetrical triangle. This triangle is identified by converging trendlines, where the resistance is sloping downward and the support is sloping upward, creating a coil-like formation.
This pattern confluence is significant. The ascending channel provides the underlying bullish bias, while the symmetrical triangle represents a period of consolidation and equilibrium between buyers and sellers. A decisive breakout from this triangle, especially on high volume, typically signals the resumption of the prior trend and can lead to a powerful, directional move.
2. Key Technical Levels and Trade Execution Strategy
Our trading plan is built around the anticipated resolution of this symmetrical triangle.
Stop Loss (Risk Management): A stop loss is placed at 4,200. This level should be positioned logically below a key support structure, such as the lower boundary of the ascending channel or a recent significant swing low. Its purpose is to automatically exit the trade if the price action invalidates the bullish pattern, thus defining and limiting our maximum risk.
Profit-Taking Strategy (Tiered Exit):
Take Profit 1 (TP1): 3,637.763 (0.382 Fibonacci Retracement) - This is our primary profit-taking target. The 0.382 Fibonacci level is a common and respected retracement zone where one can expect some resistance during a pullback. Securing profits here locks in gains and reduces risk for the remainder of the position.
3. The Critical Trigger: Managing a Bearish Move
The analysis includes a specific contingency plan for a bearish outcome. The 0.236 Fibonacci level at 3,946.106 is not a take-profit level but a critical trigger level for action.
If the price declines and closes below 3,946.106, it serves as an early warning signal. This breach suggests that selling pressure is overcoming buying pressure and increases the probability that the price will continue to fall toward our TP1 level at 3,637.76.
Therefore, a break below 3,946.106 is the trigger that validates the sell signal and activates our profit-taking strategy at TP1.
In Summary:
The current setup for TVC:GOLD shows a bullish structure (Ascending Channel) undergoing consolidation (Symmetrical Triangle). Our base case is to wait for a bullish breakout. However, this plan specifically outlines the strategy for a bearish move:
Monitor the 0.236 Fibonacci level at 3,946.106.
If this level is broken, it triggers a sell signal.
Execute the trade with a profit target at the 0.382 Fibonacci level (3,637.76) and a stop loss at 4,200 to manage risk.
This creates a defined, rules-based approach to capitalize on a potential downward move within the broader pattern.
Gold Buyers Regaining Control - Market Poised for UpsideHello Followers, I am going to share you my opinion on gold next move..
Gold continues to show strong bullish structure after holding above the key support zone between 4030 – 4050. This demand area has repeatedly attracted buyers, confirming it as a reliable base for the next upward leg. As long as price remains above this zone, the market bias stays firmly bullish.
A breakout above 4100 activates a high-probability buy setup, signaling renewed momentum from institutional buyers. If price sustains above the entry level, Gold can extend toward the first major resistance around 4170, where buyers may take partial profits. The broader market environment also supports bullish strength, with safe-haven demand increasing and overall market sentiment favoring upside movements. Volatility may rise, but the trend structure remains intact as long as the price does not break below the 4000 stop loss level, which marks the deeper structural support.
KEYPOINTS:
Entry-level 4086
Target level 4170
Support area 4030/4050
Stop loss level 4000

gold buy Idea How to Trade It
1️⃣ Wait for a Pullback
Let price retrace to the 61.8% or 50% Fibonacci levels.
2️⃣ Drop to the 5m Timeframe
On the pullback, look for rejection signs at either the Fib levels or the 200 EMA.
3️⃣ Entry Confirmation
Only enter if you see one of the following with strong volume:
Bullish engulfing candle
Pin bar rejection
These signals show buyers stepping in.
Trade Invalidation
❌ If price closes below the golden Fib levels with a strong bearish candle, cancel the trade.
Alternatively, wait for price to close back above the 200 EMA or the golden Fib levels, then look for the same confirmations again.

Gold (XAUUSD) – 24 Nov | Key Demand Zone 4042–4031 in Focus🟡 Gold (XAUUSD) Analysis – 24 November
Hello Disciplined Traders,
Welcome to the Chart Is Mirror Community 👋
Market Context
• On M15, the major trend remains bearish with Swing High 4107.350 and Swing Low 4022.260 defining the current range.
• However, within this range, the internal structure is forming bullish legs , indicating intraday upside until the major structure shifts again.
• Price is currently trading above the support 4055.129 , attracting retail buyers — but the market may come down to grab sell-side liquidity below this support before resuming its upward momentum.
Key Observations
• Our potential POI for a short-term long setup lies at the 4042.1–4031.2 strong demand zone .
• If the market taps this zone and gives LTF bullish confirmation , we will plan and execute our long setup accordingly.
• If this demand zone fails and price breaks below it, the zone becomes invalid for long setups . In that case, remain still and wait for new structure before participating again.
Execution Plan
• Wait for price to reach the 4042.1–4031.2 demand zone .
• Enter only if LTF confirmation aligns with long continuation.
• No confirmation, no entry — discipline protects precision.
• The market is very volatile — manage position size and risk accordingly .
Let structure invite the trade — not impatience.
📘 Shared by @ChartIsMirror

Gold may continue to decline toward 4020 – 4015 if 4030 breaks.📊 Market Overview:
Gold has fully broken the strong support zone 4045 – 4040 and quickly dropped to 4030, as the US Dollar strengthens and US Treasury yields rise. The market is reacting to recent Fed signals, giving sellers full control.
________________________________________
📉 Technical Analysis:
• Key Resistance: 4045 – 4055
• Stronger Resistance: 4065 – 4075
• Nearest Support: 4030 – 4032
• Stronger Support: 4020 – 4015
• EMA09: Price is below EMA09 on H1 → short-term bearish trend.
• Candlestick / Volume / Momentum: H1 candles form consecutive lower highs; volume rises on large bearish candles → sellers dominate.
________________________________________
📌 Outlook:
• Gold may continue to decline toward 4020 – 4015 if 4030 breaks.
• Conversely, a clear reversal candle around 4030 could trigger a technical rebound toward 4040 – 4045 before resuming the downtrend.
________________________________________
💡 Suggested Trading Strategy:
🔻 SELL XAU/USD : 4045 – 4048
🎯 TP: 40 / 80 / 200 pips
❌ SL: 4053
🔺 BUY XAU/USD : 4015 – 4012
🎯 TP: 30 / 50 / 100 pips
❌ SL: 4008
