Gold (XAUUSD) – 24 Nov | Key Demand Zone 4042–4031 in Focus🟡 Gold (XAUUSD) Analysis – 24 November
Hello Disciplined Traders,
Welcome to the Chart Is Mirror Community 👋
Market Context
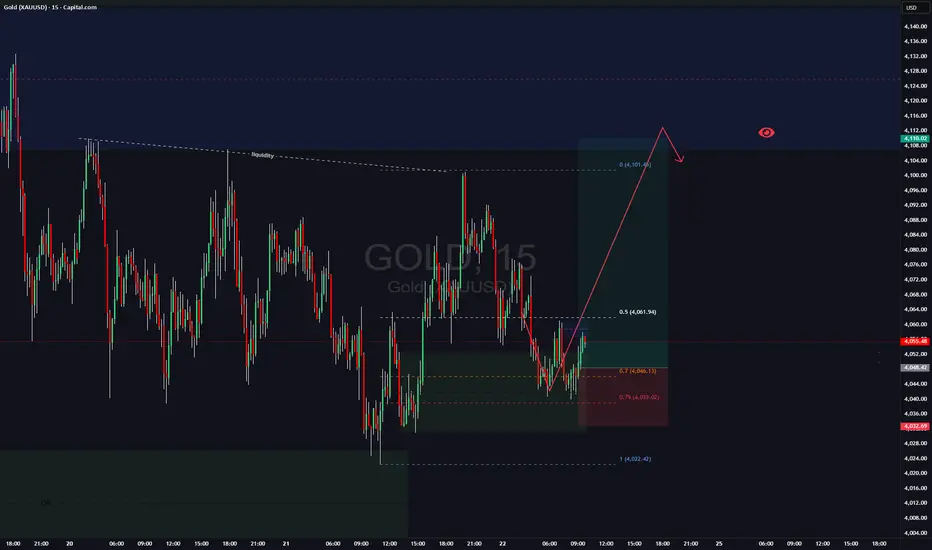
• On M15, the major trend remains bearish with Swing High 4107.350 and Swing Low 4022.260 defining the current range.
• However, within this range, the internal structure is forming bullish legs , indicating intraday upside until the major structure shifts again.
• Price is currently trading above the support 4055.129 , attracting retail buyers — but the market may come down to grab sell-side liquidity below this support before resuming its upward momentum.
Key Observations
• Our potential POI for a short-term long setup lies at the 4042.1–4031.2 strong demand zone .
• If the market taps this zone and gives LTF bullish confirmation , we will plan and execute our long setup accordingly.
• If this demand zone fails and price breaks below it, the zone becomes invalid for long setups . In that case, remain still and wait for new structure before participating again.
Execution Plan
• Wait for price to reach the 4042.1–4031.2 demand zone .
• Enter only if LTF confirmation aligns with long continuation.
• No confirmation, no entry — discipline protects precision.
• The market is very volatile — manage position size and risk accordingly .
Let structure invite the trade — not impatience.
📘 Shared by @ChartIsMirror
Trade ideas

Gold may continue to decline toward 4020 – 4015 if 4030 breaks.📊 Market Overview:
Gold has fully broken the strong support zone 4045 – 4040 and quickly dropped to 4030, as the US Dollar strengthens and US Treasury yields rise. The market is reacting to recent Fed signals, giving sellers full control.
________________________________________
📉 Technical Analysis:
• Key Resistance: 4045 – 4055
• Stronger Resistance: 4065 – 4075
• Nearest Support: 4030 – 4032
• Stronger Support: 4020 – 4015
• EMA09: Price is below EMA09 on H1 → short-term bearish trend.
• Candlestick / Volume / Momentum: H1 candles form consecutive lower highs; volume rises on large bearish candles → sellers dominate.
________________________________________
📌 Outlook:
• Gold may continue to decline toward 4020 – 4015 if 4030 breaks.
• Conversely, a clear reversal candle around 4030 could trigger a technical rebound toward 4040 – 4045 before resuming the downtrend.
________________________________________
💡 Suggested Trading Strategy:
🔻 SELL XAU/USD : 4045 – 4048
🎯 TP: 40 / 80 / 200 pips
❌ SL: 4053
🔺 BUY XAU/USD : 4015 – 4012
🎯 TP: 30 / 50 / 100 pips
❌ SL: 4008

Defensive money returns to GOLD as US labor data worsensOANDA:XAUUSD prices maintained a slight decline in the Asian session, trading around $4,075/ounce as the market turned its attention to the Fed meeting minutes. The upside momentum is weakening, but downside pressure remains limited as money flows continue to seek support from the prospect of easing policy.
New data from ADP reinforces the view that the US labor market is losing momentum. The private sector lost an average of 2,500 jobs a week in the four weeks to November 1, as a host of large companies from Amazon to Target announced plans to cut staff. A report from Challenger showed the number of planned layoffs in October was the highest in more than two decades. Jobless claims rose to 1.9 million, and data from the Cleveland Fed showed 39,000 layoff announcements last month.
These signals are emerging just as the market remains concerned about a weakening U.S. economy, even though expectations for rate cuts are not yet firmly established. Still, sentiment has shifted: the FedWatch tool now shows nearly a 50% probability of a rate cut at the Fed’s December meeting, up from below 40% earlier this week. This development has helped gold rebound after three consecutive losing sessions, especially since the precious metal typically benefits in a low-rate environment.
However, gold’s recovery remains relatively fragile. Prices fell more than 3% on Friday and dropped another 1% on Monday as expectations for Fed easing were revised. This has made the market more sensitive to signals from monetary policy and economic data.
The short-term focus is on the minutes of the late-October FOMC meeting and the upcoming nonfarm payrolls report, both to be released this week. Forecasts suggest U.S. job growth may slow to around 55,000 in September—a pace reflecting cooling hiring demand.
Several Fed officials have struck a more dovish tone. Governor Waller described the labor market as “weak” and noted that core inflation is moving closer to the 2% target. Richmond Fed President Thomas Barkin expects upcoming data to offer more clues on the direction of the economy. These comments, combined with the market’s interpretation of soft labor signals, are creating an environment in which each new data point has the potential to significantly impact gold pricing.
In my view, gold is likely to continue trading within a narrow range as the market awaits clearer confirmation from the Fed while simultaneously assessing the risks of a slowing U.S. economy. Rate-cut expectations remain the key factor supporting gold in the current phase.
Technical analysis and suggestions OANDA:XAUUSD
Recovery Trend and Conditions for a New Uptrend
This morning's developments show that gold prices are trying to recover after a long correction, with a bounce back to the $4,070/ounce area, corresponding to the lower border of the medium-term Ascending Channel.
The price structure has remained within the uptrend channel since August, but the momentum has weakened significantly after the price failed twice before the strong resistance zone of $4,216/ounce (Fib 0.236). The $3,972–$3,990/ounce (Fib 0.382) level continues to act as an important buffer zone, and the fact that the price did not break this zone in the recent decline is a positive signal.
RSI hit the oversold zone and is bouncing up, indicating that selling pressure is weakening and the market is entering a rebalancing phase.
For a new uptrend to form, it is necessary:
Necessary condition: price holds above 3,972 USD/ounce, remaining above the rising trend line of the price channel.
Sufficient condition: close above 4,128 USD/ounce and then confirm above 4,216 USD/ounce, the key resistance zone that determines the return to a strong uptrend.
Only when these two conditions are met, the medium-term uptrend structure will be fully restored.
SELL XAUUSD PRICE 4116 - 4114⚡️
↠↠ Stop Loss 4120
→Take Profit 1 4108
↨
→Take Profit 2 4102
BUY XAUUSD PRICE 4025 - 4027⚡️
↠↠ Stop Loss 4021
→Take Profit 1 4033
↨
→Take Profit 2 4039

Gold - Triangle Squeeze Before the Next Major MoveGold is currently consolidating inside a symmetrical triangle, right after a massive bullish rally. This compression pattern typically precedes a strong breakout — and based on market structure, the bullish scenario is more probable.
Bullish Scenario (Primary Outlook)
If price breaks above the triangle resistance and confirms:
Targets (Bullish):
$4,250
$4,380
$4,500 (extended target)
Stop Loss (for long position):
• $3,940
(Below triangle support + below 50-day SMA)
Bearish Scenario (Alternative)
If gold loses triangle support:
Targets (Bearish):
$3,950
$3,880
$3,800 (major support)
Stop Loss (for short position):
• $4,120
(Above triangle resistance)
Summary
Gold is tightening inside a symmetrical triangle and preparing for a decisive move.
Trend bias remains bullish, and a breakout could send XAUUSD toward new highs above $4,400.

Gold Setup Is TOO CLEAN to Ignore — Bulls in Control!In my view, Gold currently presents one of the cleanest technical structures across the entire market. Ideally, I would like to see a downside manipulation first, followed by a continuation move toward the 4110 area to sweep internal buy-side liquidity. Only after that, a potential retracement toward the 3900 zone becomes reasonable. Any bearish movement that occurs without first taking buy-side liquidity does not align with my plan, and in that case, I will not consider opening any short positions.
Like and follow if you wanna see more analysis like this!

Once again, perfectly capturing gold trading opportunitiesIn yesterday's gold strategy, we emphasized the rebound correction at the 4000 level and the short position at 4080, and the market action has fully materialized! Congratulations to those who followed our advice.Gold is currently dominated by bears, and the overall structure remains weak. Short-term support levels to watch are the 4040-4030 area and strong support around 4000. Resistance remains concentrated in the 4080-4100 area. If the price rebounds to this area and fails to break through, short positions can still be considered. In short, the core logic for today remains unchanged: a weak, downward-trending market. Trading should focus on the aforementioned support and resistance levels, patiently waiting and positioning. The slower pace of the market movement means a longer trading cycle, thus requiring more patience in executing each trade. Until the trend changes, our overall strategy remains to primarily short at higher levels during rebounds, supplemented by buying on dips, proceeding steadily and following the trend.

Accumulated price zone 4100, there is a recovery✍️ NOVA hello everyone, Let's comment on gold price next week from 11/24/2025 - 11/28/2025
⭐️GOLDEN INFORMATION:
Gold (XAU/USD) holds firm in Friday’s North American session after Fed officials signaled the possibility of a December rate cut. The metal trades near $4,096, up 0.53%, after briefly touching $4,101.
Despite mixed US data and shifting rate expectations, XAU/USD has moved sideways for the past three days as traders remain uncertain about its next direction. Recent Fed commentary and the return of key economic releases suggest a steady economy with a strong labor market and persistent inflation pressures
⭐️Personal comments NOVA:
Gold price accumulates around 4100, showing signs of recovery when breaking the short-term downtrend
🔥 Technically:
Based on the resistance and support areas of the gold price according to the H4 frame, NOVA identifies the important key areas as follows:
Resistance: $4133, $4242
Support: $4033, $3982
🔥 NOTE:
Note: Nova wishes traders to manage their capital well
- take the number of lots that match your capital
- Takeprofit equal to 4-6% of capital account
- Stoplose equal to 2-3% of capital account
- The winner is the one who sticks with the market the longest

Xauusd Possible Scenarios (Next 24–48 Hours)1. Market Structure
Gold recently made a strong bullish rally (left side of chart), followed by a sharp correction and is now consolidating in a sideways range.
Current structure shows:
Lower highs forming
Higher lows weakening
Price compressing → triangle / squeeze zone
This indicates indecision and a potential big breakout coming soon.
📈 Bullish Scenario
Gold climbs back above 4106, holds, and breaks the trendline.
Target 1: 4150
Target 2: 4200
Target 3: 4250
Bullish trigger: Break and close above 4120 on 4H.
📉 Bearish Scenario
If price breaks 4000 – 4030 support:
Target 1: 3985
Target 2: 3920
Target 3: 3870
Bearish trigger: Strong 4H candle close below 4025.
For More Updates Stay Tuned

Gold bulls launch a counterattack!
news:
On Wednesday (November 19), spot gold rose modestly for the second consecutive trading day, attempting to extend the previous day's rebound from the psychological level of nearly $4,000 per ounce, and is currently trading around $4,100. Overnight declines in Wall Street stocks indicate that market concerns about the US economy have led to fragile risk sentiment, putting dollar bulls on the defensive.
This, coupled with the ongoing geopolitical risks stemming from the Russia-Ukraine conflict, has become a key factor supporting the rise of the safe-haven precious metal.
technology:
From an hourly perspective, the $4,100 level may become a direct resistance level. If it can be effectively broken, it may trigger short covering and push gold prices to test the intermediate resistance of $4,150-$4,145, and then move towards the $4,200 mark.
Signal:
buy:4075-4080 SL:4065 TP:4140-4175

GOLD Buying Trade idea From the Support LevelHello Traders
In This Chart GOLD HOURLY Forex Forecast By FOREX PLANET
today Gold analysis 👆
🟢This Chart includes_ (GOLD market update)
🟢What is The Next Opportunity on GOLD Market
🟢how to Enter to the Valid Entry With Assurance Profit
This CHART is For Trader's that Want to Improve Their Technical Analysis Skills and Their Trading By Understanding How To Analyze The Market Using Multiple Timeframes and Understanding The Bigger Picture on the Charts

XAU/USD – Inverse H&S Forming, Gold Eyes Bullish Reversal🔍 Market Context
Early today, Gold dropped nearly 70 points, but immediately rebounded strongly from 4040, signaling aggressive BUY interest and a clear rejection of downside continuation.
On the H2 chart, XAU/USD is shaping a clean Inverse Head & Shoulders pattern — a classic reversal structure that often precedes a strong bullish expansion.
The macro layer for today is packed with high-impact catalysts:
📌 Key Data & Events – 20 Nov
Speech by U.S. President Donald Trump
Barkin (2027 FOMC voter) speaks on economic outlook
Federal Reserve FOMC Meeting Minutes
Williams (permanent FOMC voter) speech
U.S. Unemployment Rate
Non-Farm Payrolls (NFP)
Initial Jobless Claims
➡️ A heavy news lineup capable of triggering high volatility and validating (or rejecting) the reversal pattern.
📊 Technical Analysis – MMF View
Gold bounced sharply from BUY ZONE 4044–4046 with strong volume.
The market structure is creating a complete Inverse H&S formation.
The Neckline Zone 4101–4111 is the key breakout level — clearing this zone opens the door for a full bullish reversal.
Trendline compression + liquidity sweeps show buyers gaining control.
Strategy for today: BUY bias. SELL only for quick scalps.
🎯 MMF Daily Trading Plan
BUY (Priority Setup – Swing / Intraday)
Buy 4046–4048
SL: 4039
TP: 4060 → 4085 → 4100 → 4125
✔️ BUY aligns with the reversal pattern + fresh liquidity shift.
SELL (Scalping Only)
Sell 4146–4148
SL: 4154
TP: 4132 → 4120 → 4110
✔️ SELL only if price taps liquidity at upper supply and rejects clearly.
⚠️ Key Levels to Watch
4101 – 4111 – 4142 → liquidity clusters + breakout confirmation
4029 → major support in case volatility spikes from news
🧠 MMFLOW TRADING Outlook
If Gold holds its corrective pullback and breaks above the Neckline (4101–4111), we may see a strong continuation toward:
4146 → 4187 → 4210+
The Inverse H&S on H2 is a powerful bullish setup — smart positioning favors building long exposure and holding into high-impact events.

GOLDDO YOU KNOW WHATS BEHIND THIS OR OTHER IDEAS?? in bio..
Preferably suitable for scalping and accurate as long as you watch carefully the price action with the drawn areas.
With your likes and comments, you give me enough energy to provide the best analysis on an ongoing basis.
And if you needed any analysis that was not on the page, you can ask me with a comment or a personal message.
Enjoy Trading ;)

Gold looking for shortsgold looking good for some more downside in the upcoming days.
4111$ region looks great for some shorts.

Bullish Analysis. (Gold) SL Hit🟦 POST READY TO SHARE
📉 Losing Trade… with the Right Analysis (XAU/USD)
Today I’m sharing a trade that ended in Stop Loss, but delivered a huge lesson.
And yes — I don’t only post winners. Transparency builds real traders.
🔍 What was the idea behind the trade?
• Mitigation of the FVG
• ChoCH at demand
• Reaction at the 5M OB
• Fake Out sweeping liquidity
• BOS confirming bullish intent
• Full institutional sequence:
Liquidity → Mitigation → Rejection → Expansion
🎯 So, what happened?
Price completed:
✔ The liquidity sweep
✔ The mitigation
✔ The rejection
✔ The bullish BOS
✔ The entire push to TP1 and TP2
BUT before taking off…
👉 it swept my SL by just a few pips.
Classic gold manipulation.
🧠 Professional lesson
This wasn’t a bad analysis.
This wasn’t misreading structure.
It was gold doing what gold does — deeper liquidity sweep before expansion.
This doesn’t invalidate my idea.
It validates my vision.
💬 Motivational message
“Great traders aren’t built by wins… they’re built by process.
A losing trade doesn’t lower your level — it sharpens it.
Those who only show wins aren’t growing…
those who show the journey build consistency.”

TOMORROW SELL ENTRY A sell at 4054-60 any moment after market open with sl at 4080 and tp at 4000 or 3970

Gold prices may fall below $4,000 today.Gold prices may fall below $4,000 today.
As shown in the chart: Strong support level: $4,030
Strong resistance level: $4,100
Gold prices may fall below $4,000 today.
Trading strategy: Continue to wait for prices to rise before shorting.
(Aggressive strategy) 1: Short gold as long as the price is below $4,060.
(Conservative strategy) 2: Short gold as long as the price is below $4,100.
Gold prices are currently at the end of a triangle consolidation pattern. A new round of significant price volatility could occur as early as today, or at the latest this week.
This week holds new opportunities, but also comes with huge risks. Wrong actions could have disastrous consequences.
If you don't want to make mistakes, I'm here for you.
Wise decisions can double your money; wrong decisions can wipe you out.
Choose a wise partner.

GOLD Bullish Breakout! Buy!
Hello,Traders!
GOLD broke out of the bullish flag, confirming bullish momentum after absorbing sell-side liquidity. With structure shifting upward, price may extend toward the buy-side liquidity resting at the marked target level.Time Frame 5H.
Sell!
Comment and subscribe to help us grow!
Check out other forecasts below too!
Disclosure: I am part of Trade Nation's Influencer program and receive a monthly fee for using their TradingView charts in my analysis.

If the price consolidates above $4110 then next target $4122I think that if the price stays above $4110 then a next target could be $4122.
Identified levels in yellow are from the Ichimoku reading system.

Nov 18, 2025 - XAUUSD GOLD Analysis and Potential Opportunity📊 Analysis:
The overall momentum remains bearish, and the main plan today is to sell rallies into resistance.
Only if price breaks above 4055 will there be signs of bullish recovery.
If price falls below 4030, bearish momentum is likely to strengthen further.
🔍 Key Levels to Watch:
• 4075 – Resistance
• 4065 – Resistance
• 4058 – Resistance
• 4045–4050 – Resistance zone
• 4030 – Key intraday support
• 4020 – Support
• 4007 – Support
• 4000 – Psychological level / support
📈 Intraday Strategy:
SELL: If price breaks below 4030 → target 4025, with further downside toward 4020, 4015, 4007
BUY: If price holds above 4046 → target 4050, with further upside toward 4055, 4058, 4065

GOLD Bullish Bias!
HI,Traders !
#GOLD is making a bullish
Rebound from the support
Cluster of rising and horizontal
Support levels so as Gold is
Trading in an uptrend we are bullish
Biased and we will be expecting
A further bullish move up !
Comment and subscribe to help us grow !

Bullish Analysis – XAU/USD (15M) SMC🇺🇸 BREAKDOWN
After the market swept all the sell-side liquidity below the previous lows, it became clear that institutions were accumulating longs at discounted prices. Right after that sweep, we got a clean bullish ChoCH, signaling the first shift in intent.
Then price left an FVG unmitigated, and as usual, the market created a manipulative bearish BOS—a classic fake-out designed to induce shorts and grab more liquidity before moving in the real direction. That manipulation brings price directly into the 15M Order Block, which aligns with a clean support area.
My entry is positioned at 4,039, exactly where I expect the institutional reaction:
• 15M OB
• Support zone
• Liquidity sweep
• Clear rejection
From that point, I’m expecting the typical sequence:
fake out → rejection → lower-timeframe confirmation → bullish expansion.
For exits, I’m targeting two key zones:
• TP1 at 4,073 for the first FVG mitigation and liquidity grab.
• TP2 at 4,101, a level with higher-timeframe inefficiencies waiting to be filled.
The setup gives me an R/R of 1:3, totally professional and risk-controlled.
This analysis follows the classic institutional flow:
liquidity → manipulation → return to origin → bullish continuation.
If I get a bullish BOS on 1M or 5M, this becomes an A+ setup.
GOOD LUCK TRADERS 🦾😎🖤

Gold 4H – Liquidity Plays Ahead of Fed Minutes & PMI Data🥇 XAUUSD – Weekly Smart Money Outlook | by Ryan_TitanTrader
📈 Market Context
Gold continues to trade inside a controlled 4H consolidation as markets brace for a highly event-driven week: U.S. PMI releases, updated Fed guidance, and renewed debates over the timing of future rate cuts.
Recent data has shown mixed momentum — softer employment trends but steady business activity — keeping the dollar volatile and gold reactive near mid-range liquidity.
Institutional flows remain cautious, reducing aggressive positioning ahead of major macro catalysts. This environment typically leads to engineered sweeps on both sides of the range as Smart Money hunts liquidity before revealing direction.
Expect short-term volatility spikes, especially around U.S. session opens and PMI releases.
🔎 Technical Analysis (4H / SMC View)
• Price is navigating a minor bearish structure, forming lower highs while protecting deeper liquidity beneath 4020.
• The recent 4H BOS + corrective pullback suggests the market may generate a liquidity grab toward the discount zone before any strong bullish leg develops.
• A Premium Sell Zone at 4225–4227 sits above resting liquidity, making it an ideal region for stop hunts and short-term distribution.
• The Discount Buy Zone at 4010–4008 aligns with structural reaction points, unmitigated demand, and a liquidity shelf — ideal for accumulation.
• Mid-range liquidity around 4060–4080 may be swept before the market chooses a larger weekly direction.
🟢 Buy Zone: 4010–4008
SL: 4000
TP targets: 4085 → 4120 → 4175 → 4220
Rationale:
• Deep discount zone beneath 4H liquidity
• Confluence of demand + structural mitigation
• High probability of engineered sweep before bullish expansion
🔴 Sell Zone: 4225–4227
SL: 4235
TP targets: 4175 → 4120 → 4060 → 4015
Rationale:
• Premium supply above equal-high liquidity
• Favors stop hunt + distribution before correction
• Aligns with previous 4H rejection and imbalance fill
⚠️ Risk Management Notes
• Wait for M15 ChoCH / BOS inside each zone before entering — avoid blind entries.
• Expect spreads and liquidity manipulation around news: US PMI, Fed speeches, and data surprises.
• Avoid trading 10–20 minutes before high-impact events.
• Scale partial profits at each structural target to secure gains and let runners develop.
✅ Summary
Gold remains trapped in a structured 4H range where Smart Money is likely to sweep one side before delivering a decisive expansion.
Discounted buys at 4010–4008 and premium sells at 4225–4227 remain the highest-probability weekly setups.
Stay patient, respect liquidity, and follow confirmation.
🔔 FOLLOW @Ryan_TitanTrader for more weekly SMC setups 🚀
