Gold Bull Pennant #3 Forming?Gold has been in a massive rally for 21 months now, sparking in February of 2024 after Austan Goolsbee seemingly dismissed continued high CPI prints, instead focusing on the rate cuts the Fed had started to forecast a year earlier. That's led to a historic run in gold prices and along the way, there's been a clean technical backdrop of higher-highs and higher-lows as a clear bullish bias continued to drive.
There have been two notable periods, however, where that rally took pause, and it seems like we're now in a third.
In the final two months of last year, right around the US Presidential Election, gold formed a symmetrical triangle. This, of course, was after the Fed started to cut rates but there was also a push-higher on inflation expectations, which drove Treasury yields up. Also notable is the fact that Bitcoin came to life in a very big way at the time, spurred along by the election of President Trump and his crypto-friendly campaign. This is when Bitcoin ran up to and beyond 100k for the first time.
That consolidation took two months, and bulls broke out in early-2025 trade as that symmetrical triangle took on the tone of a bull pennant.
The rally then pushed through the first three-and-a-half months of the New Year, with another high setting around Easter at the $3500/oz level.
Again, a symmetrical triangle developed as longs used bounces to take profits and buyers used the pullbacks to add exposure. Normally - a symmetrical triangle carries little to no directional bias, as it's essentially just lower-highs and higher-lows, illustrating consolidation. But when meshed with a prior trend of such strength, a bias can be borrowed; and given that greater profit taking didn't show and, instead, fresh buyers are coming in to bid dips at higher-lows, there's a bullish connotation to the otherwise directionless consolidation.
That second triangle took four months to build - and it finally broke out when Jerome Powell signaled his willingness to cut rates at the Jackson Hole Economic Symposium. After which, once again, gold went parabolic.
Now we have a third period of consolidation and similarly, this aligns with the Fed acting a bit more prudent, refusing to commit to a December rate cut. There's also the opacity around data as the government shutdown in the US has restricted the flow of inflation data that will be key for the Fed's decision making.
At this point, there's little reason to suggest that the big picture bullish trend is over, but one has to imagine that positioning remains heavy to the long side. So, pullbacks or tests of support can remain attractive, but caution must be exercised after rallies as longer-term bulls still holding positions may use those bounces to reduce exposure.
For now, $4k is the major line in the sand. If we get another breach below that, there could be excuse for longer-term bulls to take profits and that can lead to a deeper pullback.
But, for now, it appears as though we have a third bull pennant forming and this one is only about a month old compared to the two months of late 2024 and the four months from the middle of this year. - js
Trade ideas

XAUUSD | Bullish Inverse H&S Structure on 30m (Educational Idea)📌 Market Overview
On the 30-minute timeframe, Gold (XAUUSD) has completed a bullish inverse Head & Shoulders pattern (yellow) and successfully reached its projected target.
When expanding the view, a larger inverse H&S structure (green) becomes visible, indicating a broader bullish accumulation phase.
On the right shoulder of the larger pattern, price action is forming a sideways ascending accumulation channel, which typically supports continuation once key resistance levels are breached.
📈 Bullish Scenario (Main Setup)
A clear breakout and sustained closes above 4105 will confirm bullish momentum, potentially triggering a strong upside move toward:
4141
4176
4211 – 4222
Each level requires candle closes above it to confirm continuation to the next target.
📉 Bearish Invalidation
The bullish structure becomes invalid if price breaks below 4038 and holds below it.
A sustained move under 4038 cancels the larger inverse H&S patterns.
🎯 Trade Bias
This analysis highlights a potential long opportunity if breakout conditions are met.
Confirmation through candle closes is essential before entering any long position.
⚠️ Disclaimer
This is my personal technical outlook for educational purposes only.
It is not financial advice. Traders should manage risk according to their own strategy.

Gold maintains a bullish market structure overallGold maintains a bullish market structure overall; however, price action suggests it has entered a corrective phase within the current trading range. There is a possibility that price could move lower to test nearby support levels before determining its next direction.
On Friday, gold declined by approximately 3% amid a broad market sell-off triggered by hawkish comments from a U.S. Federal Reserve official, which reduced expectations of a potential interest rate cut in December.
If bulls successfully defend key support and a strong rejection or bullish reversal pattern forms, gold could resume its upward momentum. Should this scenario play out, price may rally and target the 4115 – 4160 zone.
You may find more details in the chart,
Trade wisely best of Luck Buddies.
Ps; Support with like and comments for better analysis Thanks for Support.

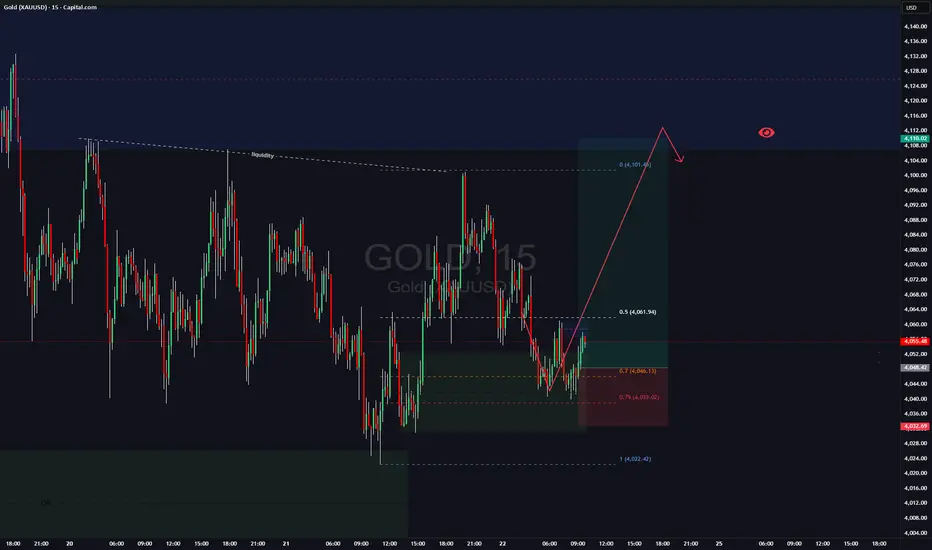
OLD (XAUUSD) – Bearish Correction Setupimeframe: 15M
Market Structure:
Price has broken below the trendline and is now retesting previous demand turned supply. Structure shifting bearish with liquidity targets below
Key Levels
Supply Zone (Short Trigger): 4062–4069
Invalidation/SL: Above 4077
First Target: 4030
Final Target: 4002–4008 liquidity zone
Trade Idea – Short Setup
Price is expected to pull back into the yellow mitigation zone, then reject and continue the downside move.
Entry:
🔻 Sell @ 4062–4069 (Mitigation Zone)
SL: 4077
TP1: 4030
TP2: 4008
TP3: 4002 (Full Target)
Bias:
📉 Bearish until price closes back above 4077
Structure favors downside after liquidity sweep + trendline break + supply retest.
Notes:
This idea is based on liquidity grab + BOS + retest.
Wait for bearish confirmation inside the zone for safer execution.
This is not a financial advice

possible path📊 Gold (XAUUSD) Mid-Term Outlook — Technical Analysis
In this analysis, gold is navigating a corrective phase inside a clearly defined descending channel, following its sharp rally toward all-time highs. Price action suggests a potential continuation of bearish pressure in the short term (red path), with the market likely to revisit the major demand zone highlighted between previous consolidation levels.
This demand area aligns perfectly with the lower boundary of the channel, creating a strong confluence for a possible trend reversal.
Should buyers step in at this zone, gold could break out of the channel and transition into a new bullish structure (green path). A confirmed breakout and retest can open the door for a strong upward leg, with medium-term targets at:
$4,186 — Key structural resistance
$5,000 — Major psychological level and projected long-term target
The projection captures two potential scenarios:
🔻 Short-term bearish continuation toward the demand zone
🔺 Mid-term bullish reversal leading toward record highs
This analysis blends structure, trend channels, and price behavior to outline the most probable paths for gold in the coming months.

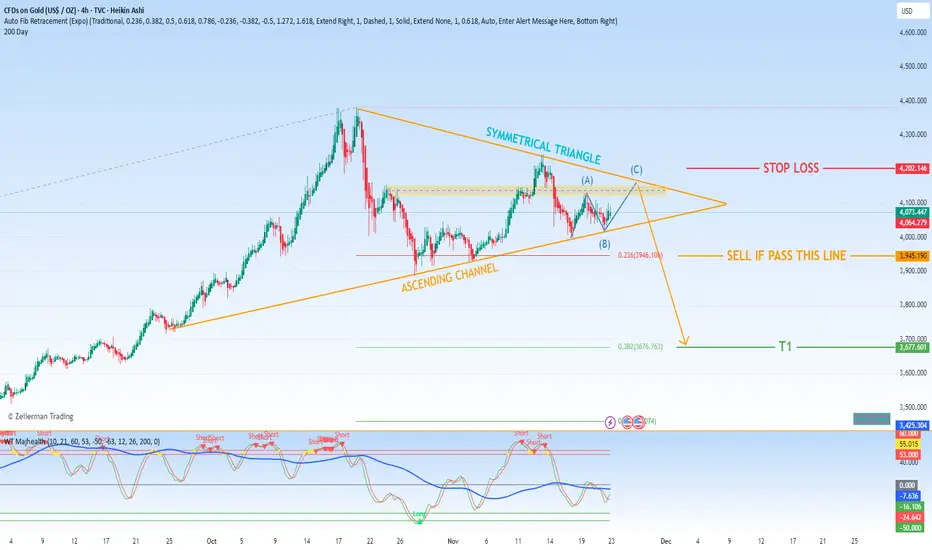
Technical Analysis & Trading Plan for $GOLDThe technical chart for TVC:GOLD is currently exhibiting a compelling and potentially powerful pattern configuration. The primary structure is an ascending channel, characterized by a consistent series of higher lows and higher highs. Contained within this broader channel, the price action has also begun to consolidate into a symmetrical triangle. This triangle is identified by converging trendlines, where the resistance is sloping downward and the support is sloping upward, creating a coil-like formation.
This pattern confluence is significant. The ascending channel provides the underlying bullish bias, while the symmetrical triangle represents a period of consolidation and equilibrium between buyers and sellers. A decisive breakout from this triangle, especially on high volume, typically signals the resumption of the prior trend and can lead to a powerful, directional move.
2. Key Technical Levels and Trade Execution Strategy
Our trading plan is built around the anticipated resolution of this symmetrical triangle.
Stop Loss (Risk Management): A stop loss is placed at 4,200. This level should be positioned logically below a key support structure, such as the lower boundary of the ascending channel or a recent significant swing low. Its purpose is to automatically exit the trade if the price action invalidates the bullish pattern, thus defining and limiting our maximum risk.
Profit-Taking Strategy (Tiered Exit):
Take Profit 1 (TP1): 3,637.763 (0.382 Fibonacci Retracement) - This is our primary profit-taking target. The 0.382 Fibonacci level is a common and respected retracement zone where one can expect some resistance during a pullback. Securing profits here locks in gains and reduces risk for the remainder of the position.
3. The Critical Trigger: Managing a Bearish Move
The analysis includes a specific contingency plan for a bearish outcome. The 0.236 Fibonacci level at 3,946.106 is not a take-profit level but a critical trigger level for action.
If the price declines and closes below 3,946.106, it serves as an early warning signal. This breach suggests that selling pressure is overcoming buying pressure and increases the probability that the price will continue to fall toward our TP1 level at 3,637.76.
Therefore, a break below 3,946.106 is the trigger that validates the sell signal and activates our profit-taking strategy at TP1.
In Summary:
The current setup for TVC:GOLD shows a bullish structure (Ascending Channel) undergoing consolidation (Symmetrical Triangle). Our base case is to wait for a bullish breakout. However, this plan specifically outlines the strategy for a bearish move:
Monitor the 0.236 Fibonacci level at 3,946.106.
If this level is broken, it triggers a sell signal.
Execute the trade with a profit target at the 0.382 Fibonacci level (3,637.76) and a stop loss at 4,200 to manage risk.
This creates a defined, rules-based approach to capitalize on a potential downward move within the broader pattern.
Gold Setup Is TOO CLEAN to Ignore — Bulls in Control!In my view, Gold currently presents one of the cleanest technical structures across the entire market. Ideally, I would like to see a downside manipulation first, followed by a continuation move toward the 4110 area to sweep internal buy-side liquidity. Only after that, a potential retracement toward the 3900 zone becomes reasonable. Any bearish movement that occurs without first taking buy-side liquidity does not align with my plan, and in that case, I will not consider opening any short positions.
Like and follow if you wanna see more analysis like this!
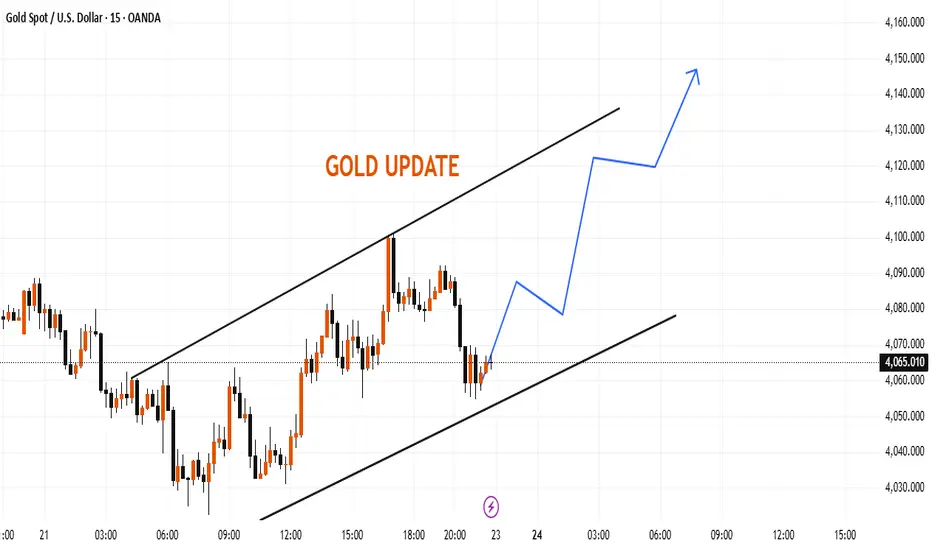
Gold Intraday Channel UpdateGold is currently moving within an ascending channel, with price reacting around the mid-range of the structure. The lower boundary of the channel is acting as a dynamic support zone, while the upper boundary remains the next reaction area to watch.
If price maintains stability above the lower trendline, the structure suggests space toward the upper channel region around the recent intraday highs. The chart highlights how price has been respecting both channel boundaries throughout the session.
This update focuses on the current market structure and key levels visible within the channel.
Gold may continue to decline toward 4020 – 4015 if 4030 breaks.📊 Market Overview:
Gold has fully broken the strong support zone 4045 – 4040 and quickly dropped to 4030, as the US Dollar strengthens and US Treasury yields rise. The market is reacting to recent Fed signals, giving sellers full control.
________________________________________
📉 Technical Analysis:
• Key Resistance: 4045 – 4055
• Stronger Resistance: 4065 – 4075
• Nearest Support: 4030 – 4032
• Stronger Support: 4020 – 4015
• EMA09: Price is below EMA09 on H1 → short-term bearish trend.
• Candlestick / Volume / Momentum: H1 candles form consecutive lower highs; volume rises on large bearish candles → sellers dominate.
________________________________________
📌 Outlook:
• Gold may continue to decline toward 4020 – 4015 if 4030 breaks.
• Conversely, a clear reversal candle around 4030 could trigger a technical rebound toward 4040 – 4045 before resuming the downtrend.
________________________________________
💡 Suggested Trading Strategy:
🔻 SELL XAU/USD : 4045 – 4048
🎯 TP: 40 / 80 / 200 pips
❌ SL: 4053
🔺 BUY XAU/USD : 4015 – 4012
🎯 TP: 30 / 50 / 100 pips
❌ SL: 4008

Gold Buyers Regaining Control - Market Poised for UpsideHello Followers, I am going to share you my opinion on gold next move..
Gold continues to show strong bullish structure after holding above the key support zone between 4030 – 4050. This demand area has repeatedly attracted buyers, confirming it as a reliable base for the next upward leg. As long as price remains above this zone, the market bias stays firmly bullish.
A breakout above 4100 activates a high-probability buy setup, signaling renewed momentum from institutional buyers. If price sustains above the entry level, Gold can extend toward the first major resistance around 4170, where buyers may take partial profits. The broader market environment also supports bullish strength, with safe-haven demand increasing and overall market sentiment favoring upside movements. Volatility may rise, but the trend structure remains intact as long as the price does not break below the 4000 stop loss level, which marks the deeper structural support.
KEYPOINTS:
Entry-level 4086
Target level 4170
Support area 4030/4050
Stop loss level 4000

Gold (XAUUSD) – 24 Nov | Key Demand Zone 4042–4031 in Focus🟡 Gold (XAUUSD) Analysis – 24 November
Hello Disciplined Traders,
Welcome to the Chart Is Mirror Community 👋
Market Context
• On M15, the major trend remains bearish with Swing High 4107.350 and Swing Low 4022.260 defining the current range.
• However, within this range, the internal structure is forming bullish legs , indicating intraday upside until the major structure shifts again.
• Price is currently trading above the support 4055.129 , attracting retail buyers — but the market may come down to grab sell-side liquidity below this support before resuming its upward momentum.
Key Observations
• Our potential POI for a short-term long setup lies at the 4042.1–4031.2 strong demand zone .
• If the market taps this zone and gives LTF bullish confirmation , we will plan and execute our long setup accordingly.
• If this demand zone fails and price breaks below it, the zone becomes invalid for long setups . In that case, remain still and wait for new structure before participating again.
Execution Plan
• Wait for price to reach the 4042.1–4031.2 demand zone .
• Enter only if LTF confirmation aligns with long continuation.
• No confirmation, no entry — discipline protects precision.
• The market is very volatile — manage position size and risk accordingly .
Let structure invite the trade — not impatience.
📘 Shared by @ChartIsMirror

Once again, perfectly capturing gold trading opportunitiesIn yesterday's gold strategy, we emphasized the rebound correction at the 4000 level and the short position at 4080, and the market action has fully materialized! Congratulations to those who followed our advice.Gold is currently dominated by bears, and the overall structure remains weak. Short-term support levels to watch are the 4040-4030 area and strong support around 4000. Resistance remains concentrated in the 4080-4100 area. If the price rebounds to this area and fails to break through, short positions can still be considered. In short, the core logic for today remains unchanged: a weak, downward-trending market. Trading should focus on the aforementioned support and resistance levels, patiently waiting and positioning. The slower pace of the market movement means a longer trading cycle, thus requiring more patience in executing each trade. Until the trend changes, our overall strategy remains to primarily short at higher levels during rebounds, supplemented by buying on dips, proceeding steadily and following the trend.

Defensive money returns to GOLD as US labor data worsensOANDA:XAUUSD prices maintained a slight decline in the Asian session, trading around $4,075/ounce as the market turned its attention to the Fed meeting minutes. The upside momentum is weakening, but downside pressure remains limited as money flows continue to seek support from the prospect of easing policy.
New data from ADP reinforces the view that the US labor market is losing momentum. The private sector lost an average of 2,500 jobs a week in the four weeks to November 1, as a host of large companies from Amazon to Target announced plans to cut staff. A report from Challenger showed the number of planned layoffs in October was the highest in more than two decades. Jobless claims rose to 1.9 million, and data from the Cleveland Fed showed 39,000 layoff announcements last month.
These signals are emerging just as the market remains concerned about a weakening U.S. economy, even though expectations for rate cuts are not yet firmly established. Still, sentiment has shifted: the FedWatch tool now shows nearly a 50% probability of a rate cut at the Fed’s December meeting, up from below 40% earlier this week. This development has helped gold rebound after three consecutive losing sessions, especially since the precious metal typically benefits in a low-rate environment.
However, gold’s recovery remains relatively fragile. Prices fell more than 3% on Friday and dropped another 1% on Monday as expectations for Fed easing were revised. This has made the market more sensitive to signals from monetary policy and economic data.
The short-term focus is on the minutes of the late-October FOMC meeting and the upcoming nonfarm payrolls report, both to be released this week. Forecasts suggest U.S. job growth may slow to around 55,000 in September—a pace reflecting cooling hiring demand.
Several Fed officials have struck a more dovish tone. Governor Waller described the labor market as “weak” and noted that core inflation is moving closer to the 2% target. Richmond Fed President Thomas Barkin expects upcoming data to offer more clues on the direction of the economy. These comments, combined with the market’s interpretation of soft labor signals, are creating an environment in which each new data point has the potential to significantly impact gold pricing.
In my view, gold is likely to continue trading within a narrow range as the market awaits clearer confirmation from the Fed while simultaneously assessing the risks of a slowing U.S. economy. Rate-cut expectations remain the key factor supporting gold in the current phase.
Technical analysis and suggestions OANDA:XAUUSD
Recovery Trend and Conditions for a New Uptrend
This morning's developments show that gold prices are trying to recover after a long correction, with a bounce back to the $4,070/ounce area, corresponding to the lower border of the medium-term Ascending Channel.
The price structure has remained within the uptrend channel since August, but the momentum has weakened significantly after the price failed twice before the strong resistance zone of $4,216/ounce (Fib 0.236). The $3,972–$3,990/ounce (Fib 0.382) level continues to act as an important buffer zone, and the fact that the price did not break this zone in the recent decline is a positive signal.
RSI hit the oversold zone and is bouncing up, indicating that selling pressure is weakening and the market is entering a rebalancing phase.
For a new uptrend to form, it is necessary:
Necessary condition: price holds above 3,972 USD/ounce, remaining above the rising trend line of the price channel.
Sufficient condition: close above 4,128 USD/ounce and then confirm above 4,216 USD/ounce, the key resistance zone that determines the return to a strong uptrend.
Only when these two conditions are met, the medium-term uptrend structure will be fully restored.
SELL XAUUSD PRICE 4116 - 4114⚡️
↠↠ Stop Loss 4120
→Take Profit 1 4108
↨
→Take Profit 2 4102
BUY XAUUSD PRICE 4025 - 4027⚡️
↠↠ Stop Loss 4021
→Take Profit 1 4033
↨
→Take Profit 2 4039

"The Myth of Confirmation - What Retail Gets Wrong Every Day"🔥 THE TRUTH ABOUT MARKET “CONFIRMATION” (What Retail Never Realizes)
Most traders think confirmation comes from indicators, patterns, candle shapes, or repeating formations on lower timeframes.
This is the greatest misunderstanding in trading.
Confirmation does NOT come from the LTF.
Confirmation comes from alignment of the delivery cycle — and the LTF only expresses what the HTF already decided.
Retail thinks the 5M “creates” trend.
Institutions know the 5M merely reflects it.
Here’s the real breakdown institutions use:
⸻
1. Confirmation = Completion of a Phase, Not a Pattern
A market only confirms when a structural phase fully completes, meaning:
• Liquidity objective hit
• Internal structure reset
• Order flow aligned
• Efficient price or imbalance corrected
• Pullback cycle finished
• New impulsive leg prepared
This is confirmation.
Not a candle.
Not an indicator.
Not a shape on your chart.
⸻
2. LTF Structure Means NOTHING Without HTF Context
Retail loves reacting to:
• 5M BOS
• 1M pullback
• 15M FVG
• Candle patterns
• Trend lines
None of these matter if the HTF hasn’t finished its development cycle.
This is why traders lose:
They see “confirmation” while the HTF is still in a build-up, not a release phase.
⸻
3. The Market Confirms Twice — Retail Only Sees One
Institutional traders track two confirmations:
Macro Confirmation (HTF)
This tells the market what it wants to do next
— continuation or pullback.
Micro Confirmation (LTF)
This tells the market when it’s safe to execute
— trend shift + pullback + OB tap + displacement.
Retail only waits for micro confirmation.
They skip macro confirmation.
So they trade inside noise.
⸻
4. Candles Don’t Confirm — the Cycle Confirms
People over-read 5M candles, ignoring the fact that candles are only expressions of liquidity movement.
You can’t read intent from shape.
You read intent from position in the cycle.
The same candle means:
• continuation in one phase
• reversal in another
• manipulation in another
Only the cycle gives it meaning.
⸻
5. The Market Doesn’t Confirm For You — It Confirms ITSELF
This is the coldest truth most will never learn:
Price never confirms your bias.
Price only confirms where it is in the timeline.
If you don’t know the timeline,
you don’t know the confirmation.
TL;DR
(Beginner/Simple)
Confirmation = Cycle Completion + Alignment
NOT a candle pattern or indicator.
You don’t follow confirmation.
You follow timing.
Gold - Triangle Squeeze Before the Next Major MoveGold is currently consolidating inside a symmetrical triangle, right after a massive bullish rally. This compression pattern typically precedes a strong breakout — and based on market structure, the bullish scenario is more probable.
Bullish Scenario (Primary Outlook)
If price breaks above the triangle resistance and confirms:
Targets (Bullish):
$4,250
$4,380
$4,500 (extended target)
Stop Loss (for long position):
• $3,940
(Below triangle support + below 50-day SMA)
Bearish Scenario (Alternative)
If gold loses triangle support:
Targets (Bearish):
$3,950
$3,880
$3,800 (major support)
Stop Loss (for short position):
• $4,120
(Above triangle resistance)
Summary
Gold is tightening inside a symmetrical triangle and preparing for a decisive move.
Trend bias remains bullish, and a breakout could send XAUUSD toward new highs above $4,400.

GOLD Buying Trade idea From the Support LevelHello Traders
In This Chart GOLD HOURLY Forex Forecast By FOREX PLANET
today Gold analysis 👆
🟢This Chart includes_ (GOLD market update)
🟢What is The Next Opportunity on GOLD Market
🟢how to Enter to the Valid Entry With Assurance Profit
This CHART is For Trader's that Want to Improve Their Technical Analysis Skills and Their Trading By Understanding How To Analyze The Market Using Multiple Timeframes and Understanding The Bigger Picture on the Charts

XAUUSD on retracement At moment market is on implusive bullish strike.
-I’m still watching again retracement for a buy trade at 4100-4090 zone and my target remains 4145 then 4174 in extension.
-Secondly if H4-H1 candle closed above 4145 then market will test 4175-4185 without drop.
keep in mind If 4080 break below our setup gets invalid.
Unmute FOREXLAB for 24/7 updates

XAU Selling Model #1Hello everyone, Welcome to the XAU-SYNDICATE...
This is my entry model #1 for selling. so I'll wait for my zone, as soon as the price reaches my zone I'll look for a Liquidity hunt and bearish candle confirmation and plan my trade accordingly. 5-MIN, MSS after liquidity grab is most important part and extra confirmation.
#XAU-SYNDICATE


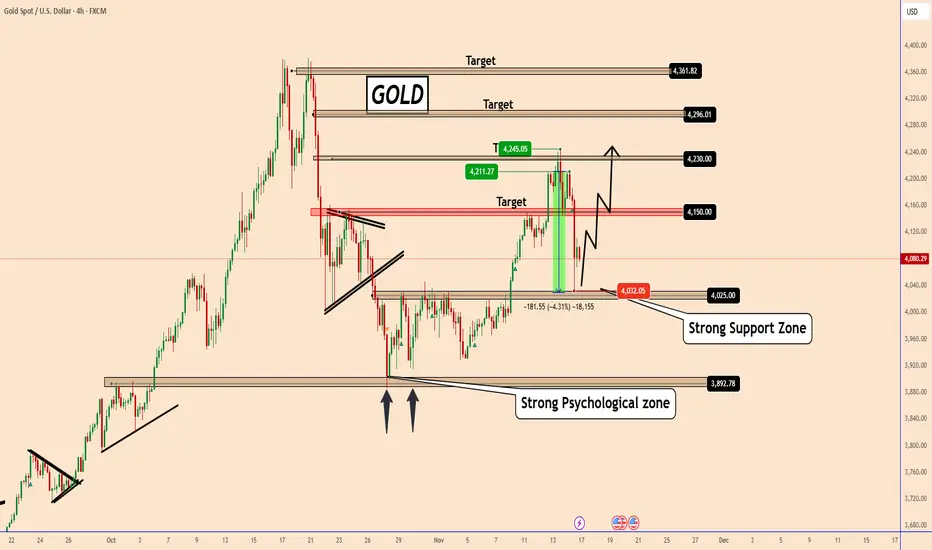
GOLD: Watching The Support Zone for the Next MoveGOLD: Watching The Support Zone for the Next Move
Gold has pulled back sharply after yesterday’s aggressive selloff, but price is now sitting right on a strong support zone.
This area aligns with the previous structure and could act as a launch point if buyers step back in.
If this zone holds, gold may attempt another push toward the 4,150 resistance and potentially break higher into the upper targets.
However, a break below the support could expose the 4,025 level and even the deeper psychological zone near 3,900.
Key Targets :
4,150
4,230
4,296
4,361
You may find more details in the chart!
Thank you and Good Luck!
❤️PS: Please support with a like or comment if you find this analysis useful for your trading day❤️
Xauusd Possible Scenarios (Next 24–48 Hours)1. Market Structure
Gold recently made a strong bullish rally (left side of chart), followed by a sharp correction and is now consolidating in a sideways range.
Current structure shows:
Lower highs forming
Higher lows weakening
Price compressing → triangle / squeeze zone
This indicates indecision and a potential big breakout coming soon.
📈 Bullish Scenario
Gold climbs back above 4106, holds, and breaks the trendline.
Target 1: 4150
Target 2: 4200
Target 3: 4250
Bullish trigger: Break and close above 4120 on 4H.
📉 Bearish Scenario
If price breaks 4000 – 4030 support:
Target 1: 3985
Target 2: 3920
Target 3: 3870
Bearish trigger: Strong 4H candle close below 4025.
For More Updates Stay Tuned

Gold bulls launch a counterattack!
news:
On Wednesday (November 19), spot gold rose modestly for the second consecutive trading day, attempting to extend the previous day's rebound from the psychological level of nearly $4,000 per ounce, and is currently trading around $4,100. Overnight declines in Wall Street stocks indicate that market concerns about the US economy have led to fragile risk sentiment, putting dollar bulls on the defensive.
This, coupled with the ongoing geopolitical risks stemming from the Russia-Ukraine conflict, has become a key factor supporting the rise of the safe-haven precious metal.
technology:
From an hourly perspective, the $4,100 level may become a direct resistance level. If it can be effectively broken, it may trigger short covering and push gold prices to test the intermediate resistance of $4,150-$4,145, and then move towards the $4,200 mark.
Signal:
buy:4075-4080 SL:4065 TP:4140-4175

GOLD at Cut n Reverse Support? Major Bottom? holds or not??#GOLD perfect move as per our last idea regarding gold and now market just near to his current supporting area that is around 4040-50
that is market major supporting area and market holds in morning as well.
keep close that area and keep in mind that is our major and cut n reverse area.
don't be lazy here and stay sharp ..
NOTE: we will go for cut n reverse below 4045 on confirmation.
good luck
trade wisely
