GOLDDO YOU KNOW WHATS BEHIND THIS OR OTHER IDEAS?? in bio..
Preferably suitable for scalping and accurate as long as you watch carefully the price action with the drawn areas.
With your likes and comments, you give me enough energy to provide the best analysis on an ongoing basis.
And if you needed any analysis that was not on the page, you can ask me with a comment or a personal message.
Enjoy Trading ;)
Trade ideas

XAUUSD - Time to buy gold!XAUUSD (GOLD) was recently in a short term downtrend for a few weeks but has now shown some clear bullish movements ahead. XAUUSD (Gold) has broken out of a downward trend channel that was acting as strong resistance, The price is very likely to head to the next strong resistance level which is marked as the take profit zone (green line). Time to buy!

Gold (XAUUSD): 15m timeframe idea, sell setupGold (XAUUSD): 15m timeframe idea, sell setup. I still believe in this trade, even more with the current pattern.
Cheers

XAUUSD – HEAD AND SHOULDERS PATTERN CLEARLY FORMED, CONTINUE ...💛 XAUUSD – HEAD AND SHOULDERS PATTERN CLEARLY FORMED, CONTINUE TO PRIORITIZE BUYING 🎯
🌤 1. Overview – Today's Picture
Hello everyone, it's Lana again 💬
In the Asian session this morning, gold has completed the right shoulder of the inverse Head and Shoulders pattern very clearly on the H3/H4 frame. Those who bought according to the previous scenario are currently in a favorable position, and in my opinion, this is still the time to hold the Buy order and prepare for additional opportunities if the market confirms the trend.
On the macro side, according to the FedWatch CME tool, the probability of the Fed cutting 25bp in December is only about 30–33%, while the likelihood of maintaining the interest rate still prevails. This prevents the USD from falling deeply, but at the same time, it is not strong enough to "suppress" gold – creating a strong fluctuation environment within the range, very suitable for trading according to technical patterns.
💹 2. Technical Analysis – Head and Shoulders Pattern & Price Structure
The inverse Head and Shoulders pattern has formed quite accurately:
Left shoulder → Head → Right shoulder all rest on the long-term upward trendline.
The bottom area around 4040–4050 is a liquidity box supporting the entire structure.
The neckline currently lies around the 4089–4090 area:
When the price breaks up and closes above 4089, we consider it a confirmation of a new upward trend.
After the breakout, gold can expand to the areas 4145 → 4200, where strong liquidity + FVG is concentrated above.
Area 4130–4132:
Is a large liquidity cluster – where short-term profit-taking & Sell orders are likely to appear.
Once this area is decisively broken, the likelihood of the price quickly bouncing to 4200 is quite high.
Area 4040:
Is both the bottom of the pattern and a key support.
The scenario will fail if gold closes the H4 candle below 4040, as the Head and Shoulders structure would be broken.
Overall, the price is compressing right below the neckline, and just a nice break can trigger the next upward wave.
🎯 3. Reference Trading Plan
💖 Main BUY Scenario – according to the pattern
1️⃣ Buy retracement to support
Entry: 4060–4063
SL: 4055
TP: 4088 → 4108 → 4130 → 4143 → 4200
2️⃣ Buy breakout neckline
Condition: Price breaks the downward trendline & neckline, closes above 4089.
Entry: around 4089–4092
SL: 4080
Reference TP: 4132 → 4145 → 4200
💢 Note on SELL
Currently, SELL is only against the pattern trend, not a priority scenario.
Only consider short Sell when:
Price reacts very strongly at 4132–4145,
And there is a clear reversal signal on M15–M30 (pin bar, bearish engulfing, increased selling volume).
⚠️ 4. Key Fundamental Factors to Watch
The probability of the Fed maintaining the interest rate is still high → the market is likely to "freeze" before the news, then explode with volatility.
During this period, gold is often sensitive to data: employment, inflation, Fed officials' speeches.
🌷 In summary, the inverse Head and Shoulders pattern on XAUUSD is supporting the upward scenario, as long as the price remains above 4040 💛
My strategy:
Prioritize Buy, first in the 4060–4063 area, then break 4089,
Closely monitor the 4132–4145 area – if broken, the opportunity to reach 4200 is very clear.
If you find the analysis useful, please 💛 Like – 💬 Comment – 🔔 Follow LanaM2 to update the gold perspective with me every day ✨

XAU/USD: Bearish Reaction Builds Below 4,130 ResistanceXAU/USD is approaching the edge of the resistance zone after a rebound from the $4,000 support area. Price remains within a wider consolidation, reacting to both the downward trendline and mid-range resistance.
If the market stays capped below 4,130, a drop toward 4,045 is likely as sellers regain short-term control. The overall pattern suggests a compressing structure, where bearish reactions within resistance zones continue to dominate.
❗️ Risks:
– Breakout above 4,130 could target 4,245, invalidating the bearish case.
– FOMC or macro news could push gold sharply higher.
– Failure to hold below mid-range may cause sideways drift instead of a clean drop.

Bearish reversal off 61.8% FIbonacci resistance?Gold (XAU/USD) is reacting off the pivot, which is a pullback support that aligns with the 61.8% Fibonacci retracement and could reverse to the 1st support.
Pivot: 4,147.61
1st Support: 4,093.63
1st Resistance: 4,219.46
Disclaimer:
The opinions given above constitute general market commentary and do not constitute the opinion or advice of IC Markets or any form of personal or investment advice.
Any opinions, news, research, analyses, prices, other information, or links to third-party sites contained on this website are provided on an "as-is" basis, are intended to be informative only, and are not advice, a recommendation, research, a record of our trading prices, an offer of, or solicitation for, a transaction in any financial instrument and thus should not be treated as such. The information provided does not involve any specific investment objectives, financial situation, or needs of any specific person who may receive it. Please be aware that past performance is not a reliable indicator of future performance and/or results. Past performance or forward-looking scenarios based upon the reasonable beliefs of the third-party provider are not a guarantee of future performance. Actual results may differ materially from those anticipated in forward-looking or past performance statements. IC Markets makes no representation or warranty and assumes no liability as to the accuracy or completeness of the information provided, nor any loss arising from any investment based on a recommendation, forecast, or any information supplied by any third party.

Elliott Wave Analysis XAUUSD – 25/11/20251. Momentum
D1
D1 momentum has entered the overbought zone and is showing early signs of reversal. This indicates the current bullish leg is weakening. Today or tomorrow, if a strong bearish D1 candle appears, it will likely confirm the reversal.
H4
H4 momentum is also in the overbought zone, with the lines sticking tightly together — a typical sign that a reversal could happen at any moment. Once we see a bearish H4 candle close, we can consider the current high as a potential top.
H1
H1 momentum is currently in the oversold zone and preparing to turn upward. This means price may still show one more short-term bullish correction or move sideways before any meaningful decline.
________________________________________
2. Wave Structure
D1
Yesterday’s bullish daily candle did not change the D1 wave count. We are still in the Y wave (purple).
However, one critical point needs attention:
• D1 momentum is already overbought.
• When D1 momentum rolls over, what we want to see is:
o Price failing to break the current X-wave high, and
o A strong, sharp decline to complete wave Y.
If price does not decline sharply as expected, the market may shift into a more complex corrective structure — such as a triangle or a larger WXY formation. I will update the count if that scenario develops.
________________________________________
H4
Yesterday’s bullish move broke above the previous wave (2) high. This invalidates the 5-wave scenario and confirms that the structure is instead forming a 3-wave corrective pattern.
With H4 momentum turning down and D1 momentum already overbought, the current price region is highly likely to be the top of wave 2.
________________________________________
H1
A clear 3-wave ABC corrective pattern has completed.
Wave C (blue) now reaches the target area around 4158, making this a very attractive region to look for Sell entries.
However, keep in mind:
• H1 momentum is in the oversold zone and preparing to turn upward.
• This suggests price may still push slightly higher or move sideways before H1 reaches the overbought zone.
The best Sell timing will be when H1 and H4 momentum align together in overbought zones.
________________________________________
3. Key Liquidity Zones
Two important liquidity areas lie ahead:
• 4143
• 4184
If price holds above 4143, the probability of reaching 4184 increases — especially with H1 momentum turning upward.
Because H1 momentum is about to rise, it is difficult to find a precise Sell entry at 4143–4158–4184 without waiting for a clear price reaction.
The safest approach is to wait for bearish confirmation signals at each zone.
For my personal plan:
• First attempt to catch the top with a small position at 4158.
• Second attempt at 4184 if price extends further.
________________________________________
4. Trade Plan
📌 Sell Zone 1
• 4156 – 4158
• SL: 4168
• TP1: 4123
• TP2: 4081
• TP3: 4020
📌 Sell Zone 2
• 4184 – 4185
• SL: 4205
• TP1: 4123
• TP2: 4081
• TP3: 4020

XAUUSD SELL MOMENTUM BUILDS AS MARKET EYES 4031Gold is maintaining a controlled downside trajectory as the market continues to reject the upper resistance zone near 4100. The current structure reflects a strong bearish continuation pattern, supported by lower highs and consistent selling pressure from institutional levels.
Momentum indicators remain aligned with the downside, and the lack of bullish follow-through suggests that buyers are unable to reclaim any key levels. Unless price breaks decisively above 4100, the bearish sentiment is expected to remain intact.
With this momentum, XAUUSD is positioned to extend its decline toward the 4031 target, which stands as the next major liquidity zone where reactions may occur.
Market Bias: Strongly Bearish
Resistance to Watch: 4100
Downside Target: 4031
KEY POINTS
RESISTANCE 4098
SUPPORT INTRADAY 4049
TARGET 4031
FOLLOW ME FOR MORE LATEST UPDATES AND SIGNALS

Economic growth concerns may be overstated.Gold Technical Analysis: Last week, gold traded in a range. Monday saw a decline, Tuesday saw a dip to a weekly low near 3998 before rebounding to a positive close, Wednesday saw a rise followed by a fall, resulting in a small-bodied positive candle with a long upper shadow, and Thursday and Friday saw doji candles. The weekly chart ultimately closed with a small negative candle with upper and lower shadows, indicating continued short-term consolidation. Looking at the intraday chart, Friday saw another doji, reaching a high near 4101. The previous high of 4110 was not broken, and after a quick rise, the price returned to around 4050, clearly showing a tug-of-war between bulls and bears. This week, the market has been relatively quiet, with no major data releases. Given the limited movement in gold last week, consistently trading in a range from relatively low to high levels, a clear trend is not yet emerging.
Since the daily chart showed a pullback from around 4132, each subsequent decline has been followed by a rebound after testing the bottom. Therefore, this is a strong rebound, not a reversal. However, without a major positive catalyst, the previous resistance level of 4110 will be difficult to overcome. The rebound last Friday, followed by another surge driven by news, has likely extended the adjustment period. Today, Monday, there are no major news catalysts, and the consolidation and fluctuations at the weekly and weekly levels are not yet over. Therefore, the trading strategy for gold today remains range-bound, continuing the 4000-4130 range. The trading strategy is to maintain a short-selling approach, paying close attention to key levels. For now, gold is unlikely to experience significant price movements; a market stimulus is needed to break out with strong directional momentum. In summary, the recommended trading strategy for gold today is primarily to sell on rallies, with buying on dips as a secondary approach. The key resistance level to watch in the short term is 4100-4130, and the key support level is 4030-4000. Please follow the trend closely.

Elliot wave..!Elliot wave shows us the direction of the market..! we are completing the last wave, which is Z
then we go up..!!!

Gold at Make-or-Break Level – High-Probability Short Setup LoadiGold is still trading inside a corrective structure after forming a clear lower low and then consolidating. Price has tapped the mid range zone and is now reacting from a short term supply area. As long as gold stays below 4130–4145 the bearish structure remains intact and the downside continuation toward 4025 → 4000 → 3950 remains the primary expectation. A short setup becomes active once price gives rejection or a small BOS from the current supply zone. The trade becomes invalid if gold breaks and closes above 4150 which would shift structure and open the way for a deeper pullback toward 4175–4200.
Sell Zone : 4130 - 4145
Invalidation : Break & close above 4150
Targets: 4075 → 4025 → 4000 → 3950
Note
Please risk management in trading is a Key so use your money accordingly. If you like the idea then please like and boost. Thank you and Good Luck!

Gold bulls launch a strong counterattack!After a prolonged period of narrow-range fluctuations, gold reached a high of around 4120 before pulling back. Currently, the overall structure remains bullish. Market conditions are constantly changing, and stubbornness is the worst thing in trading. Neither die-hard bulls nor die-hard bears can last in the face of the market. We should follow the trend; this is the fundamental logic of professional trading. Don't fight the market; just follow the trend. Currently, the bulls still hold the initiative in gold. Short-term pullbacks are more about consolidation than a trend reversal. As long as the upward momentum continues, pullbacks are opportunities, not risks. The key focus going forward is the pullback performance in the 4090-4070 area. As long as it holds, this area remains a good place to buy on dips. The market always punishes those who defy it. Hitting a wall is a lesson; understanding the direction is growth. Following the trend is the easiest and most stable way to trade. Continue to follow the rhythm; opportunities are for those who choose the right direction.

Gold trading settings!Internal falling wedge created. Manage your risk properly!
ENTRY: 4090
TP1: 4180
TP2: 4200
SL: 4027

XAUUSD – Liquidity-Driven Long Setup (Smart Money Narrative)📖 Market Story (What’s Really Happening)
Gold is not “ just bullish ” — it’s being engineered higher through liquidity.
Price has been forming a series of higher lows, which tells us one thing:
Institutions are protecting downside and accumulating long positions gradually.
Recently, price retraced back into a discount zone where:
Previous demand was formed
Trendline support aligned
And liquidity from late sellers started to build below recent lows
This tells us the market is setting a liquidity trap.
Retail traders are selling this pullback thinking the trend is over.
Smart money waits — and then uses their stop-losses as fuel to push price higher.
Now price is reacting from this high-probability demand area and showing early signs of bullish intent.
This is not about guessing direction — it’s about understanding where liquidity is resting and who is about to get trapped.
📈 Trade Plan (Sniper Execution Model)
✅ Entry (Buy Setup)
Buy Zone: 4050 – 4065
Only valid if:
Price sweeps sell-side liquidity
And shows strong bullish displacement
🛑 Stop Loss
SL: 4025
Placed below structural low.
If this level breaks — bullish narrative is invalid.
🎯 Targets
TP1: 4145
(Partial close – secure profits & move stop to breakeven)
TP2: 4220
(Main liquidity target and expense of trapped sellers)
⚖️ Risk Management
Risk per trade: 1% only
This is a precision trade, not a gamble.
🧩 Confluence Summary
What gives this setup edge:
✅ Higher timeframe bullish structure
✅ Liquidity resting below recent lows
✅ Demand zone + trendline compression
✅ Smart money narrative aligned
🧾 Final Thought
This trade is not about predicting gold.
It’s about positioning before the liquidity expansion happens.
Now we wait for price to deliver.
This is not a financial advice

Gold prices are facing resistance in the $4135-$4120 range.Gold prices are facing resistance in the $4135-$4120 range.
Trading Strategy: Treat this as a range-bound market.
Intraday Trading: The most cost-effective strategy is to short.
Sell Price: $4110-$4115
Stop Loss: $4136
Take Profit: $4050-$4020
(See Figure 2h)
Gold is currently in a macro triangular oscillation cycle and is expected to consolidate within a specific structure next week.
A new round of significant price volatility is not expected until December.

Gold Intraday Trading Plan 11/21/2025Yesterday gold didn't go up as expected it was hovering around 4050-4100. In lower TF, it's not making any decisive moves. Therefore, I will look for breakout today. If 4100 is broken, I will buy toward 4150. If 4050 is broken, I will sell towards 4000. However, I do see the downward momentum is getting stronger. Let's see what the market will present us.

XAU/USD Bullish Structure Retest Offering Strategic Swing Entry🏆 XAU/USD GOLD SWING TRADE OPPORTUNITY 💰
Bullish Pullback Setup | LSMA Moving Average Confirmation
📊 TRADE PLAN OVERVIEW
Asset: XAU/USD (Gold vs US Dollar) | METALS Market
Timeframe: Swing Trade (4H-Daily Bias)
Setup Type: Bullish Continuation on Pullback
Confirmation Indicator: LSMA Moving Average
🎯 ENTRY STRATEGY
Method: Layer Entry Using Multiple Buy Limit Orders (Recommended)
Entry Zones:
Primary Entry: 4010.00 - 4020.00 (First layer - 40% position)
Secondary Entry: 3990.00 - 4000.00 (Second layer - 35% position)
Confirmation: Wait for LSMA to show bullish crossover + price rejection from support level
🛑 RISK MANAGEMENT
Stop Loss: 3960.00
⚠️ Important Note: Adjust your SL based on YOUR personal risk tolerance & trading strategy. This is a suggested level only - YOUR risk management is YOUR responsibility.
Risk/Reward Ratio: 1:2.5 minimum recommended
🚀 PROFIT TARGET
Primary Target: 4260.00
Technical Reasons:
Strong resistance level identified
Overbought zone trap setup (scalp-friendly)
Correction potential after breakdown confirmation
Historical support/resistance confluence
⚠️ Disclaimer: Take partial profits at technical levels. TP is suggestive only - YOUR profit management is YOUR decision. Risk management is individual responsibility.
📈 TECHNICAL INDICATORS ANALYZED
✅ LSMA Moving Average - Bullish Structure Confirmation
✅ Price Action - Pullback to Support
✅ Resistance/Support Levels - Multi-timeframe confluence
✅ Overbought/Oversold Zones - Trap identification
🔗 CORRELATED PAIRS TO WATCH
1. EURUSD (EUR/USD) - Inverse Correlation ⚠️
Gold typically strengthens when USD weakens
If EURUSD rallies, XAU/USD may follow (USD weakness)
Key Point: Monitor US Dollar strength/weakness for directional bias
Setup Link: EUR strength = Gold strength
2. DXY (US Dollar Index) - Direct Inverse Correlation 📉
Most Important Correlation
When DXY falls → Gold typically rises
When DXY rises → Gold typically falls
Key Levels to Watch: DXY 105.50 - 106.50 (Major support/resistance)
Our Edge: If DXY breaks below support, XAU/USD bullish case strengthens
3. USDJPY (USD/JPY) - Strong USD Indicator 💹
High positive correlation with USD strength
If USDJPY rises sharply = USD strengthening = Gold pressure
Key Point: Monitor for conflicting signals before entry
Watch Zone: 150.00 - 151.50 resistance
4. SPX500 (S&P 500) - Risk Sentiment Indicator 📊
Risk-off environment = Gold strength
During market corrections, gold rallies (safe-haven)
Key Point: If SPX breaks major support, expect gold rally acceleration
Current Context: Monitor for equity weakness signals
5. UST10Y (US 10-Year Treasury Yield) - Rate Pressure 📉
Inverse relationship with Gold prices
Rising yields = Gold headwinds
Falling yields = Gold tailwinds
Our Setup: Lower yields support bullish gold bias
💡 PRE-TRADE CHECKLIST
Confirm LSMA bullish alignment on primary timeframe
Check DXY weakness (< 106.00 = favorable)
Verify no major economic data releases (next 4 hours)
Set layer entry limit orders (avoid FOMO market entries)
Confirm risk/reward = minimum 1:2.5
Position size = 1-2% account risk maximum
Set alerts at entry/SL/TP levels
⚡ TRADING RULES
ONLY enter on confirmed LSMA bullish structure
Use limit orders (never market buy at resistance)
Trail stop-loss once +50 pips profit locked
Take 50% profit at +100 pips minimum
Move remaining SL to breakeven + 5 pips after TP1 hit
Never add to losing position
Created For: Active Swing Traders | Technical Analysis Enthusiasts
Best Used: Combined with your own analysis & risk management
Updated: Real-time market conditions check recommended before entry
"The best trade is the one you DON'T take because it doesn't fit your plan."

Gold awaits non-farm payroll data for direction!Gold Technical Analysis: Today's highly anticipated non-farm payrolls report is a major event. This isn't just any ordinary employment data; it's the first employment report released since the US government reopened, drawing immense attention. Why is this non-farm payrolls data so crucial? Consider this: during the government shutdown, many economic data couldn't be released normally. Now that the government is finally back, this data is like a ray of light in the darkness, illuminating the latest situation in the US job market. Moreover, it will have a key impact on the Federal Reserve's future monetary policy direction, meaning it could potentially create significant volatility in the financial markets. Looking at Tuesday's ADP data, the focus is undoubtedly on weak employment and increased expectations of interest rate cuts. While there's already much speculation and analysis in the market, no one can guarantee the data will turn out well. If the data far exceeds expectations, it could give the US dollar a strong boost. How will the stock market, gold, and commodity markets react? If the data falls short of expectations, will expectations of a Fed rate cut intensify further? All these questions will be answered today.
Gold prices have fluctuated wildly these past two days, but this is in line with our expectations, and the market has cooperated. We've perfectly timed our long and short positions, and congratulations to those who followed our advice. After a morning surge followed by a pullback, gold has entered a period of low-level consolidation, continuing its back-and-forth movement. However, gold is likely to remain range-bound before the Non-Farm Payrolls report, so patience is key while waiting for the data. We've repeatedly bought gold around 4050-4030, and the expected rebound yielded several profits. Now, we're just waiting for the Non-Farm Payrolls report. Market conditions are constantly changing, and gold is currently consolidating within a large range, with the possibility of a sudden reversal. More patience, perseverance, and waiting are needed. Don't be impatient; haste makes waste. Let's witness together what kind of waves the Non-Farm Payrolls report will create in the US session.

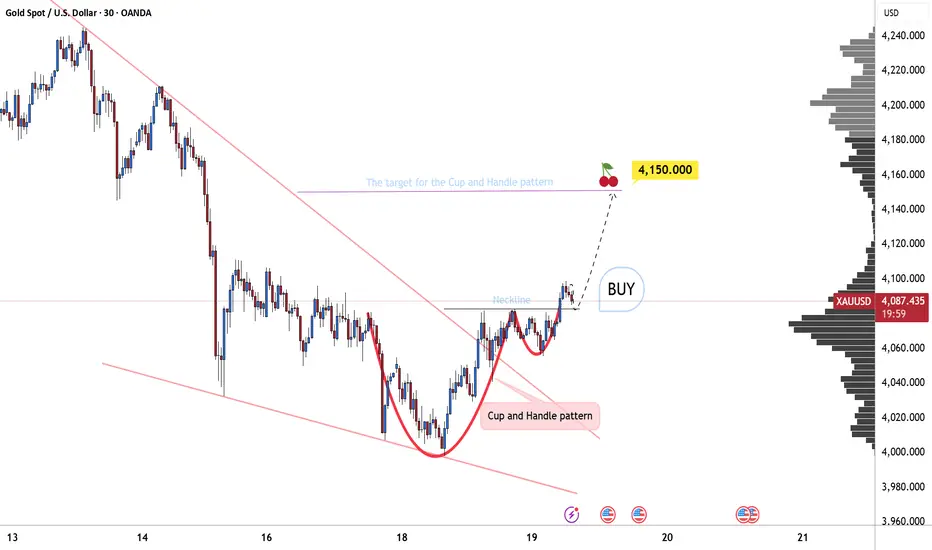
Cup and Handle: Bullish Outlook for GoldOANDA:XAUUSD is clearly forming a Cup and Handle pattern. The price previously dropped to the 4000 zone, then rebounded to 4080, completing the cup structure.
Afterward, the market is experiencing a slight pullback, forming a tight and well-controlled handle.
Finally, the price breaks through the neckline with strong momentum, and my next target is around 4150 , measured based on the height of the cup.
This is a classic bullish pattern, and market expectations are gradually being reinforced.
How to properly seize gold trading opportunities?Gold Technical Analysis: Reviewing yesterday's gold price performance, it showed a clear downward trend overall. Specifically, the gold price moved downwards along the five-day moving average. This trend often suggests a short-term weak market from a technical analysis perspective. During the US session, the gold price experienced a significant decline, which undoubtedly exacerbated the tense atmosphere in the market.
From the daily chart analysis, gold closed yesterday with a medium-sized bearish candlestick with upper and lower shadows. This candlestick pattern contains a wealth of market information. The presence of the upper and lower shadows indicates that both the bulls and bears exerted their strength briefly during the struggle, but ultimately the bears prevailed, pushing the price lower and closing with a bearish candlestick. This forms a "three-day losing streak" pattern on the daily chart, indicating a short-term weak trend. From a trend perspective, the bearish pattern in the gold market remains unchanged.
Based on the above technical analysis and market trends, we can make a reasonable prediction for the future price movement of gold. We expect the price to further test the support level of the daily chart's lower trendline. Therefore, our trading strategy for today remains unchanged: shorting on rallies. Specifically, we will focus on the 10-day moving average as our entry point for shorting. On the downside, we will first look at yesterday's low. If the price breaks below yesterday's low, we can expect it to fall further. Taking into account various factors, we have identified the following specific resistance and support levels. The resistance levels are 4050-4070 and 4100, respectively. These levels have historically exerted downward pressure on prices and are key resistance areas that we need to pay close attention to during trading. The support levels are 4005-3980 and 3930, respectively. These levels are crucial points where prices may find support and rebound. Regarding trading recommendations, we suggest entering short positions in the 4050-4070 range. It is important to note that the market is fraught with uncertainty and risk, and the above trading strategy is for reference only. When making investment decisions, investors should fully consider their own risk tolerance and investment goals, and make decisions prudently. We hope every investor can have good luck in the market and achieve their investment goals. In summary, today's gold trading strategy is to primarily sell on rallies and secondarily buy on dips. The key resistance level to watch in the short term is 4050-4070, and the key support level is 4005-3980. Please keep up with the pace.

Elliott Wave Analysis XAUUSD – November W4, 2025
1. Momentum
W1 – Weekly timeframe
Weekly momentum is showing early signs of a reversal. If next week forms a confirmed bullish weekly candle, the market may enter 4–5 consecutive bullish weeks, pushing weekly momentum into the overbought zone.
D1 – Daily timeframe
Daily momentum continues to rise, suggesting the market may experience 1–2 more days of upward movement before reaching the overbought region.
H4 – 4-hour timeframe
H4 momentum remains bullish, indicating that Monday is likely to show a continuation of upward movement or sideways consolidation.
________________________________________
2. Elliott Wave Structure
Weekly Structure (W1)
The last three weekly candles are bullish, but not strongly decisive:
• Two candles have short bodies
• One is a bullish candle with an upper wick
This behavior suggests the market is completing wave X (purple). Therefore, the main expectation is a continued decline to complete wave Y (purple) toward the lower target zones. Once wave Y finishes and weekly momentum confirms reversal, a new major bullish trend is likely to begin.
________________________________________
Daily Structure (D1)
• Wave X (purple) is likely complete.
• Price is now progressing within wave Y (purple).
Inside wave Y:
• Wave 1 (red) appears to have finished.
• Price is currently in wave 2 (red) or has already started the early phase of wave 3 (red).
🔸 Key confirmation level:
A break below 4001 would confirm that the market has entered wave 3 (red), leading to a sharp and decisive decline.
🔸 Alternative scenario:
Because D1 momentum is still rising, wave 2 (red) may be forming a WXY corrective pattern (green zigzag), meaning the market may still produce a final upward swing before the next strong decline.
________________________________________
3. H4 Wave Structure
At the moment, there are two scenarios in line with the D1 structure:
• The market may already be in the early phase of wave 3 (red).
• Or price is completing the final leg of the WXY correction of wave 2 (red) (indicated by the green zigzag).
The zone around 4081 currently acts as the balance area, also the region with the highest traded volume (green POC line).
• If price stays below 4081 during Monday, the probability favors wave 3 (red), meaning strong support zones 4020 and 3958 are likely to break.
• If price stays above 4081, upside targets at 4145 and 4184 become ideal levels for completing wave 2 (red).
________________________________________
4. Trading Plan
📌 Preferred Limit Sell Zones:
• 4145
• 4184
📌 Direct Sell Zone:
• 4020 → only valid if a strong H4 candle closes below 4020, followed by a retest.
A more detailed trading plan will be updated on Monday, once fresh market data becomes available.


GOLDDO YOU KNOW WHATS BEHIND THIS OR OTHER IDEAS?? in bio..
Preferably suitable for scalping and accurate as long as you watch carefully the price action with the drawn areas.
With your likes and comments, you give me enough energy to provide the best analysis on an ongoing basis.
And if you needed any analysis that was not on the page, you can ask me with a comment or a personal message.
Enjoy Trading ;)
