XAUUSD _ 1h UPDATE
Price has formed a Higher Low, indicating that bullish pressure is building within the triangle structure.
The key level to watch now is the resistance zone marked on your chart. (Refer to Fibonacci as well)
If the price breaks above this resistance and then holds or stabilizes above it, this will confirm a bullish continuation.
After confirmation, the market is expected to move upward toward the upper boundary of the triangle and will likely attempt to create a new high.
As long as the structure continues forming Higher Lows, the bullish scenario remains valid.
However, a break below the trendline would invalidate this analysis.
After the second leg , the price attempted to break the dynamic resistance but failed. Despite that, strong sellers did not step in immediately, and the market is currently moving sideways.
For now, the best approach is to stay patient and wait for clearer movement.
If the price breaks the dynamic resistance upward, you can open a bullish position after a proper confirmation.
If price made a new LL look for bearish confirmation.
Trade ideas

AFTER A HIGHER LOW ON A HIGHER TIME FRAME We will have a good buy Monday and it's a must trade, the only hindrance will be that price is still in between major buy/sell zones and might not buy much but I believe market has done all the dirty work already from last week and finally this week and next week could be the start of another major buy to create a higher high on weekly ,
This is a complex architecture and its very confusing, once market creates a low after a high on higher time frame like w1 and monthly , the next is just up and down to clear liquidity for days or weeks before the buy start and what makes it confusing is it starts respecting sell zones that send wrong signals of a possible further sells but ideally it just to clear liquidity and to test buy zones before ideal buy start and similar happens on D1 and lower time frames but not complicated as from weekly upwards and that same sell signals happens in a bearish market and that what makes it difficult to determine if we are selling more or buying more until price moves out of the range and create a high, somehow complicated.

In NY TIME wait for the Gold to go downsideIn NY TIME wait for the Gold to go downside
This will invalidate if 4h candle will be broken
Breakdown to lower timeframe for a better entry

XAUUSD in rising channel Market is in Rising wedge channel and I'm still on upside.
What are my conditions For This setup?
- 1st buying area will be 4095-4085 and target will be 4135 - 4145 & 4160 in extension.
Second if H4 closed below 4080 then market will test 4050.

GOLD Best Places To Buy And Sell Cleared , 500 Pips Waiting !Here is m y opinion on GOLD On 15 Mins T.F , We have a Good movement since Last 2 weeks , and we have a range now for 3 Weeks started between 4050.00 to 4099.00 so we can buy and sell Gold This Week from 2 areas , 4050.00 will be the best place for Buy and range between 4095.00 to 4099.00 will be the best place for Sell , now the price very near selling area so we can wait the price to retest the res area and then enter a sell trade and targeting 4050.00 and when the price touch it and give us a good bullish P.A , we can enter a buy trade and targeting 4099.00 , It`s All Depend On Price action , if we have a daily closure below our support then the price will go down more and more after huge movement to upside .
Entry Reasons :
1- Highest Level The Price Touch It
2- Broken Res
3- New Support Created .
4- Clear Price Action .
5- Clear Support & Res .
6- Price Range Cleared .

GOLDDO YOU KNOW WHATS BEHIND THIS OR OTHER IDEAS?? in bio..
Preferably suitable for scalping and accurate as long as you watch carefully the price action with the drawn areas.
With your likes and comments, you give me enough energy to provide the best analysis on an ongoing basis.
And if you needed any analysis that was not on the page, you can ask me with a comment or a personal message.
Enjoy Trading ;)

QuyetP | Careful with GOLD! Big move down right ahead!??OANDA:XAUUSD is signaling something clear: a big move down is in its early stage. I broke this down earlier, and price is playing out exactly as outlined. Forget short-term news — price tells the truth.
Bearish structure holds strong. Every bounce gets sold off.
In the VIP group, I’m already holding several short positions and will manage/add based on how price reacts at key levels.
Key points:
- Trend: Strong bearish bias
- Big move: Still early — plenty of downside room
- News: Ignore noise, follow price
Check the previous analysis in the link below.

Possible XAUUSD swingREad text in chart.... Updates will follow
TRade with proper risk
Patience is the way! Ieios

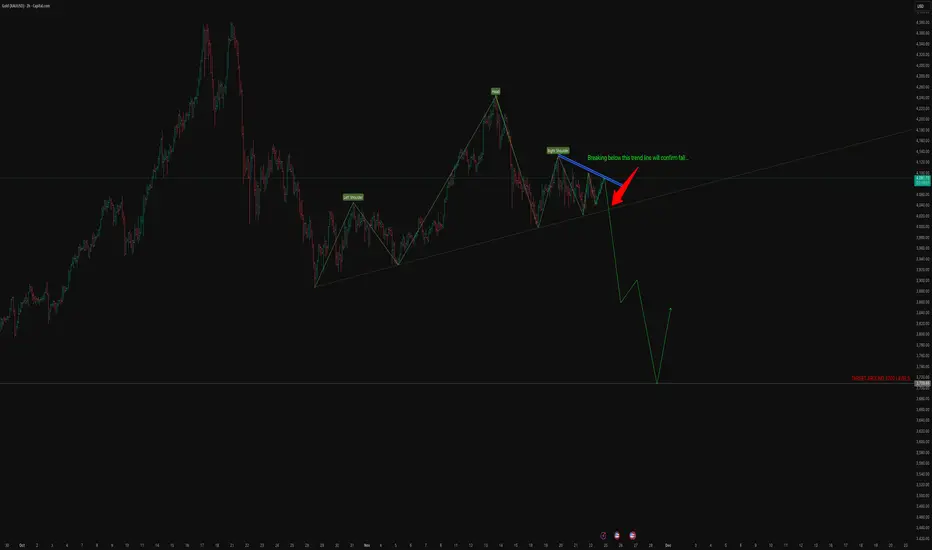
Analysis for GOLD (30-min chart)GOLD – Technical Analysis (Based on Your Chart Structure)
Timeframe: 30-min
Bias: Strongly Bearish
Expected Target: ≈ 3700
1. Pattern Structure Identified
chart clearly shows:
A. Completed Head & Shoulders Pattern
Left Shoulder – confirmed
Head – sharp rise and rejection
Right Shoulder – weak lower-high formation
The neckline is drawn exactly through the trendline support you have highlighted.
Chart correctly marks 3700 as a high-probability target because:
Major horizontal support from past structure
Confluence of measured move of Head & Shoulders
Matches Fibonacci projection (1.618 extension) of the right-shoulder decline
Strong liquidity zone—big banks accumulate there
Realistic target and technically justified.
6. Immediate Levels to Watch
LevelAction4120 – 4130Breakdown trigger zone (critical)4050First reaction zone3950 – 3920Intermediate support, temporary bounce possible3700Final target (high probability)
7. Trading View (Summary)
Structure: Head & Shoulders top
Trend: Bearish
Trigger: Break of rising trendline
Confirmation: Close below neckline with follow-through
Target: 3700
Invalidation: Close above right shoulder high
Conclusion
As per accurate analysis,
If the neckline breaks, Gold has a clean path toward 3700 with intermediate pullbacks.
Structure, volume, and trendline confluence all support this bearish continuation.
Disclaimer
This analysis is for educational purposes only and not investment advice. Market conditions can change, and risk management is essential.
Gold potential scenarioBased on the chart, gold appears to be completing wave B of a flat pattern, which will complete wave X of a larger WXY pattern (WAVE Y).
On Monday, November 24, 2025, a buy trade is favorable if the price closes above 4092, with targets at 4115, 4132, and 4152.
The stop-loss for this trade is an hourly close below 4045.

XAUUSD - H1Gold is currently in a corrective phase inside a descending structure, but price is sitting on a key confluence support zone and showing early signs of accumulation + potential bullish reversal.
WINLOUH chart marks:
Completed Elliott 5-wave decline
Structure break (BOS)
Multiple ChoCH signals
A large FVG above (supply zone)
Fib retracement 0.5 / 0.618 cluster
Trendline liquidity overhead
Projected bullish move toward 4170 (measured level)

XAUUSD _ 1h
Price has formed a Higher Low, which shows bullish pressure building inside the triangle structure.
The key level now is the resistance zone marked on your chart (the yellow horizontal area).
If price breaks above this resistance and then holds/stabilizes above it, this will confirm bullish continuation.
After confirmation, the market is expected to move upward toward the upper boundary of the triangle, and it will likely attempt to create a new high (a new top).
As long as the structure keeps making Higher Lows, the bullish scenario remains valid.
Breaking below the trendline would invalidate this analysis.

XAUUSD:LIVE TRADEHello friends
Well, we had a decline that we found support for with Fibonacci, and you can see that there was good support from buyers at this point.
We also have a head and shoulders pattern, which is again a positive.
The downtrend line has also been broken, which is also a positive point.
Now, given the arrival of buyers, we can enter the trade and move with it to the specified targets.
Note that the first principle of trading is capital and risk management, so be sure to follow it and avoid emotional behavior.
*Trade safely with us*

XAUUSD STILL BULLISHInternal falling wedge created. Manage your risk properly!
ENTRY: 4090
TP1: 4180
TP2: 4200
SL: 4027

Seize the opportunity to short sell at high levels.Technically, gold closed last week in a range-bound manner, and short positions once again yielded good profits. Shorting in the 4080-4100 range, focusing on selling at higher levels, offered considerable profit potential. Given the overall bearish structure on the 4-hour chart, the strategy of buying low and selling high within the lower range, relying on strong resistance and support (primarily shorting), was also favorable for those who went long. However, given the overall bearish trend, going long against the trend is generally cautious and should be avoided, especially chasing rallies in the middle. There's not much to say technically; the overall strategy remains to patiently sell on rallies. Intraday, if there's another rebound, shorting in batches within the 4080-4100 range can be considered.

How will gold break out of its current predicament next week?
news:
On Friday, Williams, president of the New York Fed and one of the Fed's "Big Three," made a decisive statement, both setting the tone and saving the market from crisis. As a key figure sharing power with Powell and Jefferson, he bluntly stated that interest rates are "very likely to be adjusted further in the near future."
Of course, the hawks didn't back down either. Boston Fed President Collins was worried about inflation, while Dallas Fed President Logan was even tougher, questioning whether they should have voted on the previous two rate cuts, although Logan doesn't have voting rights this year.
technology:
Regarding the Golden Week holiday, the gold market experienced range-bound trading over the past week. The highest price reached was $4132, and the lowest was $4022, with an overall fluctuation range of approximately $110. However, for most of the week, gold prices fluctuated repeatedly within the $4040-$4110 range, with the fluctuation range narrowing to around $70.
Currently, after touching $4240, gold prices are temporarily in a second downward correction phase, and judging from the timeframe, this correction is not yet fully over. However, gold prices have twice found support and rebounded near the $4000 level, indicating that bulls have the potential for a short-term counterattack at this level.
Looking at the 1-hour chart, the short-term resistance level to watch is around 4110, while the support level is around 4020. Technically, the trend is more inclined towards a correction followed by an upward move. I will provide specific trading strategies in the channel, so please pay close attention.
Strategy Signals:
buy:4040-4035,SL:4025,TP:4080,4100

XAUUSD: Gold Sitting on Key Support – Big Move Loading?Gold is currently reacting inside a major support zone, and price action is showing signs that bulls may step back in soon.
The chart is giving us two clear bullish pathways — both pointing toward the same destination: the upper supply zone.
---
🔍 What the Chart Is Telling Me
✅ 1. First Support Zone Holding
Price has been respecting the mid-support area for weeks now.
Each time XAUUSD tapped this zone, buyers stepped in aggressively.
✅ 2. Possible Deeper Pullback
If price fails to push straight up from here, we could still see a dip into the stronger demand zone below (the big green zone).
That level has historically triggered massive rallies — it’s a high-value area for larger players.
✅ 3. Final Target Still the Same
Both scenarios point toward the 4,150 – 4,200 supply zone (red area).
This is where sellers previously dominated, so it’s a natural magnet for price.
---
📈 Bullish Scenarios
Scenario A:
Price respects the current support zone →
Bounce → Continuation → Push into 4,150 – 4,200
Scenario B:
Price dips into the deeper demand zone →
Strong reaction → Bigger rally into 4,150 – 4,200
Either way, the market structure remains bullish as long as the lower zone holds.
---
🤔 What Do You Think?
Is Gold gearing up for another bullish leg?
Or will we sweep the lower demand zone first before the next big rally?
👇 Drop your thoughts below!
👍 Like this idea if it helped
🔔 Follow for daily XAUUSD updates

Gold price analysis November 18XAUUSD continues to be under downward pressure as the sellers have a clear advantage, pulling the price down to the support zone of 3933. The buyers' efforts to hold the price at the trendline are quite weak, indicating that this support structure is at risk of being penetrated and the market may extend its decline to lower areas.
At this point, observing the price reaction at important support levels on the chart is the key factor to find a safe entry point.
Preferred trading scenario:
BUY when the market refuses to fall deeply and there is a clear reversal signal at the zone of 3973 - 3933.
Target: immediate target towards 4104, further extension to 4203.
Risk note: the uptrend will be invalidated if the H4 candle closes below 3933.

Gold: Watch Resistance at 4070–4114 Ahead of NFPGold dropped below 4010 during yesterday’s late session but quickly rebounded afterward, and many traders should have captured that long opportunity.
For today’s session, the main focus remains on whether the 4000 psychological level can hold.
Key resistance levels to watch:
4070 (first resistance)
4082–4091 / 4097–4104
Major resistance at 4110–4114
The 4020–4000 zone may see repeated fluctuations, but in the short term it will continue to attract buying interest. Therefore, buying on dips still carries a relatively high probability of success.
If price breaks below 4000 again, pay close attention to:
3986–3966 zone
3932 support
These areas represent the origin of the recent rebound. Previously trapped short positions are likely to cover and reverse into longs once they get out, while trapped longs above 4200 may also add positions to lower their average cost—both forces combined could provide solid support for another rebound.
Once gold returns above 4100, caution is necessary:
Watch 4070 as the key support during any pullback
If this level holds and the upcoming NFP report does not pressure the bulls, the market may attempt another move toward 4200
However, if the data turns out bearish, multiple catalysts could empower the bears, leading to another downward move to retest the critical 3886 support level
Overall, the short-term outlook remains dominated by key support/resistance interactions, while the medium-term direction depends on whether 4000 holds and whether upcoming macro data can revive bullish sentiment.

Gold 4H Breakdown: Supply Rejection Signaling Deeper Sell-Off📉 XAU/USD Trading Plan – Bearish Setup
(Based on 4H supply/demand structure, fib confluence, and distribution signals)
📌 Bias: Bearish
Gold is showing signs of distribution, rejecting multiple supply zones and forming a lower high after a fake CHoCH. The overall structure suggests a potential move into deeper demand.
🟥 Trade Idea: Short Position
🔸 Entry Zone (Sell Area):
4,090 - 4110
Price has rejected this zone several times and aligns with 38.2%–50% fib + mid-range supply.
🔸Stop-Loss (Invalidation):
Above 4,140
Placed above the 50.0% retracement and the key supply zone.
If price breaks this level, the bearish setup is invalidated.
🎯 Take-Profit Targets
TP1 – Conservative Target
4,003 – 3,976
23.6% fib + short-term structural support.
Good for partials.
TP2 – Main Target (FAKE Demand Zone)
3,897 – 3,886
Major demand zone where liquidity is likely to be tapped.
TP3 – Extended Target (Full Projection)
3,753
−27% fib extension and deeper liquidity zone.
📊 Technical Summary
Multiple stacked supply zones above price
Price created a fake CHoCH, failing to hold above structure
Fib retracements (38.2%–61.8%) align with supply
Lower high formation → bearish continuation likely
Targeting the unmitigated fake demand zone and extension levels
⚠️ Risk Management
Risk only 1–2% per trade
Break-even once TP1 hits
Scale out profits at each target to lock gains
📌 Outlook
As long as price stays below 4,100, bearish continuation toward 3,886 and possibly 3,753 remains the most probable scenario.

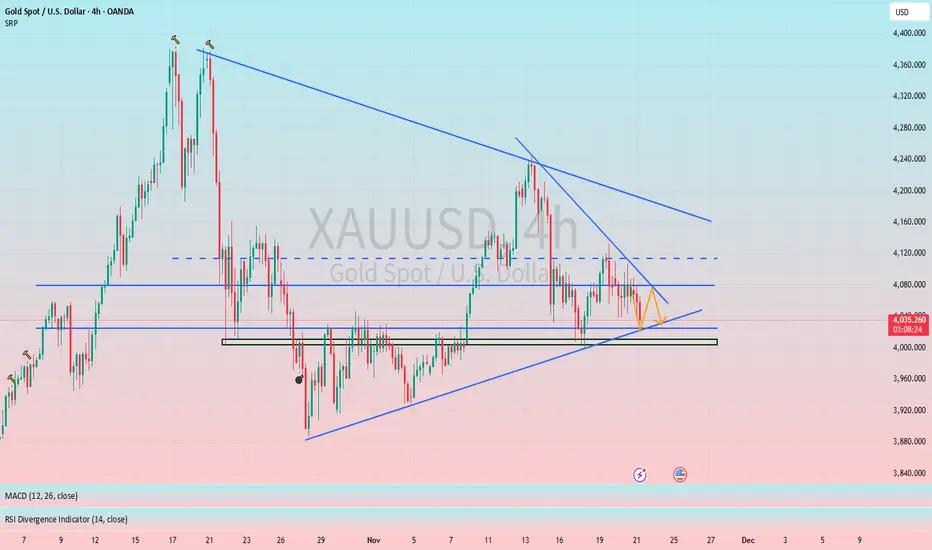
XAUUSDLets see how this chart works. Hope for the best!
In this chart i drew to different lines. Lets see how it goes from here on. Be careful while trading is market is behaving very dangerously.

Breakout from a triangle pattern indicates a potential direction#XAUUSD OANDA:XAUUSD TVC:GOLD
From a trend perspective, gold is currently in a triangle consolidation range. As time goes on, the short-term resistance is also moving downwards. Therefore, gold did not provide us with a suitable opportunity to participate in trading last night. Gold is currently continuing its decline and may further test the 4025-4015 support level. If it pulls back to this level, we can consider a small long position in gold.
November 20 | Spot Gold Technical Analysis (European and AmericaNovember 20 | Spot Gold Technical Analysis (European and American Sessions)
📉 The Fed meeting minutes released early this morning were arguably the most divisive in recent years:
"Many" members opposed a December rate cut, fearing "deep-rooted" inflation;
"Most" members warned that a rate cut could be misinterpreted as abandoning the fight against inflation;
Only "a few" members supported a rate cut, clearly a minority;
The previous vote saw a rare 10-2 split, indicating internal strife!
💸 The market reacted immediately to the minutes:
The US dollar index surged 0.59% in a single day, breaking through the 100 mark;
US Treasury yields rose in tandem;
Gold fell sharply, its zero-interest asset status exposing its weakness.
😱 Even more troublesome is—a data vacuum has emerged!
Due to the government shutdown:
The October unemployment rate is permanently missing;
The October and November non-farm payrolls data will be combined and released on December 16th;
The Fed's December policy meeting will be held on December 9-10!
This means the Fed will be deciding its interest rate path in a "blind" manner.
🕶️ Powell has previously stated that "a rate cut is not a done deal." With zero data, it's difficult for the Fed to be dovish.
🗣️ Trump has again attacked, saying he "really wants to fire Powell."
But this time, the Fed seems determined to stand firm, with hawkish voices prevailing.
📊 Tonight's focus: The long-awaited September non-farm payrolls. The market expects only 50,000 new jobs. Even if the data is weak, it will be difficult to reverse the expectation of no rate cut in December. Unless there is a "super dovish" report, gold will struggle to gain sustained momentum.
⚔️ Technical Analysis:
The daily chart shows a "gravestone doji" pattern, with resistance at the 4135/4150 area.
Watch the 4040 Bollinger Middle Band support and the psychological level of 4000.
If 4000 is broken, consider shorting.
If 4100 is recovered, the next target is the 4220/4250 area.
🧭 1-Hour Chart:
Gold prices are in a downward channel, and momentum is bearish after breaking below 4080.
MACD/KDJ indicators are also bearish.
🎯 Trading Strategy Recommendations:
Long positions can be initiated in batches around the 4005/4000 area, with a stop-loss at 3988.
Short positions can be initiated around the 4085/4106 area, with a stop-loss at 4113.
💡 Summary: The Fed's "hawkish awakening" is shaking the foundations of gold's bull market—low interest rates + strong safe-haven demand. Gold prices may continue to fluctuate in the short term, and a real bullish opportunity may not arrive until the first quarter of next year.
🚀 Let's monitor the market together on Non-Farm Payrolls night! Strategies will be updated in real time, so please stay tuned!
