Gold may face short-term pullback📊 Market Movement
Gold is currently trading around USD 4,067/oz. The U.S. dollar is stabilizing while Treasury yields remain firm, which continues to pressure gold. Safe-haven demand is recovering slightly, but the trend is still unclear and lacks strong momentum.
📉 Technical Analysis
• Key Resistance: ~ USD 4,090/oz — area where sellers previously stepped in strongly.
• Additional Resistance: ~ USD 4,110/oz — secondary level if the main resistance breaks.
• Nearest Support: ~ USD 4,030/oz — strong technical reaction zone.
• Additional Support: ~ USD 4,000/oz — psychological level and broader support range.
• EMA09: Price is currently below the EMA09 on short-term charts → indicating a bearish short-term bias.
• Candlestick / Volume / Momentum:
• Recent candles show longer upper wicks → selling pressure appears at higher levels.
• Momentum indicators (MACD, short-term oscillators) are weakening.
• Probability of an immediate strong upward breakout is low; correction risk remains elevated.
📌 Outlook
Gold may decline in the short term if the resistance around USD 4,090 holds and the U.S. dollar continues to strengthen.
If the support at USD 4,030 holds and new buyers step in, a rebound is still possible.
💡 Trade Strategy Suggestions
🔻 SELL XAU/USD at: 4,087 – 4,090
🎯 TP: 40 / 80 / 200 pips
❌ SL: 4,094
🔺 BUY XAU/USD at: 4,026 – 4,029
🎯 TP: 40 / 80 / 200 pips
❌ SL: 4,022
Trade ideas

Gold: 4000 Breakdown → 4080 Breakout, Short StrategyAfter breaking below the key level of 4000 today, gold staged a minor rebound. It then oscillated within the 4030-4050 range and rebounded again during the US session, successfully breaking above 4080 so far.
Resistance above remains significant – we can continue to go short at high levels
Accurate signals updated daily. They serve as a reliable guide for trading issues – feel free to refer to them. Hope they help!

Gold May See a Minor Pullback Before Gaining Bullish Momentum📊 Market Update
Gold is currently trading around ≈ 4,050 USD/oz. A firm US Dollar is keeping gold from breaking higher, while markets await clearer signals from the Federal Reserve and upcoming US economic data. Cautious sentiment is keeping gold in a tight consolidation range.
📉 Technical Analysis
Resistance Levels:
• R1: ~ 4,100
• R2: ~ 4,135 (new resistance – recent swing high, strong selling pressure likely)
Support Levels:
• S1: ~ 4,020
• S2: ~ 3,995 – 4,000 (strong support, aligned with recent lows and trend validation)
EMA & Trend:
• Price is below the EMA 09, indicating slowing bullish momentum and short-term consolidation.
• If price moves back above EMA 09 on H1 → bullish momentum may resume.
Candles – Volume – Momentum:
• Narrow-range movement on H1/H4 → sideways market.
• Volume slightly lower → traders are waiting for a catalyst.
• Momentum is soft but no strong reversal signals yet.
________________________________________
📌 Market View
Gold may pull back to the 4,020 or 4,000 support regions before regaining upward momentum.
A weaker USD or negative US economic data could push gold upward again toward 4,100 – 4,135.
________________________________________
💡 Trading Strategy
🔻 SELL XAU/USD at: 4,090 – 4,093
🎯 TP: 40 / 80 / 200 pips
❌ SL: 4,096
🔺 BUY XAU/USD at: 4,023 – 4,020
🎯 TP: 40 / 80 / 200 pips
❌ SL: 4,017

XAUUSD POSSIBLE MOVEMENT ( READ IT )Hello traders here is my new XAUUSD idea, share your opinion on this idea
Key Points
Current price 4098
Resistance zone 4110
Target area 1 4060/4050
Target area 2 4010/4000
Stay with us for more updates on XAUUSD and dont forget to share with your friends and family
thank you for supporting and please share your thoughts on this idea

Elliott Wave Analysis XAUUSD – 21/11/20251. Momentum
D1:
The D1 momentum is contracting, signaling a potential reversal. If today’s candle confirms this, it will further support the continuation of wave Y.
H4:
H4 momentum has turned downward, so the expectation for today remains bearish movement.
H1:
H1 momentum is preparing to turn upward, suggesting a small corrective bounce. However, in the current context, price is likely to remain sideways within the 4046 – 4081 range.
________________________________________
2. Wave Structure
D1 – Higher timeframe
With D1 momentum preparing to turn down, the continuation of wave Y is reinforced.
But since momentum is near the oversold zone, two potential scenarios may unfold:
1️⃣ Strong decline:
A sharp drop may break 3888, opening the way toward deeper targets such as 3746.
2️⃣ Weak decline – Compression:
Price may continue down but fail to break 3888.
Once momentum turns upward again, a new trend could form.
________________________________________
H4 – Pattern outlook
The H4 structure remains unclear—price may still be in wave (3) or wave (2).
• If it is wave (3), strong bearish candles or a test of 4001 should appear.
• If price keeps moving sideways without breaking 4001 until H4 momentum reaches oversold, the current move is likely wave B of an ABC correction inside wave 2.
Based on the current depth of wave B, wave C is estimated to target 4175.
________________________________________
H1 – Lower timeframe
Wave 2 (green) is taking longer than ideal, but not enough to invalidate the current labeling.
The 4081 resistance is very strong and serves as our sell zone.
Below, the 4020 support is equally important:
• A sharp decline with H1 closing below 4020 may trigger a larger bearish continuation.
• Typically, price reacts with a bounce when it first touches this area.
________________________________________
3. Trade Plan
Sell Zone: 4073 – 4075
SL: 4093
TP1: 4020
TP2: 3958
TP3: 3885

Going Long And Short Afterwards On GoldThis entire analysis is based on the five minute timeframe. Price broke the most recent support level, which had been a very strong support. After the second touch, the third touch finally broke through and price is now moving down toward the next support zone. I am anticipating a bounce from that next support level, pushing price back up toward the previous high that I have marked. From that high, I expect a sell off that takes price all the way down toward the low around four thousand fifty.

I'm planning to go long on gold in the 4045-4065 range!This week, the gold market exhibited a generally volatile and consolidating pattern, offering traders some room for maneuver. Gold prices initially surged to a high of $4132 at the beginning of the week, but subsequently failed to maintain their upward momentum, gradually retreating and entering a range-bound consolidation phase, primarily fluctuating between $4000 and $4110. Compared to previous weeks' volatile price movements influenced by macroeconomic data or geopolitical situations, this week's trend was more moderate and orderly, with narrower fluctuations, weaker trends, and a relatively controllable overall pace. This volatile market provides numerous opportunities for short-term traders, especially with the high-sell-low-buy strategy proving particularly effective between key support and resistance levels. Some investors have successfully captured pullbacks and achieved ideal returns by accurately timing their short positions and decisively placing short orders in areas where prices encounter resistance during rebounds.
From a weekly technical perspective, this week's candlestick closed as a doji with upper and lower shadows. This signal typically indicates a short-term balance between bullish and bearish forces, with neither buyers nor sellers holding a clear dominant position. Based on an analysis of the recent global financial market environment, there is currently a lack of major driving factors sufficient to propel gold in a clear direction. On the one hand, inflation data from major economies are gradually stabilizing, and monetary policy expectations are becoming more moderate, reducing gold's short-term appeal as a safe-haven asset. On the other hand, while geopolitical risks still exist, they have not escalated to the point of triggering widespread risk aversion. Therefore, market participants are generally adopting a wait-and-see attitude, making it difficult for gold prices to form a sustained breakout.
It is worth noting that reviewing historical trends over the past few months reveals that the gold market often experiences sudden fluctuations at the end of the week, especially on Fridays. Examples include rapid rises or falls after the release of non-farm payroll data, or technical breakdowns caused by unexpected events. This "Friday effect" increases the risk of holding positions over the weekend. Therefore, even if the current market appears stable, traders need to remain highly vigilant, manage their positions reasonably, and set stop-loss orders to guard against potential unexpected fluctuations.
From the hourly chart, the short-term gold price has reached a key technical juncture—the so-called "bullish/bearish dividing line." Currently, the price is fluctuating narrowly around the middle Bollinger Band. This area is not only a convergence zone of short-term moving averages but also a significant psychological level that has been tested multiple times previously. As an important tool for measuring market volatility, the narrowing of the Bollinger Bands indicates that the market is currently in a low-volatility phase, suggesting a potential directional move. If the gold price can effectively hold above the middle band, accompanied by a moderate increase in trading volume, it may resume its upward trend, with the next target potentially pointing to the key resistance area of $4090 or even $4100. Conversely, if it fails to hold this support level and breaks below the lower band, it may resume its downward correction, testing even lower support levels.
Based on the current technical structure and market sentiment, the recommended trading strategy is to establish long positions in batches within the $4045 to $4065 range after the market opens.
The above are my personal thoughts! If they are helpful to you or you agree with my ideas, please like and follow to support me! All strategies have a limited lifespan. While referring to them, it's also important to closely monitor market changes. I will respond flexibly based on actual market fluctuations, and I will provide specific updates in the channel!

GOLD: BULLS ABOUT TO MAKE AN IMPULSE!Hello traders, Here's my point of view about CAPITALCOM:GOLD
TECHNICALLY:
DOLG remains very bullish, We manage to make deep retracements back into those daily GAPS.
FUNDAMENTALLY
END OF THE YEAR BULL RUN & ALL THE OTHER FACTORS THAT I'VE BEEN CALLING.
You may find more details in the chart!
Thank you and Good Luck! MAKE SURE TO STAY STRICT WITH YOUR RISK MANAGEMENT!
PS: Please support with a like or comment if you find this analysis useful for your trading day.

LiamTrading – XAUUSD H1 | A bearish structure has formed...LiamTrading – XAUUSD H1 | A bearish structure has formed, waiting for confirmation signals in the European session
Overall, gold is in a corrective phase after the previous upward move. On H1, a clear Dow bearish structure (lower highs, lower lows) has formed, but the support area around 4,030 and the Fibonacci cluster below are still potential zones for a reversal buying force. Today's European session will be crucial to confirm: whether to continue a deep decline or bounce back according to the head and shoulders pattern forming on H4.
Macro – Fundamental Brief
The October Fed meeting minutes show a strong internal division:
One group opposes rate cuts, wanting to maintain the current level.
The other group supports cuts, even proposing further reductions in the December meeting.
This lack of consensus reflects a high degree of monetary policy uncertainty, keeping defensive capital flows interested in gold. In the long term, gold only surges when confidence in the financial system weakens – the peak gold price is not a sign of prosperity, but a warning signal.
Technical Analysis – H1 (trendline, Fibonacci, liquidity)
The price is fluctuating below the short-term descending trendline, confirming the bearish phase is still in effect.
The 4,082–4,090 zone is an “important liquidity zone” – where the price has reacted multiple times, currently acting as near resistance.
The 4,029–4,031 cluster is crucial support:
Coincides with technical support area + Fibonacci retracement level.
Start of a large FVG running down to the 3,985 zone (Fibo 1.618 + psychological support).
Above, the 4,129–4,130 zone is strong resistance (strong resistance on the chart); if the price surpasses and holds above this area, the Dow bearish structure will weaken significantly.
Trading Scenario Reference
BUY Scenario – buy at support / Fibonacci zone
Logic: Price holds above support – Fibonacci, bottom-fishing capital appears.
Entry BUY: 4,029–4,031
SL: 4,022
TP: 4,040 → 4,065 → 4,090 → 4,120
Only prioritize when the price reacts well at 4,029–4,031 (wick or clear reversal candle appears on M15–H1). If H1 closes below 4,022, this BUY scenario should be canceled.
SELL Scenario – follow the current bearish structure (prioritize when trendline is not broken)
Logic: Price retraces to retest resistance + descending trendline and is rejected.
Entry SELL: 4,098–4,100
SL: 4,105
TP: 4,088 → 4,070 → 4,035 → 4,000–3,985
Only enter when the price hits the 4,098–4,100 zone and a clear rejection signal appears (pin bar/bearish engulfing). If H1 closes above 4,105 and breaks the trendline, stop all sell orders and reassess the structure.
Notable Price Zones for Scalping
4,082 – 4,060 – 3,985 – 4,129
These zones can be used for short-term scalping based on price reactions, but reduce volume and close quickly.
Important Note
If the price is confirmed to close stably above the descending trendline and holds above the 4,090–4,100 zone, the priority will gradually shift to BUY setups, as a head and shoulders pattern (bullish reversal) is forming on H4.
Conversely, if the 4,029–4,022 support is decisively broken, gold is likely to continue falling towards the FVG and Fibonacci 1.618 zone around 3,985.
Which scenario are you leaning towards for gold today – retrace up to sell further or hold the bottom to bounce back? Leave a comment below the post and follow the LiamTrading channel for daily XAUUSD updates on TradingView.

I will continue to short gold. Are you ready?Gold prices rebounded slightly after falling below the $4,000 mark. This downward trend was largely in line with previous predictions, and the target price of $4,000 has been reached as expected. Subsequent weak initial jobless claims data triggered a significant shift in market sentiment, stabilizing and pushing gold prices higher. This rally effectively alleviated the previous continuous decline, allowing prices to re-enter a range-bound trading pattern.
Although bulls have exerted some strength in the short term, the overall market remains dominated by bears. The key support zone is currently between $3,990 and $4,000, providing both technical and psychological support. Resistance is concentrated between $4,100 and $4,090, a level that has faced resistance multiple times previously. Based on the current market situation, it is recommended to continue the trading strategy established at the beginning of the week, establishing short positions in batches within the $4,080 to $4,105 range. The strategy will be evaluated and adjusted in a timely manner based on macroeconomic data and market dynamics; any significant adjustments will be announced separately.
The above are my personal thoughts! If this is helpful to you or if you share the same ideas, please like and follow to show your support! All strategies have a limited lifespan. While referring to them, it's also important to closely monitor market changes. I will respond flexibly based on actual market fluctuations, and I will provide specific updates in the channel!

GOLD BUY WITH LIMIT ORDER!!!!!Gold made a fresh BOS and price is heading for a pull back from the breaker block after my inducement am in on buys from that zone after my inducement at 4,081 which is my buy limit order.....

GOLD 15 CHART Dear Traders,
Gold has been testing lower levels since yesterday and has now shown multiple confluences confirming a potential long setup on the 15-minute chart. Please trade cautiously and maintain strict risk management.
Quantum Trader
Gold Analysis & Trading Strategy | November 18-19✅ From the 4-hour chart, gold remains in an overall bearish correction structure.
MA5 and MA10 have formed a bearish crossover and continue to suppress the candlesticks, indicating that the short-term rebound is limited.
MA20 is located near 4097, acting as significant resistance. As long as the price fails to stabilize above this level, the bearish structure will not change.
The Bollinger Bands show a downward opening, reflecting a weak trend.
Price previously broke below the lower band (around 3980) and although it has since rebounded, it still remains below the middle band.
Gold has repeatedly tested the 3997–4000 support zone and formed brief rebounds, but the strength is weak — this is still technical correction rather than a trend reversal.
✅ On the 1-hour chart, gold shows a clear short-term rebound correction.
Price has broken above MA5 and MA10 and is holding above the short-term moving averages, indicating strengthening rebound momentum.
The upper resistance comes from the Bollinger upper band at 4075–4078, an area where gold has repeatedly been rejected.
MA20 (around 4036–4040) has shifted from resistance to short-term support.
As long as this level holds, the 1-hour structure still has room to extend the rebound.
Long lower wicks and concentrated trading around 4050–4060 suggest that buyers are trying to establish a short-term base.
However, the short-term rebound has not changed the bigger bearish structure.
If gold fails to break through 4075–4080, the rebound may end and the price could return to its bearish rhythm.
🔴 Resistance Levels: 4075–4080 / 4100–4108 / 4150
🟢 Support Levels: 4036–4040 / 4000–3997 / 3953
✅ Trading Strategy Reference
🔰 Strategy 1 — Look for short positions near resistance (trend-following):
If gold rebounds to 4075–4080 and shows rejection:
Consider taking light short positions
Stop Loss: above 4088
Targets: 4050 → 4035 → 4000
👉 This zone combines multiple moving-average resistance and the Bollinger upper band, making it a high-probability area for trend-following shorts.
🔰 Strategy 2 — Short-term long positions from support (countertrend, light positions):
If gold pulls back to 4035–4040 and stabilizes:
Consider a short-term long position
Stop Loss: below 4030
Targets: 4060 → 4075
👉 This is only a corrective rebound trade — not suitable for large positions.
🔰 Strategy 3 — If gold breaks below 4000, downside may accelerate:
A break below 3997–4000 could trigger a stronger sell-off, with targets toward:3953 → 3920
✅ Summary
Gold remains in a bearish, downward-dominated structure, and the current rebound is still a weak correction.
As long as the price remains suppressed below 4080–4100, the bearish trend remains intact.

gold in sellif gold get +50 place buy limt on recent low with 50+ point now in supply zone +48 only in buy and -8 point drop so place sell with small lot

LiamTrading – XAUUSD H1 | Gold on a downward trend, hitting...💛 LiamTrading – XAUUSD H1 | Gold on a downward trend, hitting strong support around 4005 🎯
Gold has plunged from its peak, currently “visiting” the 4005–3990 zone, where trendline + POC/OB + large liquidity converge. This is a zone with potential for a technical rebound, but the short-term trend remains bearish, so all BUY orders need clear confirmation.
🔍 Fundamental Analysis
Goldman Sachs forecasts that during 2025–2026, central banks will purchase an average of ~80 tons of gold per month, a significant driver that could propel gold towards $4,900/oz by the end of 2026.
This keeps the long-term trend for gold bullish, but in the short term, deep corrections like the current one are normal to “shake out” positions before big money returns.
📊 Technical Analysis
Current trend:
H1 is still in a short-term downtrend phase (lower high – lower low), with prices below the 4080–4100 resistance zone and the nearest descending trendline.
Main support zones:
4005–3990: intersection of long-term ascending trendline, POC – OB, old VAH/VAL zone → critical support, potential for bottom-fishing buying force.
3975–3977: deeper support, coinciding with liquidity zone & recent bottom.
Key resistance zones:
4098–4100: confluence of resistance + trendline test → prime zone to watch for SELL retracement.
Above is the cluster 4011 – 4053 – 4077 – 4098–4100 acting as “steps” for scalping orders.
Volume Profile:
Heavy trading volume around the 4000–4020 zone → prices tend to revisit this area multiple times before leaving.
🎯 Suggested Trading Scenarios
SELL – following the downtrend (priority)
Entry: 4098–4100
SL: 4105
TP: 4082 → 4060 → 4035 → 4012
Price retraces to resistance + descending trendline.
Only activate when M15–H1 shows clear rejection candles (pin bar/bearish engulfing) around 4098–4100.
BUY – catching the rebound at strong support
Entry: 3975–3977
SL: 3970
TP: 3995 → 4025 → 4050 → 4080
Confluence support zone at channel bottom + POC/OB + liquidity.
Only BUY with strong rejection or clear reversal pattern (M15–H1).
⚠️ Price zones to watch for scalping
4011 – 4053 – 4077 – 3939
These zones are suitable for short scalps, prioritizing the main trend (currently bearish), quick exits – do not hold positions too long.
🧠 Risks & Invalidation
H1 closes above 4105 → reduces SELL priority, wait for new structure.
H1 closes below 3970 → unfavorable structure for BUY side, potential for further decline to lower zones.
Are you watching to BUY or SELL gold in this zone?
👉 Comment your perspective & Follow LiamTrading channel for daily XAUUSD plans.

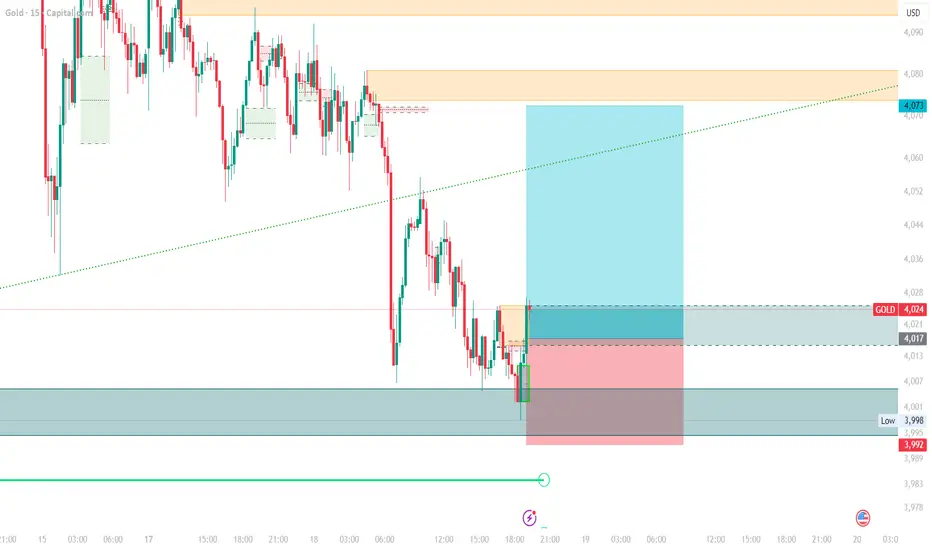
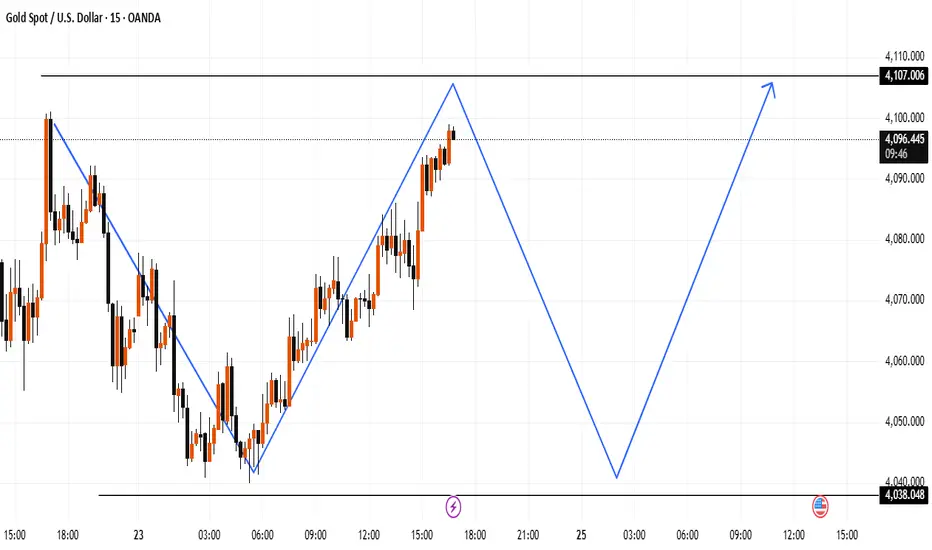
XAUUSD – Potential Reversal Zone and Structural ProjectionThis chart highlights a possible short-term completion of the current upward leg, followed by a deeper corrective move toward the lower support zone near 4038, before a potential bullish continuation toward the 4107 area.
The projection is based on simple market structure:
Price has reached a previous reaction zone.
A corrective wave may form if rejection appears.
A new impulse could develop from the lower support level.
GOLD at Cut n Reverse Support? Major Bottom? holds or not??#GOLD perfect move as per our last idea regarding gold and now market just near to his current supporting area that is around 4040-50
that is market major supporting area and market holds in morning as well.
keep close that area and keep in mind that is our major and cut n reverse area.
don't be lazy here and stay sharp ..
NOTE: we will go for cut n reverse below 4045 on confirmation.
good luck
trade wisely

Conflicting Geopolitical Signals Hold Gold in ConsolidationGold’s safe-haven appeal has always been closely tied to geopolitical risks, and this week’s global developments show a clear split in market sentiment. On one side, early signs of potential peace in the Russia–Ukraine conflict have slightly reduced safe-haven demand. On the other, escalating tensions in the Middle East are injecting fresh uncertainty into the market. This “push-and-pull” dynamic has kept gold in a delicate state of short-term stabilization.
Looking ahead, gold’s direction will largely depend on how these events evolve:
If Russia–Ukraine negotiations progress smoothly, safe-haven flows may ease further, putting short-term downward pressure on gold.
If the talks break down, safe-haven buying could quickly return, potentially driving prices higher.
If Middle East tensions worsen, disruptions to global energy supplies may lift inflation expectations, indirectly supporting gold.
On the policy front, Williams's remarks led the market to raise its expectations for a rate cut again, but hawkish officials also emphasized the need to maintain current interest rates for some time, and further signals need to be monitored.
Meanwhile, if equity markets continue rising on stronger risk appetite, capital could shift away from gold, adding some downside pressure. Weak physical gold demand across major Asian markets last week has also limited gold’s rebound potential. With Thanksgiving approaching, volatility may diminish unless major news breaks, keeping gold largely range-bound.
Technically, on the 1H and 2H charts, gold remains suppressed by the MA10. The recent large bearish candle cutting through short-term moving averages reflects a short-term bearish setup. Key support lies at the 4020–4000 zone, while resistance sits at 4069–4076, followed by the 4100 level.

sell and short area for long term short setupone hour sell area for short, maybe long term. all signals are sell oriented, make sure you have your own idea and trade, I am not responsible for any trade taken according to my setup.

Gold Buy-Stop Trade Setup, Going To Test ResistanceGold is making Bullish Trend on 1H Timeframe. It can likely go upward to test its resistance.
We can take a 1:1 Buy-Stop Trade here.

Gold sell at SBR 15m 15m TF SBR Zone sell 4065 - 70
TP 4058 - 4054 - 4048
monitoring downward trendline 2nd tap 4095 plus resistance pushed price succesfully downwards targeting HTF 4h ascending trendline 4tap 4020s , educatinal post
This is not a financial advice

Gold price analysis November 20Gold continues to show a solid reaction at the main trendline, indicating that the bullish structure is still maintained by organized buying. The market's continued respect for this support line is an important signal, keeping the possibility of extending the trend to the 4200 zone high.
However, it is important to note: a H4 candle closing below the trendline will be the first sign confirming the weakening of the bullish momentum. At that time, the balance of forces will tilt towards the sellers and the price may correct deeply to the 3936 zone - the confluence of the next strong support.
Recommended strategy:
Activate BUY when the market shows a price rejection signal at 4041.
Profit target: 4200.
Risk management: H4 closes below 4041 → switch to SELL strategy, aiming at 3936.

