Lingrid | GOLD Key Confluence Zone -Long OpportunityOANDA:XAUUSD is testing the confluence support after completing a clean pullback from the previous weekly high (PWH) and the resistance zone. The market structure shows price reacting along the channel border while holding above the broader triangle breakout region and key psychological level at 4,000. If buyers defend 4,000 once again, a recovery becomes the primary scenario as bullish momentum attempts to rebuild. Price action continues to follow a higher-low pattern that supports a renewed upside push if the support floor remains intact.
⚠️ Risks:
A decisive break below channel may shift momentum toward the deeper support zone near 3,900.
Strong USD flows or unexpected macro data could limit upside recovery attempts.
Failure to maintain the higher-low structure may weaken the bullish rebound setup.
If this idea resonates with you or you have your own opinion, traders, hit the comments. I’m excited to read your thoughts!
Trade ideas

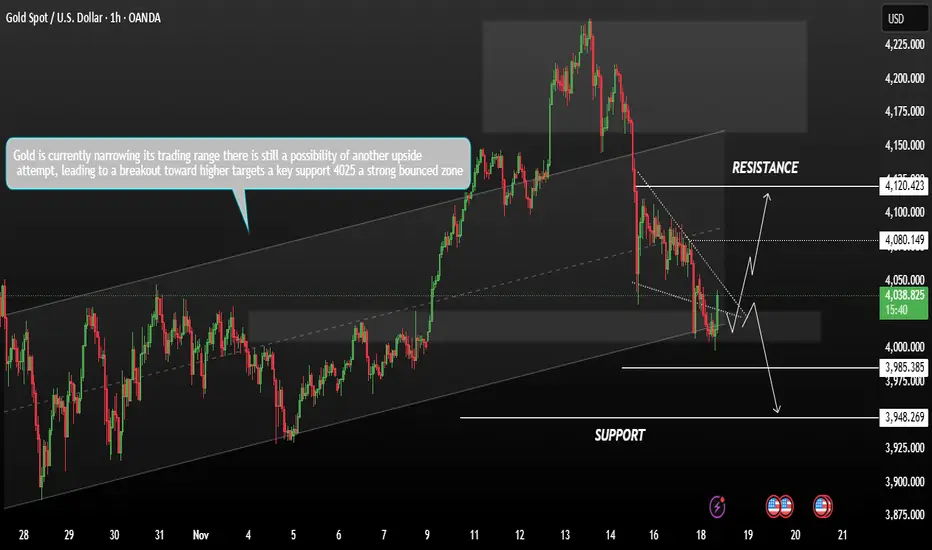
Gold Price Scenario trading range What should next ?Gold is currently narrowing its trading range and forming a triangle pattern, indicating a potential breakout setup on Tuesday, gold extended its decline, pressured by a strong U.S. dollar and reduced expectations of a Federal Reserve rate cut next month.
At the moment, gold remains in a consolidation phase as investors wait to see whether bullish momentum can continue if buyers regain control, and price breaks above the consolidation zone, the next resistance levels are expected at 4080 – 4120.
However, if price breaks below the support at 4025, this may signal renewed bearish momentum, with a psychological downside target zone of 3985 – 3948 as long as gold holds within the current range, there is still a possibility of another upside attempt, leading to a breakout toward higher targets.
You may find more details in the chart,
Trade wisely best of luck buddies.
Ps; Support with like and comments for better analysis Thanks for Supporting.
XAUUSD: Buyers Aiming for a Rebound Toward $4,170 ResistanceHello everyone, here is my breakdown of the current Gold setup.
Market Analysis
XAUUSD continues to trade within a corrective structure, forming a broad Triangle Pattern defined by the Triangle Resistance Line above and the Triangle Support Line below. After a strong impulsive rally earlier, gold entered a prolonged consolidation phase, highlighted by a clear Range Zone where price repeatedly tested both the upper and lower boundaries without establishing a directional breakout. Several Breakouts occurred during this period, but each bullish attempt failed to secure continuation, leading to pullbacks that kept the market inside the broader consolidation. This showed clear indecision and a balanced battle between buyers and sellers.
Currently, gold retested the Support Zone around $4,040–$4,060, which coincides with the Triangle Support Line. A fake breakdown occurred below this level, but the market quickly bounced back, confirming strong demand and rejecting the bearish attempt. This rebound signals that buyers are actively defending the structure. Price is now stabilizing above support and showing early signs of bullish pressure. If buyers maintain control, the next logical target becomes the major Resistance Level at $4,170, which has acted as a key cap on previous bullish attempts. As long as XAUUSD stays above the Support Zone and trades within the rising trendline structure, the overall market bias remains moderately bullish.
Scenario & Strategy
I expect gold to gradually move upward from the current support area and retest the $4,170 Resistance Level. Minor corrections may occur along the way, but as long as price holds above $4,040, the bullish scenario remains valid. A clean breakout above $4,170 could trigger a stronger bullish continuation toward the next supply zone.
However, a breakdown below the Support Zone and Triangle Support Line would invalidate the bullish scenario and open the way for deeper correction. For now, buying the dips remains the more favorable approach as long as gold respects demand and stays within the triangle structure.
That's the setup I'm tracking. Thank you for your attention, and always manage your risk.

Is Gold About to Fall? Strong USD Pressures XAUUSD DownThe gold market is entering a sensitive phase as buying momentum gradually weakens, while the USD strengthens again following a series of positive economic releases . There is a sense of “calm before the storm”, and XAUUSD is now tilting toward a bearish direction.
U.S. data shows a clear recovery in the labor market: NFP surged far above expectations , hourly earnings remained stable, and the Fed is expected to maintain a cautious stance. These factors combined have boosted the USD , putting direct pressure on gold.
From a technical perspective, XAUUSD keeps getting rejected at the 4,080 resistance zone . A rounding-top pattern is forming, Ichimoku signals are weakening, and each rebound is becoming smaller. The 4,000 support level has been tested repeatedly , suggesting a rising probability of a breakdown.
If price fails to break above 4,080, gold may continue pulling back toward 4,000, and could even extend the decline to 3,930, the next major support zone. This remains the most reasonable scenario as both fundamentals and technicals align to the downside.

Smart Money Liquidity Trap Explained⭐ Smart Money Liquidity Trap Explained
✨ A deep dive into how institutions manipulate price before major moves ✨
In every financial market — Forex, Crypto, Stocks, Indices — price doesn’t simply move at random. Behind the scenes, Smart Money (institutions, banks, hedge funds) engineer setups that allow them to enter positions at the best possible price. One of their most effective tools is the Liquidity Trap.
Let’s break it down beautifully and clearly. 👇
🔥 What Is a Liquidity Trap?
A Liquidity Trap occurs when Smart Money deliberately pushes price into areas loaded with:
❌ Stop-loss orders
📉 Sell-side liquidity
📈 Buy-side liquidity
😰 Emotional retail entries
🔥 Breakout traders placing pending orders
These areas become liquidity pools — perfect fuel for institutions to fill their massive positions.
Retail traders think it’s a breakout…
But Smart Money thinks:
➡️ "Thank you for the liquidity."
🧩 How Smart Money Creates the Trap
1️⃣ Phase 1: Build the Setup
Smart Money guides price slowly toward an obvious level:
A clean high
A clean low
A trendline
A double top/bottom
Retail traders get excited:
📢 “Breakout coming!”
But institutions are simply gathering attention.
2️⃣ Phase 2: The Liquidity Grab ⚡
Price spikes violently above/below the obvious level.
This move triggers:
🟥 Stop-loss hunts
📉 Forced liquidations
💥 Breakouts that fail instantly
This sudden spike gives institutions the liquidity needed to place large buy or sell orders without causing massive slippage.
This is why the spike is often fast and dramatic.
3️⃣ Phase 3: The Real Move Begins 🚀
After the liquidity is collected, price reverses sharply.
This is the moment Smart Money actually commits to the real direction.
Retail traders feel:
🤯 “Why did it reverse?!”
😭 “I got stopped out for nothing!”
😵 “The breakout was fake!”
But Smart Money simply executed their strategy perfectly.
🎯 How to Use Liquidity Traps in Your Trading
Study where retail traders commonly place:
⛔ Stops
📌 Breakout orders
❗ Predictable entries
Then wait for the fast liquidity grab followed by:
A displacement 🎇
A sharp wick rejection
A structure shift (CHoCH / BOS)
These signals often reveal the true direction of the upcoming move.
💡 Key Features of a Smart Money Liquidity Trap
✨ Sudden spike into obvious areas
✨ Fast liquidation and stop-hunting behavior
✨ Sharp wick rejections
✨ Structure shift after the spike
✨ Smooth continuation in the real direction
🚀 Why This Concept Is So Powerful
Recognizing liquidity traps allows you to:
❌ Avoid fake breakouts
🛡️ Protect yourself from stop-hunts
🎯 Enter the market at premium/discount levels
🤝 Align with Smart Money
💼 Improve long-term consistency
This is how professional traders stay on the right side of volatility — by understanding why the market moves, not just where it moves.

GOLD 4H CHART ROUTE MAP UPDATE & TRADING PLAN FOR THE WEEKHey Everyone,
Please see our updated 4h chart levels and targets for the coming week.
We are seeing price play between two weighted levels with a gap above at 4124 and a gap below at 4042. We will need to see ema5 cross and lock on either weighted level to determine the next range.
We will see levels tested side by side until one of the weighted levels break and lock to confirm direction for the next range.
We will keep the above in mind when taking buys from dips. Our updated levels and weighted levels will allow us to track the movement down and then catch bounces up.
We will continue to buy dips using our support levels taking 20 to 40 pips. As stated before each of our level structures give 20 to 40 pip bounces, which is enough for a nice entry and exit. If you back test the levels we shared every week for the past 24 months, you can see how effectively they were used to trade with or against short/mid term swings and trends.
The swing range give bigger bounces then our weighted levels that's the difference between weighted levels and swing ranges.
BULLISH TARGET
4124
EMA5 CROSS AND LOCK ABOVE 4124 WILL OPEN THE FOLLOWING BULLISH TARGETS
4212
EMA5 CROSS AND LOCK ABOVE 4212 WILL OPEN THE FOLLOWING BULLISH TARGET
4328
EMA5 CROSS AND LOCK ABOVE 4328 WILL OPEN THE FOLLOWING BULLISH TARGET
4422
EMA5 CROSS AND LOCK ABOVE 4422 WILL OPEN THE FOLLOWING BULLISH TARGET
4494
BEARISH TARGETS
4042
EMA5 CROSS AND LOCK BELOW 4042WILL OPEN THE FOLLOWING BEARISH TARGET
3964
EMA5 CROSS AND LOCK BELOW 3964 WILL OPEN THE FOLLOWING BEARISH TARGET
3873
EMA5 CROSS AND LOCK BELOW 3873 WILL OPEN THE SWING RANGE
3767
3646
As always, we will keep you all updated with regular updates throughout the week and how we manage the active ideas and setups. Thank you all for your likes, comments and follows, we really appreciate it!
Mr Gold
GoldViewFX

Lingrid | GOLD Possible Long Opportunity At Channel FloorOANDA:XAUUSD perfectly played out in my previous idea. Price is pulling back toward the key 4,000 support zone after failing to hold above the mid-range level near 4,130, where sellers re-entered the market. The structure still respects the ascending trendline, forming a sequence of higher lows that keeps the broader bullish outlook intact. If buyers defend the 4,000–4,025 zone again, a rebound toward 4,145 becomes the primary scenario as demand builds at trendline support. The broader momentum continues to favor upside continuation as long as the higher-low structure remains unbroken.
⚠️ Risks:
A decisive break below 4,000 may trigger deeper downside toward 3,892.
Strong USD momentum could suppress bullish attempts and delay any rebound.
Failure to form a clean rejection candle at support may signal ongoing consolidation instead of a renewed rally.
If this idea resonates with you or you have your own opinion, traders, hit the comments. I’m excited to read your thoughts!

THE KOG REPORTTHE KOG REPORT:
In last week’s KOG Report we gave the potential path as well as the red box defence to look for any reaction in price. We managed to support the lower red box defence giving us a nice long to start the week then resulting in the higher defence holding and giving us an extremely decent short. It was only during the later part of the week we faced some choppy and whipsawing ranging which we decided wasn’t worth committing too much into, so we returned to scalping the red boxes only for the remainder of the week.
A decent week in Camelot, not only on Gold but the numerous other pairs we trade and analyse.
So, what can we expect in the week ahead?
It’s likely to be another week of choppy price action and potential for a range to develop even smaller than we’ve seen in previous sessions. We have the key level of support below again at 4040 while resistance above sits at key level of 4104. Economic news on Tuesday should bring volume and we would expect one of these levels to break open and the range to have accumulated enough to then move us into a clear direction.
We have added the red box defence up and down, ideally wanting a test of that low, so price going up on the open could represent opportunities to attempt the short unless defence is breached. Otherwise, we’ll look to take this into that 4000-3980 levels before we look for any RIPs.
RED BOXES:
Break below 4060 for 4055, 4050, 4041, 4033 and 4010 in extension of the move
Break above 4081 for 4095, 4103, 4120 and 4130 in extension of the move
Please do support us by hitting the like button, leaving a comment, and giving us a follow. We’ve been doing this for a long time now providing traders with in-depth free analysis on Gold, so your likes and comments are very much appreciated.
As always, trade safe.
KOG

GOLD H1 – Hawkish Fed Pressure Ahead of Key NFP Data🟡 XAUUSD – Intraday Smart Money Plan | by Ryan_TitanTrader (18/11)
📈 Market Context
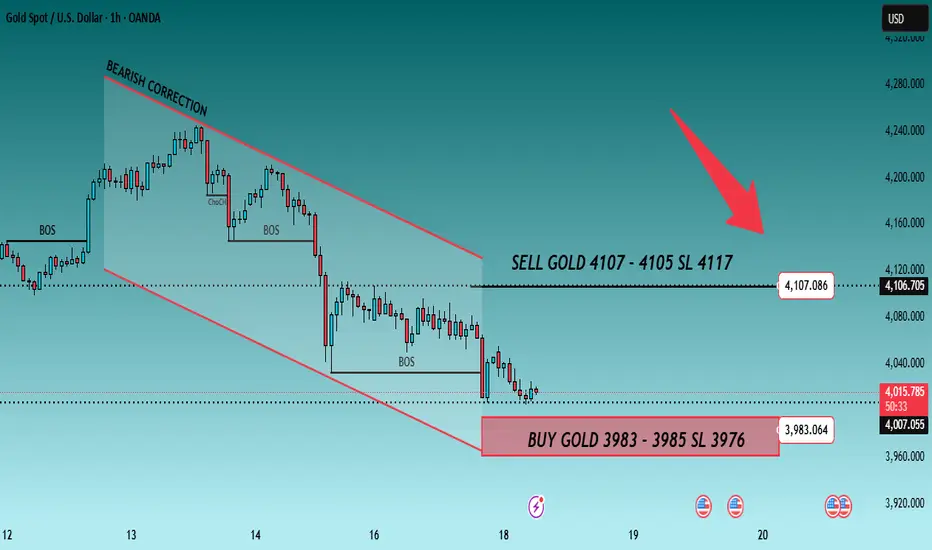
Gold is trading inside a bearish corrective channel as markets react to hawkish Federal Reserve commentary and positioning ahead of this week’s U.S. NFP data.
• Fed officials signaled a stronger stance against premature rate cuts, keeping USD supported and limiting gold’s upside.
• Price continues to hover near $4,080, reflecting uncertainty as traders balance Fed tone with upcoming labor-market reports.
Institutional order flow shows controlled downside pressure, with engineered liquidity sweeps forming around both channel extremes.
🔎 Technical Analysis (1H / SMC Structure)
• Structure: Price remains inside a Bearish Correction Channel, creating consecutive BOS points, confirming distribution.
• Premium Sell Zone: 4107–4105 aligns with a previous mitigation block + internal liquidity.
• Discount Buy Zone: 3983–3985 sits at the lower boundary of the channel + liquidity sweep zone.
• Liquidity:
→ Buy-side liquidity above 4107 (clean equal-high pocket).
→ Sell-side liquidity resting around 3985–3976, where prior long positions were removed.
🔴 Sell Setup (Premium Reaction Zone)
• Entry: 4,107 – 4,105
• Stop-Loss: 4,117
• Take-Profit Targets:
→ 4,060 (minor imbalance fill)
→ 4,030 (BOS retest)
→ 3,985 (discount zone)
📌 Execute only after a liquidity sweep into the zone + bearish BOS on M5–M15.
🟢 Buy Setup (Discount Reaction Zone)
• Entry: 3,983 – 3,985
• Stop-Loss: 3,976
• Take-Profit Targets:
→ 4,030 (short-term structure high)
→ 4,060 (inefficiency midpoint)
→ 4,105 (premium retest)
📌 Valid if price taps channel low + shows bullish displacement.
⚠️ Risk Management Notes
• Expect volatility as markets digest hawkish Fed remarks before NFP.
• Avoid entering trades inside the 4020–4070 chop region without clear BOS.
• Reduce position size during news hours.
• Trail stops once price clears each liquidity pocket.
📝 Summary
Gold remains pressured by Fed rhetoric, but liquidity is building at both extremes.
• Sell Zone: 4107–4105 (premium mitigation area)
• Buy Zone: 3983–3985 (discount liquidity sweep)
Price is likely to form a manipulation → reaction → continuation pattern within the channel.
📍 Follow @Ryan_TitanTrader for more Smart Money updates ⚡
🎁 More insights & gifts on my TradingView profile.
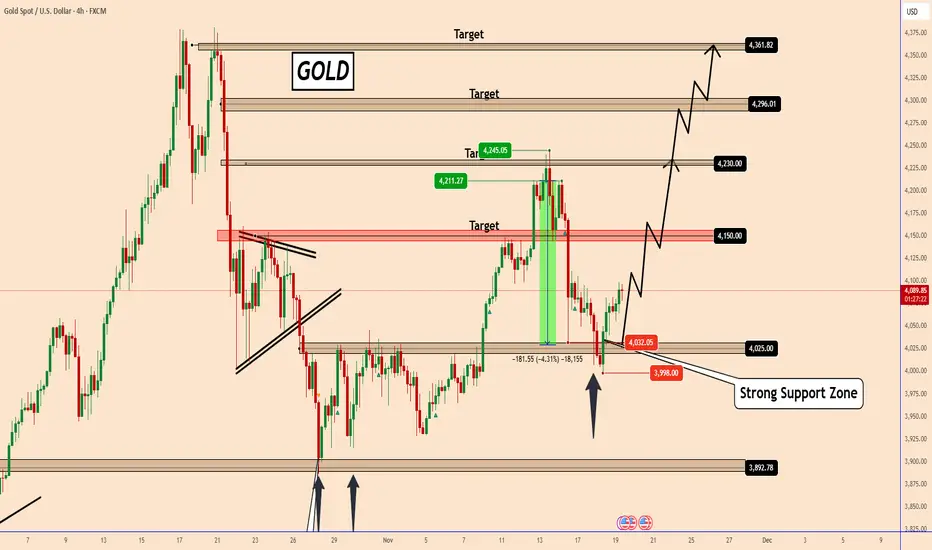
GOLD Forming Bullish Structure Above 4000 SupportGOLD Forming Bullish Structure Above 4000 Support
GOLD remains supported above the strong demand zone near 3998–4032, where price has shown repeated bullish reactions in the past. The market recently tapped this zone again and is attempting to stabilize.
As long as the structure holds above this key support zone, the probability favors a renewed bullish leg targeting:
4150
4230
With extension levels at 4290 and 4360 if momentum accelerates
A break below 3998 would invalidate the bullish scenario; however, for now, price action continues to respect the support area, suggesting that buyers may attempt to reclaim higher levels.
You may find more details in the chart!
Thank you and Good Luck!
❤️PS: Please support with a like or comment if you find this analysis useful for your trading day❤️
XAUUSD: Price Holds Triangle Support, Aiming for $4,120Hello everyone, here is my breakdown of the current Gold setup.
Market Analysis
XAUUSD is trading within a broad symmetrical triangle structure, where price continues to respect both the Triangle Resistance Line and the Triangle Support Line. After a strong bullish rally inside the Upward Channel earlier, Gold reached the Resistance Area around $4,120–$4,130, where a sharp reversal occurred. This zone has consistently acted as a major supply level, triggering multiple corrections in recent sessions. Following the breakout below the Upward Channel, XAUUSD entered a consolidation phase supported by the Support Zone near $4,000, which aligns with the lower triangle boundary. This level has proven to be a key reaction zone, showing strong buyer interest each time price tested it.
Currently, Gold attempted another bullish push after bouncing from the Triangle Support Line. Price is now approaching the Resistance Area once again, but buyers face strong selling pressure around $4,080–$4,120, which overlaps with both horizontal resistance and the descending triangle boundary. A break and close above the Triangle Resistance Line would confirm bullish continuation and likely lead to a retest of higher liquidity levels near $4,180–$4,200. As long as XAUUSD stays above the $4,000 Support Zone, the broader structure remains bullish. However, sustained failure to break the resistance area may result in another corrective move back toward the Triangle Support Line.
My Scenario & Strategy
From my perspective, as long as Gold holds above $4,000, the bullish bias remains intact.
My near-term target (TP1) is the $4,120 Resistance Area, with potential extension toward $4,160–$4,200 if buyers manage a clean breakout above the triangle resistance. I will look for long entries on pullbacks toward the Triangle Support Line or the Support Zone around $4,000–$4,020, especially if bullish rejection patterns appear.
If XAUUSD breaks below the $4,000 level, the bullish setup becomes invalid and deeper correction toward $3,960–$3,920 may follow. For now, price action favors a bullish continuation setup, provided support continues to hold.
That's the setup I'm tracking. Thank you for your attention, and always manage your risk.

The Arena of XAUUSD-GOLD: New Round BeginsMy friends, Good Morning,
I have prepared a gold analysis for you in a swing trading structure.
The timeframe of this analysis is 4 hours.
In my XAUUSD-GOLD analysis, I will open sell positions between 4124.0 and 4176.0.
My targets are: TP1 - 3995.0 and TP2 - 3969.0.📊
This analysis is purely for your information.
To my friends who support each of my analyses with their likes,
I share these analyses thanks to your likes, because every single like from you is my greatest source of motivation to keep posting.
I sincerely thank all my friends who leave a like. 🙏
With respect and love.❤️

Lingrid | GOLD Range Bound Resistance - Potential RejectionThe price perfectly fulfilled my previous idea . OANDA:XAUUSD is moving toward edge of the resistance zone after bouncing off support 4,000 region. Price action remains corrective, with price trading inside a wider consolidation and reacting to both the downward trendline and the mid-range level. If the market stays capped below 4,130, a move back toward 4,045 becomes the likely scenario as sellers regain short-term momentum. The broader pattern continues to reflect a compressing market where bearish reactions inside resistance are still dominant.
⚠️ Risks:
A breakout above 4,130 would invalidate the short-term bearish projection and open the way toward 4,245.
US macro data like FOMC could drive gold sharply higher against the structure.
Failure to sustain momentum below mid-range levels may lead to deeper consolidation instead of a clean drop.
If this idea resonates with you or you have your own opinion, traders, hit the comments. I’m excited to read your thoughts!

Don't Trade These Trend Lines. Forex Gold Trading Basics
A lot of traders apply trend lines for trading and making predictions on different financial markets.
Trend line can also be an important element of price action patterns.
However, only few knows that some trend lines are better to be avoided .
In this article, I will share with you the types of trend lines that you should avoid and not rely on for making trading decisions.
Invalidated Trend Line
Even the strongest trend lines may lose their significance with time.
Before you take a trade from a trend line, make sure that it still remains valid.
If the trend line is not respected by the buyers and then by the sellers,
or by the sellers and then by the buyers, we say that such a trend line lost its significance, and it is better to not trade it.
Have a look at that rising trend line on USDCAD.
We see strong bullish reactions to that, and we may expect a bullish movement from that, once it is tested.
However, it was violated and after a breakout it should turn into a vertical resistance.
Retesting that, the price easily went through the broken trend line.
The trend line lost its significance, and it is better to not trade that in the future.
2 Touches Based Trend Line
When you are looking for a strong trend line to trade, remember that the trend line should be confirmed by at least 3 touches and 3 consequent bullish / bearish reactions to that.
Above is the example of a valid and reliable trend line.
However, quite often, newbie trade 2 touches based trend lines.
Most of the time, such trend lines are neglected by the market.
Moreover, relying on 2-touches-based trend lines, your chart will look like a complete mess .
Simply because there are too many trend line meeting that criteria.
Receding trend line
There are the trend lines that go against your trade with time while remaining valid.
Have a look at a major falling trend line on NZDCHF on a daily time frame.
You may open a swing long position from that on a daily or a day trade on intraday time frames like an hourly.
You can see that the market may easily go against your predictions for a long time, while perfectly respecting a trend line.
The price was sliding on that trend line for 6 consequent days before it finally started to grow.
Such trend lines are better to be avoided .
Make sure that a trend line and your trade have the same direction.
Trend lines can provide very safe points for trading entries. However, the trend lines are not equal and while some of them can be very profitable, some of them can lead to substantial losses.
❤️Please, support my work with like, thank you!❤️
I am part of Trade Nation's Influencer program and receive a monthly fee for using their TradingView charts in my analysis.

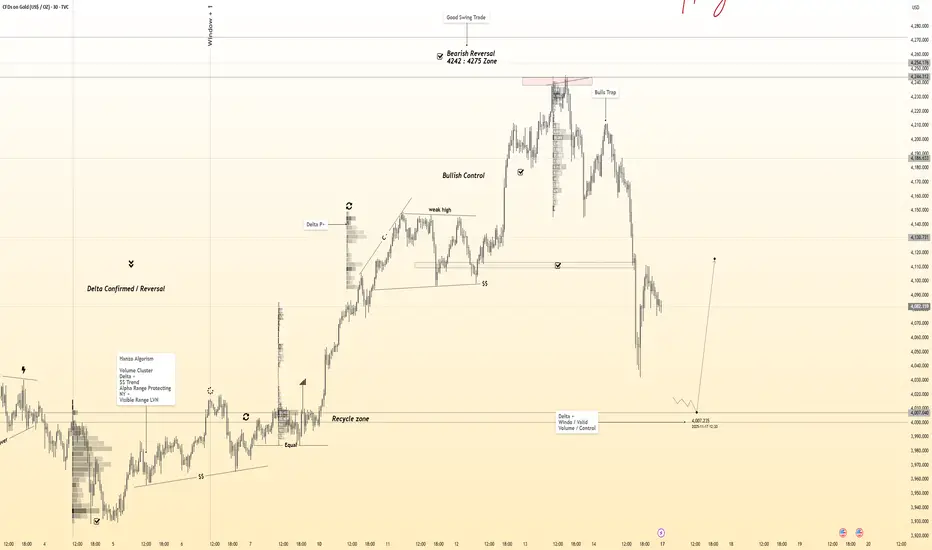
Gold 30-Min — Volume Buy Reversal Triggered⚡Base : Hanzo Trading Alpha Algorithm
The algorithm calculates volatility displacement vs liquidity recovery, identifying where probability meets imbalance.
It trades only where precision, volume, and manipulation intersect —only logic.
✈️ Technical Reasons
/ Direction — LONG / Reversal 4005 Area
☄️Bullish momentum confirmed through strong candle body.
☄️Structure shifted with higher-low near key demand base.
☄️Volume expanding confirms order-flow alignment upward.
☄️Buyers reclaimed imbalance with sustained clean break.
☄️Algorithm detects rising momentum under low liquidity.
⚙️ Hanzo Alpha Trading Protocol
The Alpha Candle defines the day’s real control zone — the first battle of momentum.
From this origin, the Volume Window reveals where the next precision strike begins.
⚙️ Hanzo Volume Window / Map
Window tracked from 10:30 — mapping true market behavior.
POC alignment exposes institutional bias and breakout potential zones.
⚙️ Hanzo Delta Window / Pulse
Delta window monitors real buying vs. selling power behind each move.
Tracks volume aggression to expose who controls the candle — buyers or sellers.
When Delta aligns with Volume Map, momentum becomes undeniable.
XAUUSD (Gold) Retest setup from Demand zoneXAUUSD (Gold) showing downtrend approaching a marked demand zone with projected bullish arrows indicating a possible reversal and target level above.
The chart price moving with downtrend into labled demand zone. The chart includes BOS and CHOCH markers indicating structure breaks. Two projected arrows suggests a potential bullish reversal from demand zone, aiming toward a marked target level above.

XAUUSD: Double Flag Setup, but with a "Warning"Things could get interesting this week.
In my previous analysis, I pointed out a big flag structure, with a smaller flag forming on top of it. But for the bullish scenario to actually happen, that second flag needs to break to the upside with strength…
THE PROBLEM? This retracement is already deeper than I’d personally like to see in a healthy bullish flag. The deeper it pulls back, the more it signals uncertain buyers, and this can create a DOMINO effect. When buyers can’t defend higher levels, it tells you something simple: if buyers hesitate, breakouts don’t sustain, they fake out, or get dragged right back into the range.
So until it breaks cleanly above that mini-flag structure, there’s no real trigger. This is the zone where patience matters. If buyers want to really reclaim back control, we need to see a clean, big breakout of the mini flag, not just a wick, not just a tease. Ideally a break with volume, closed above it.
If that breakout happens, I anticipate price could reach 4,300 with ease. But if it breaks below the lower trendline, the whole scenario gets invalidated, that deep retracement will no longer be a “pullback,” it will be the beginning of a shift.
So for now: wait for clarity. No breakout, no trade.

Gold Dancing Around 4050– Will the Market Rhyme With Last Month?1. Recap of Last Week’s Price Action
Last week started with a fake attempt at recovery:
Gold reversed early in the week back above 4100, reaching a local high around 4133.
From there, sellers stepped back in and pushed the price lower, bringing us once again into the familiar 4050–4100 range I have been talking about for days.
On Friday, we had a classic whipsaw:
- Price dipped below 4050 support,
- Then reversed sharply and tested 4100 resistance again,
- Only to close the day slightly above support, right back inside the range.
Today, during the Asian session, selling pressure returned and Gold is trading below 4050 support once again. The market is still orbiting this key zone like a magnet.
2. Current Technical Picture – A Heavy Market Hiding Behind a Sideways Range
Right now, the chart shows:
- Well-defined resistance: 4100–4110
- Broken/fragile support: 4050
- Key downside reference: 3900 zone
Even though we are “just” ranging between 4050 and 4100 most of the time, I still see the structure as heavy, not neutral.
The fact that:
- Every bounce above 4100 fails quickly, and
- Every dip below 4050 gets a bit deeper or a bit more frequent,
…suggests that sellers are slowly gaining control, even if there is no clean breakdown yet.
3. Bigger Picture Outlook – Why I Still Expect 3900 📉
My medium-term outlook remains the same:
➡️ I still expect a drop toward the 3900 zone.
Why?
- Failed upside follow-through:
- The reversal back around 4100 looked promising for bulls, but there was no continuation. That kind of failed breakout often precedes a deeper leg down.
Support erosion at 4050:
4050 used to be a clean support. Now it’s constantly pierced, reclaimed, then lost again. When a level is “played with” too much, it often breaks properly later.
Lack of strong bullish candles:
We see bounces, yes, but not the kind of decisive ones that normally start a new leg up.
Because of this, I still see 3900 as the next logical destination once the market finally gives up on this range.
For now, I’m out of the market, waiting patiently to sell rallies, not chase price in the middle.
4. The “Rhyme” With Last Month – A Speculative but Interesting Angle 📅
“Markets don’t repeat, but they often rhyme.”
If we look back at last month’s end-of-month action, there’s an interesting similarity in structure:
- On Thu 23 Oct, we had a low, then a reversal up.
- By Mon 27 Oct, price was back to support around 4050 – yes, the same 4050 zone we’re dealing with now.
- On that Monday, we then got the real break, followed by a 1,500-pip drop into Thu 28 Oct.
Now compare that to the current price action:
- We have a low → bounce → failure → back to 4050 pattern,
- We’re again at (or just under) 4050,
- The broader structure feels like a tired consolidation after an earlier strong move.
Is this a guarantee that we’ll see another sharp fall like last time?
👉 Of course not. This is only speculation and observation.
But the similarity in the structure is worth keeping on the radar, especially considering that:
- We’re again at 4050,
- We’re again in a sideways consolidation after a strong leg down
- And again the market seems to be “deciding” whether to finally break.
If the “rhyme” plays out, we might see:
- A bit more back-and-forth around 4050–4080,
- A clean, decisive break of 4050,
- A more direct move toward 3900 (or even beyond) with less hesitation than now.
5. Trading Plan – What I’m Actually Doing (Not Just Thinking)
Despite the interesting fractal and speculation, my plan stays simple and disciplined:
- I’m currently out of the market – volatility around 4050 is messy.
- I’m looking to sell rallies, especially if we see:
- Price popping back into 4100 area, but failing to hold, or
- Weak, corrective rebounds into resistance after another dip.
I’m not interested in chasing shorts after a big down candle at 4010 or 4000. I want price to come to me, not the other way around.
Target remains: 3900 zone.
If the market gives a similar “impulsive leg” as it did last month, this level can be reached faster than most traders expect.
6. Conclusion – Logic First, Speculation Second
Bias: still bearish.
Key level: 4050 – the market is clearly “fighting” around this line.
Plan: stay patient, sell rallies, target 3900.
The October “rhyme” is just an extra narrative layer – nice to watch, but risk management and levels still come first.
If the market decides to repeat that end-of-month pattern, I’ll be ready. If not, I’ll still trade the levels, not the story. 😊

Gold Roadmap => Short-termGold ( OANDA:XAUUSD ) is currently moving below the Support zone($4,053 – $4,025) , but given the cluster of supports ahead , we can consider this beak is a fake break .
From an Elliott Wave perspective, it seems that gold has completed its wave 5 near the support lines , and we can anticipate a corrective upward movement .
Also, we can observe positive Regular Divergence (RD+) in consecutive valleys.
I expect Gold to rise to the Resistance zone($4,125 – $4,097) in the next step after breaking the Resistance lines and confronting the $4,073 level .
First Target: $4,091
Second Target: $4,113
Stop Loss(SL): $3,987
Please respect each other's ideas and express them politely if you agree or disagree.
Gold Analyze (XAUUSD), 1-hour time frame.
Be sure to follow the updated ideas.
Do not forget to put a Stop loss for your positions (For every position you want to open).
Please follow your strategy; this is just my idea, and I will gladly see your ideas in this post.
Please do not forget the ✅ ' like ' ✅ button 🙏😊 & Share it with your friends; thanks, and Trade safe.

Gold Reaches Exhaustion Zone — Sell Momentum LoadingGold Reaches Exhaustion Zone — Sell Momentum Loading
Gold is showing signs of upside exhaustion, with price repeatedly failing to gain momentum as it approaches the mid-range premium zone near the 4,245 area. The recent structure reflects a market transitioning from short-term recovery into renewed weakness, with each bullish attempt losing strength faster than the previous one.
Order flow remains dominated by distribution behaviour, and the chart signals a potential liquidity sweep followed by a bearish continuation. The projected rejection zone suggests that buyers are running into an area of heavy supply, where institutional activity has previously triggered aggressive downside extensions. Volume distribution across the range also highlights diminishing demand at higher prices, reinforcing the likelihood of a downward rotation.
As the market continues to respect its broader range ceiling, the probability increases for price to revisit deeper value regions. With momentum fading and the current leg showing hesitation, gold is positioned for a potential sell-side move toward lower mean-reversion levels.

THE KOG REPORT - UpdateEnd of day update from us here at KOG:
Yesterday we said we would stick with our view and expect the potential undercut which happened today tapping our defence level nearly to the pip and completing 4040! That long was one of two clean opportunities we got in Camelot to go with the move and carry it upside to where we are now.
For now, we have resistance at the 4180 level with the key level above 4090 and support below 4045-50. We should be in from lower, protected and managed, so nothing to really worry about but to watch where we close
Price: 4041
RED BOXES:
Break above 4049 for 4055✅, 4060✅ and 4077✅ in extension of the move
Break below 4030 for 4020, 4010 and 4006 in extension of the move
As always, trade safe.
KOG

XAU/USD) Bullish trend analysis Read The captionSMC Trading point update
Technical analysis of (XAUUSD) – Bullish Reversal Setup from Demand Zone
1. Key Zone: Strong Demand / Rejection Area
Price has reacted multiple times inside the blue demand zone (around 4040–4035).
This zone aligns with Fibonacci levels (0.705–0.79), strengthening the bullish probability.
Each touch shows buyers stepping in (long wicks + strong rejections).
2. Falling Wedge Breakout
A falling wedge pattern has been broken to the upside.
Price retested the wedge but dropped again to retest deeper inside the demand zone.
A bullish continuation is expected after one more dip into the zone (green arrow).
3. EMAs: Bullish Confluence
EMA 50 and EMA 200 are close, tightening and suggesting a potential trend shift.
Price is expected to bounce off the demand zone and climb above EMAs.
4. Projected Move
After tapping the demand zone, price is expected to:
Break above recent structure highs
Build bullish momentum toward the target point: 4,143.06
SMC Trading point
5. Overall Idea
This setup indicates a bullish continuation forming after a correction.
The blue zone is the high-probability buy zone, and the projected path suggests a move toward 4143 after confirmation.
---
please support boost 🚀 this analysis

Gold Consolidation maintain bullish Structure Gold price recently broke out of consolidation and is now rebounding strongly to the upside.
On Monday, gold held steady as growing expectations of a Federal Reserve rate cut next month supported bullish sentiment, helping offset the pressure from a firmer U.S. dollar.
After a long downside movement, price has bounced aggressively upward, showing strong buying interest Gold is clearly bullish within the current range, and if price holds above the breakout zone, momentum may continue then next resistance will be 4100 to 4132 as long as gold maintains this structure, the bullish outlook remains intact.
You may find more details in the chart,
Trade wisely best of Luck buddies.
Ps; Support with like and comments for better analysis Thanks for Supporting.
