GOLD BOUNCES FROM $4,000 - FOMC MINUTES TODAY!💰 GOLD BOUNCES FROM $4,000 - FOMC MINUTES TODAY! 📈
Current Price: $4,085 - $4,090 🟢
Opening Price: $4,079
Yesterday's Close: $4,066 (+0.56%)
Today's Performance: +0.56% ✅
Status: 🟢 RECOVERY MODE - CRITICAL DAY
🚨 MAJOR EVENT TODAY - FOMC MINUTES! ⚡
THE $4,000 SUPPORT HELD! Gold successfully defended the critical psychological level and is now bouncing. But TODAY is the most important day this week!
What's Happening:
✅ $4,000 Support HELD - Bulls defended successfully!
✅ Morning Star Pattern Formed - Bullish reversal signal at support
✅ FOMC Minutes TODAY - Will determine next major move
✅ NFP Data Thursday - First post-shutdown jobs report
✅ Risk-Off Sentiment - Safe-haven flows supporting gold
✅ Expected to RISE - Analysts forecast upward movement
📊 TECHNICAL ANALYSIS
Market Structure: BULLISH RECOVERY 🟢🟢
Gold has bounced off the ascending trendline AND the $4,000 psychological level - a DOUBLE support confluence! Bulls are back in control short-term.
Key Development: Bulls managed to hold psychological level of $4,005 and formed Morning Star pattern indicating renewed buying activity
Critical Support Levels (Defended!) 🔵
Support 1: $4,050 - $4,060 (Current base - Strong)
Support 2: $4,000 - $4,005 (HELD! Psychological + Trendline)
Support 3: $3,987 - $4,002 (November open)
Support 4: $3,965 (November 6 low)
Support 5: $3,930 (Major support)
Key Resistance Levels (Recovery targets) 🔴
Resistance 1: $4,096 - $4,100 (KEY - 50-day MA + Descending trendline)
Resistance 2: $4,112 - $4,120 (20-day SMA - Strong)
Resistance 3: $4,140 - $4,150 (Major barrier)
Resistance 4: $4,170 - $4,212 (Previous descending trendline)
📈 TECHNICAL INDICATORS
RSI (14): 49 (Neutral - Can move either direction) ⚪
MACD: Rising sharply, approaching zero line (Bullish momentum!) 🟢
MFI: Growing - Liquidity inflow into asset ✅
4H RSI: Bounced up but below 50 (Recovery attempt) ⚡
Moving Averages:
Price broke above 100-day MA ✅
Testing 50-day MA at $4,096 🔴
20-day SMA at $4,112 (Resistance) 🔴
Above ascending trendline ✅
VWAP & SMA20: Aligned with market price - Equilibrium between buyers/sellers
🎯 TODAY'S TRADING STRATEGIES
SCENARIO 1: BULLISH BREAKOUT 🟢 (60% Probability)
On November 20, 2025, price of XAU/USD expected to RISE
IF Gold Breaks Above $4,100:
Break of descending trendline and 50-day MA around $4,096 could open rally toward $4,212
LONG Setup:
Entry: Break and close above $4,100-$4,112
Targets:
TP1: $4,140 📍 (+40 pips)
TP2: $4,170 📍 (+70 pips)
TP3: $4,212 📍 (+112 pips - Previous trendline touch)
Stop Loss: $4,065 (Below support)
Risk/Reward: Excellent 1:3+ ratio ✅
SCENARIO 2: FALSE BREAKOUT / REJECTION 🔴 (30% Probability)
IF Gold Gets Rejected at $4,096-$4,112:
Bulls tried but failed - retest of support coming
SHORT Setup (Scalp):
Entry: Rejection at $4,100-$4,112 (confirmed with bearish candle)
Targets:
TP1: $4,065 📍
TP2: $4,050 📍
TP3: $4,000 📍 (Retest)
Stop Loss: $4,125 (Tight!)
⚠️ WARNING: This is counter-trend - use small positions!
SCENARIO 3: FOMC VOLATILITY 📊 (10% Probability)
IF FOMC Minutes Cause Whipsaw:
Strategy: WAIT for Clear Direction
Let the dust settle after FOMC release
Trade the REACTION, not the news
Entry: After 30-60 minutes of FOMC release
Follow the momentum with trend
💎 BEST TRADE SETUPS FOR TODAY
CONSERVATIVE APPROACH (Highly Recommended!) 🎯
WAIT FOR FOMC MINUTES! Don't trade BEFORE the release.
Setup A - Breakout Play (Preferred):
WAIT for FOMC minutes (Today, US session)
IF gold breaks $4,100-$4,112 with volume
Entry: $4,105-$4,112 (after confirmation)
Target: $4,140 → $4,170 → $4,212
SL: $4,080
Why: Riding institutional momentum
Setup B - Dip Buy:
IF gold pulls back to $4,050-$4,060
Entry: $4,052-$4,060 (on bounce)
Target: $4,100 → $4,120
SL: $4,035
⚠️ DO NOT TRADE during first 30 min after FOMC release! Wait for clarity!
🌍 FUNDAMENTAL ANALYSIS
TODAY'S MAJOR EVENTS 📅
🔥 FOMC MINUTES (US Session - CRITICAL!)
This is THE event today. Will show:
Fed's thinking on December rate cut
Concerns about economy post-shutdown
Inflation outlook
Market waiting for FOMC Minutes release and speech by Fed member John Williams
Thursday: NFP Data (First post-shutdown report)
September NFP expected: +50,000 jobs
Unemployment Rate: 4.3% (forecast)
This could be market-moving!
BULLISH FACTORS ⬆️⬆️
✅ $4,000 Support Held - Technical strength confirmed
✅ Morning Star Pattern - Bullish reversal at support
✅ Risk-Off Sentiment - Stocks falling, gold rising
✅ Softer Treasury Yields - Making gold more attractive
✅ Shutdown Concerns - Economic weakness = gold support
✅ Analysts predict gold may reach $4,456-$4,509 by end November
✅ Central banks targeting 750-900 tonnes purchases for 2025
BEARISH RISKS ⬇️
⚠️ Hawkish FOMC - If minutes show Fed reluctant to cut rates
⚠️ Strong NFP Thursday - Would reduce rate cut odds
⚠️ Resistance at $4,100-$4,112 - Strong technical barrier
⚠️ December Rate Cut Odds - Only 43% (down from 63%)
⚠️ DXY Still Above 99.50 - Dollar maintaining strength
🔥 MARKET SENTIMENT: CAUTIOUSLY BULLISH
What's Different Today:
The $4,000 level held perfectly - this is VERY bullish technically. But FOMC minutes could change everything in minutes!
Analyst Views:
Short-term (Today/Tomorrow):
$4,000 held, bulls need acceptance above $4,100 for rally to gather steam. FOMC minutes will determine direction.
This Week:
Critical - FOMC + NFP data will set tone for rest of November
Month End:
IF recovery continues → $4,200-$4,300 possible
IF rejected at $4,100 → Chop between $4,000-$4,100
💡 PROFESSIONAL GAME PLAN
For DAY TRADERS:
⚡ Wait for FOMC!
Do NOT trade 1 hour before release
Do NOT trade first 30 min after release
After dust settles, trade the direction
Use tight stops (whipsaws common)
For SWING TRADERS:
📊 This is Your Setup!
IF $4,100 breaks with FOMC → GO LONG (hold 3-5 days to $4,170+)
IF rejected at $4,100 → WAIT for next dip to $4,000
Target: $4,212 (1-2 week hold)
For LONG-TERM INVESTORS:
💎 Accumulation Zone
$4,000-$4,080 range is BUYING opportunity
Long-term targets: $4,500-$5,000 (2026)
Strategy: Build position gradually
Vision: Multi-month hold
📅 TODAY'S TIMELINE
Asian Session (Done): Gold bounced to $4,085-$4,090 ✅
European Session (Now): Consolidation before FOMC
US Session: FOMC MINUTES RELEASE 🔥🔥🔥
After FOMC: Big volatility expected - direction determined
Tomorrow (Thursday):
NFP Data (September) - First post-shutdown
This will confirm or reverse today's move
🎬 BOTTOM LINE (TL;DR)
Price: $4,085 (Bouncing)
Bias: 🟢 BULLISH (IF breaks $4,100)
Key Level: $4,100 (Break = Rally | Reject = Chop)
Today's Event: FOMC MINUTES (Trade-defining!)
Best Action: WAIT for FOMC, then trade the breakout
Risk Level: HIGH (Event volatility!)
🔔 THE $4,100 LEVEL - TODAY'S BATTLEGROUND!
IF GOLD BREAKS ABOVE $4,100-$4,112:
✅ Bulls win!
✅ Target $4,140 → $4,170 → $4,212
✅ Possible rally to $4,250+
✅ GO LONG after confirmation
IF GOLD REJECTS AT $4,100:
⚠️ Bulls stall
⚠️ Range between $4,000-$4,100 continues
⚠️ Wait for next setup
⚠️ Don't force trades
FOMC DECIDES EVERYTHING!
📊 Dovish = GOLD UP 🚀
📊 Hawkish = GOLD DOWN/SIDEWAYS 📉
📊 TECHNICAL OUTLOOK
Trend: 🟢 BULLISH (Short-term recovery active)
Momentum: IMPROVING - MACD rising 📈
Support: HOLDING at $4,050-$4,060 ✅
Resistance: TESTING at $4,096-$4,112 🎯
Pattern: Morning Star reversal + Trendline bounce
Next Move: Break $4,112 = UP | Reject = CHOP
Key Technical:
Having bounced off ascending trendline and $4,000, gold broke above 100-day MA and now testing descending trendline/50-day MA confluence
⚠️ RISK MANAGEMENT - FOMC DAY!
✅ Wait for FOMC - Don't guess the news!
✅ Small Positions - Risk MAX 1% (High volatility!)
✅ Wide Stops - Give trades room (40-50 pips)
✅ Quick Profits - Lock gains on FOMC spikes
✅ No Revenge - If wrong, accept and move on
🎯 SWING TRADE SETUPS
Setup A - FOMC Breakout (Recommended):
WAIT for FOMC minutes release
Entry: IF breaks $4,112 (after FOMC)
Target 1: $4,170 (Hold 2-3 days)
Target 2: $4,212 (Hold 5-7 days)
Target 3: $4,250 (Hold 1-2 weeks)
Stop Loss: $4,070
Setup B - Rejection Trade:
Entry: IF rejected at $4,100 (after FOMC)
Target 1: $4,050 (Hold 1-2 days)
Target 2: $4,000 (Hold 2-3 days)
Stop Loss: $4,125
🏆 PROFESSIONAL ANALYSIS SUMMARY
Gold has executed a PERFECT TECHNICAL BOUNCE from the $4,000 psychological level. The formation of a Morning Star candlestick pattern at support is a classic bullish reversal signal.
The Setup:
Price trading at $4,085.62 as of 19.11.2025
Held $4,000 support perfectly (double bottom with trendline)
Now testing critical $4,096-$4,112 resistance zone
FOMC minutes today will determine next major move
Most Likely Scenarios:
Scenario 1 (60%):
FOMC shows Fed concerned about economy → Gold breaks $4,112 → Rally to $4,170-$4,212
Scenario 2 (30%):
FOMC shows Fed staying hawkish → Gold rejected at $4,100 → Range $4,000-$4,100 continues
Scenario 3 (10%):
FOMC very dovish → Gold explodes through $4,212 → $4,250+
The Big Picture:
$4,000 holding is VERY bullish. This was the make-or-break level and bulls defended it perfectly. If FOMC is dovish or neutral, gold has clear path to $4,200+
💪 TRADING PSYCHOLOGY TIP
THE BOUNCE IS HERE!
Yesterday we were at $4,000 and scared. Today we're at $4,085 and hopeful. This is why you MUST have a plan and stick to it. Those who bought at $4,000 yesterday are now profitable. Discipline wins! 🎯
🎓 LESSON: THE MORNING STAR PATTERN
What happened at $4,000:
Day 1: Long bearish candle (fear)
Day 2: Small candle (indecision)
Day 3: Long bullish candle (bulls return)
This is a Morning Star - one of the most reliable bullish reversal patterns! It shows bears exhausted and bulls taking control.
Trading Strategy:
When you see this at major support (like $4,000), it's a HIGH probability long setup!
🔮 FORECAST
Today: FOMC minutes → Breakout $4,112 OR rejection
Tomorrow: NFP data → Confirm today's direction
End of Week: $4,140-$4,170 OR back to $4,000
Next Week: Recovery continues to $4,200+ if $4,100 breaks
Month End: $4,250-$4,300 (IF bullish scenario plays out)
🚨 FOMC MINUTES - WHAT TO WATCH FOR
Dovish Signals (Gold UP 🟢):
Concerns about economic weakness
Mentions of shutdown impact
Opens door to December cut
Worries about labor market
Hawkish Signals (Gold DOWN/FLAT 🔴):
Confidence in economy
Inflation still concerning
No urgency to cut rates
Strong labor market comments
Neutral (Gold CHOP ⚪):
Data-dependent language
Wait-and-see approach
No clear direction
📊 SUPPORT/RESISTANCE SUMMARY
Strong Support: $4,050, $4,000 (CRITICAL)
Weak Support: $4,065, $4,040
Weak Resistance: $4,096, $4,100
Strong Resistance: $4,112, $4,140, $4,170, $4,212
Breakout Level: $4,112 (Game changer!)
Breakdown Level: $4,000 (Would be very bearish)
⚠️ FINAL DISCLAIMER
Today is a high-impact event day. FOMC minutes can cause extreme volatility and rapid price swings. This analysis is for educational purposes only. Never trade the news blindly - wait for confirmation. Use stop losses religiously. Position sizes should be smaller than normal on event days. False breakouts are common immediately after news. The first move after FOMC is often NOT the real move. Past performance does not guarantee future results. Consult a licensed financial advisor before trading.
📱 CRITICAL DAY AHEAD!
💬 FOMC minutes in few hours!
🔔 HIGH volatility expected
⚡ Trade the reaction, not the prediction!
🙏 Be patient, be disciplined!
#Gold #XAUUSD #FOMC #ForexTrading #TechnicalAnalysis #NFP #MorningStar #BullishReversal #EventTrading #RiskManagement #FOMCMinutes #MarketAnalysis #DayTrading #SwingTrading
Trade ideas
A SELL FIRST AND THEN A BUY AFTERWARDS A sell at 4075-80, sl at 4095, tp at 4040, and then
a possible buy from 4038-33, sl at 4020, and it could be the beginning of the major buy because we might not go down below 4000, not saying it will never move below 4000,
but it's looks like 4038-33 has a good chance of starting with the buy , let see what happens by the end of the day, i will update it properly from morning time because it's time to rest.

Gold Technical Analysis: Three Consecutive Bearish Days Confirm Gold Technical Analysis: Three Consecutive Bearish Days Confirm Short-Term Weakness; Short-Selling Strategy Remains Dominant
Market Review: Yesterday, the gold market was generally weak, with prices continuing to decline along the 5-day moving average, showing a clear short-term weakness in its technical pattern. Especially in the early morning hours, gold prices experienced a sharp drop, exacerbating the bearish sentiment, and the daily chart ultimately closed with a medium-sized bearish candlestick with upper and lower shadows. This candlestick pattern reflects the intense struggle between bulls and bears, but ultimately the bears prevailed, pushing prices to a low close.
Technical Analysis:
Daily Chart:
Gold has formed a "three-day bearish" pattern on the daily chart, confirming a short-term weak trend.
The moving average system is bearish, and the price is currently under pressure below the 5-day and 10-day moving averages, with the overall bearish trend remaining unchanged.
The market is expected to further test the lower support level on the daily chart. If this key support level is broken, the downside potential may expand.
Key Levels:
Resistance Levels: 4055 (10-day moving average), 4075, 4095.
Support levels: 4005 (yesterday's low), 3976, 3930 (daily chart lower line).
Trading Logic:
The 10-day moving average (around 4055) has become an important entry point for short positions today. If the price rebounds to this level and encounters resistance, it can be considered a good opportunity to short.
If the price breaks below yesterday's low of 4005, the downside target will further point to the 3976 and 3930 areas.
Trading Strategy:
Short Position Strategy:
Entry Area: Short in batches between 4050-4055, with position size controlled at 20%.
Stop Loss: 4063 (8 points).
Target: 4020-4000, with a further target of 3975 if it breaks down.
Long Position Strategy:
Entry Area: Long in batches between 3975-3980, with position size controlled at 20%.
Stop Loss: 3967 (8 points).
Target: 4000-4010, break above to 4020.
Risk Warning: Market volatility is unpredictable; strategies should be adjusted flexibly based on actual market conditions. Investors should strictly set stop-loss orders, avoid over-leveraging or holding losing positions, and develop trading plans based on their own risk tolerance. Real-time price levels and detailed strategies can be obtained through internal channels.

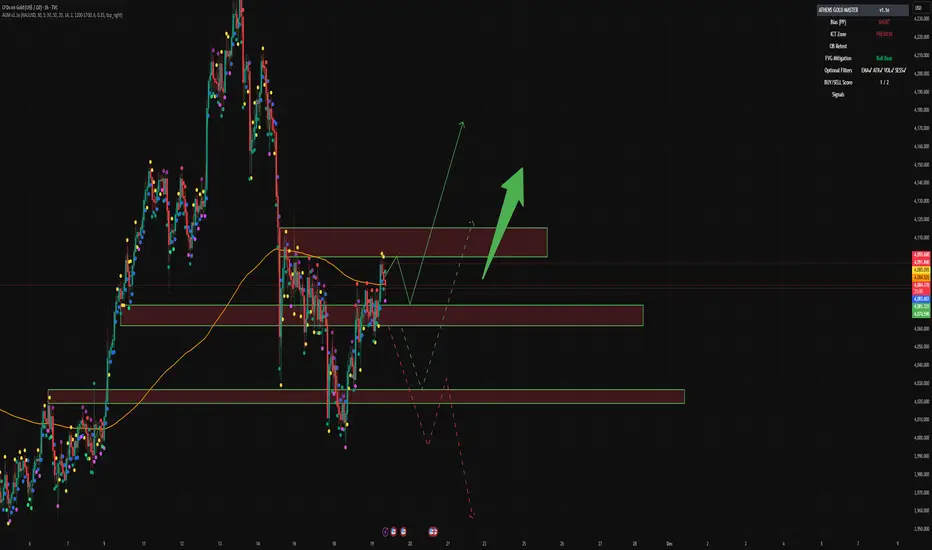
XAUUSD LONG TERM NEXT MOVE POSSIBLE ✅ Technical Analysis Breakdown (XAUUSD – 1H Chart)
gold chart shows a rising wedge / ascending channel, and price is currently reacting at the mid-range support.
You’ve drawn two potential outcomes – continuation upward or bearish breakdown. Let’s analyze both with precision.
📌 1. Current Market Structure
Price is inside a large upward channel.
It recently rejected from the upper trendline, pulling back toward the mid-channel support.
Price is now sitting near the horizontal support zone ~ 4045–4034.
This is a reaction zone where the next direction should become clear.
📈 2. Bullish Scenario (Bounce & Rally Toward 4250+)
Conditions for upside:
Price must break and hold above 4055 (you marked this level).
Bullish structure resumes with higher lows.
Target moves:
1st target: 4160
2nd target: 4250
3rd target: Retest of the channel top near 4300–4330
Your blue arrow upward matches this exact pathway.
Why this can happen:
Price still respecting the ascending channel.
Mid-channel support is holding.
Buyers may step in near support.
📉 3. Bearish Scenario (Breakdown to 3920–3890 Zone)
This becomes active only if price breaks below the rising trendline around 4020–4010.
Bearish targets:
1st target: 3980
2nd target: 3920–3890 (your green demand zone)
This is a strong liquidity pool where buyers previously entered.
Your downward arrow correctly points toward this demand zone.
Why this can happen:
Rising wedge patterns often break down.
Momentum is currently weakening.
Massive liquidity below 4000.
🎯 4. What Is Most Likely Right Now?
Based on the chart:
✔ Price is testing support.
✔ Still inside the bullish channel.
✔ No confirmed breakdown yet.
➡ Bias: Short-term bullish unless 4020 breaks.
Once 4020 breaks cleanly → bearish continuation becomes very likely.
🧭 5. Simple Trading Plan (Based on Your Zones)
Bullish Setup
Buy above: 4055
SL: 4020
TP: 4160 → 4250 → 4320
Bearish Setup
Sell after breakdown below: 4020
SL: 4050
TP: 3980 → 3920 → 3890
For More Updates Stay Tuned

ANFIBO | Gold XAUUSD - In a Bearish structure yet? [11.18.2025]I'm Anfibo, Here's my XAUUSD Daily Trading Plan ;)
Overall Picture:
OANDA:XAUUSD has officially broken its bullish structure, confirming a shift in market sentiment and signaling that the upward momentum has cooled off. With the H1 trendline decisively breached, we now transition from a “buy-the-dip” mindset to a sell-the-rally strategy. The nearest resistance sits at 4058, a strong confluence zone where multiple technical barriers align. If price pushes beyond this level, the next supply areas to watch are 4104 and 4146 — regions likely to act as retests of the broken trend, providing high-probability opportunities for continuation sells. The overall expectation for today is further downside movement as long as gold remains below these resistance zones.
Given the current structure, the market is presenting a classic post-breakdown setup, where rallies into resistance should be treated as opportunities to position for the next leg down. As long as gold remains capped below these key supply zones, the medium-term outlook remains bearish with targets toward the psychological level of 4000 and deeper.
Trading Plan for Today:
>>> SELL ZONE:
(1) ENTRY: 4055 – 4060
SL: 4075
TP: 4000 – 3950 – 3920
(2) ENTRY: 4100 – 4110
SL: 4120
TP: 4000 – 3970
Risk Management:
Prioritize sell setups only, as the bullish structure is no longer valid.
Keep stops tight above resistance zones to avoid false breakouts.
Maintain Risk:Reward ≥ 1:2 on all entries.
Avoid buying unless the market reclaims and stabilizes above 4146 with strong momentum.
Conclusion:
With the break of the upward structure, gold has transitioned into a bearish phase. We will stay patient and sell into rallies, especially near the strong resistance clusters at 4058, 4104, and 4146. As long as price remains below these levels, the path of least resistance continues downward toward the 4000 and 3950 targets. Stick to the plan, trust the structure, and let the market flow in our favor.
HAVE A SWEET PROFIT DAY, GUYS!

XAUUSD H4 | Bullish Bounce off Key SupportMomentum: Bullish
Price is currently above the ichimoku cloud.
Buy entry: 4,010.78
- Strong pullback support
- 78.6% Fib retracement
- 161.8% Fib extension
Stop Loss: 3,928.49
- Multi-swing low support
Take Profit: 4,109.35
- Overlap resistance
High Risk Investment Warning
Stratos Markets Limited (tradu.com/uk ), Stratos Europe Ltd (tradu.com/eu ):
CFDs are complex instruments and come with a high risk of losing money rapidly due to leverage. 70% of retail investor accounts lose money when trading CFDs with this provider. You should consider whether you understand how CFDs work and whether you can afford to take the high risk of losing your money.
Stratos Global LLC (tradu.com/en ): Losses can exceed deposits.
Please be advised that the information presented on TradingView is provided to Tradu (‘Company’, ‘we’) by a third-party provider (‘TFA Global Pte Ltd’). Please be reminded that you are solely responsible for the trading decisions on your account. Any information and/or content is intended entirely for research, educational and informational purposes only and does not constitute investment or consultation advice or investment strategy. The information is not tailored to the investment needs of any specific person and therefore does not involve a consideration of any of the investment objectives, financial situation or needs of any viewer that may receive it. Past performance is not a reliable indicator of future results. Actual results may differ materially from those anticipated in forward-looking or past performance statements. We assume no liability as to the accuracy or completeness of any of the information and/or content provided herein and the Company cannot be held responsible for any omission, mistake nor for any loss or damage including without limitation to any loss of profit which may arise from reliance on any information supplied by TFA Global Pte Ltd.

GOLD DAILY CHART ROUTE MAPHey everyone,
Please review our Daily Chart Route Map, now featuring updated levels for tracking Golds movement.
We continue to track our refreshed proprietary Goldturn Channel, our unique method for constructing ascending channels. Price action is now testing the swing range and the swing range seems to be holding support as expected. This swing range support also falls inline with the channel half line providing stronger support.
As long as ema5 remains above the swing zone we expect price to play between this range until the full updated long term swing is completed into 4145. An ema5 break below the swing range will open the lower channel floor for test, currently sitting at 3824
As always, we will keep you all updated with regular updates throughout the week and how we manage the active ideas and setups. Thank you all for your likes, comments and follows, we really appreciate it!
Mr Gold
GoldViewFX

How to trade in a range-bound market?Gold remains in a wide-range trading pattern, with the daily chart closing with another doji candlestick. This pattern suggests continued range-bound trading. Today's strategy is to buy low and sell high, as there is still room and demand for further declines. The key resistance level to watch today is around $4098; sell on rallies near this level.
Gold maintains its wide-range trading structure. The daily/weekly charts show a tug-of-war between bulls and bears, with moving averages converging and the price hovering around the middle Bollinger Band. Gold will soon face a directional decision. From a technical perspective, after rebounding to the $4110 high and encountering resistance, gold has fallen again in a stepped pattern, and this area remains a significant resistance zone.
Key Levels:
First Support: 4040, Second Support: 4023, Third Support: 4004
First Resistance: 4090, Second Resistance: 4108, Third Resistance: 4130
Gold Intraday Trading Strategy:
BUY: 4026-4031, SL: 4010, TP: 4050-4060;
SELL: 4095-4100, SL: 4115, TP: 4080-4070;
More Analysis →
A SELL AGAIN A sell at first entry 4059-64, sl at 4077, second entry was bad and I apologize but a chance to sell again for recovery

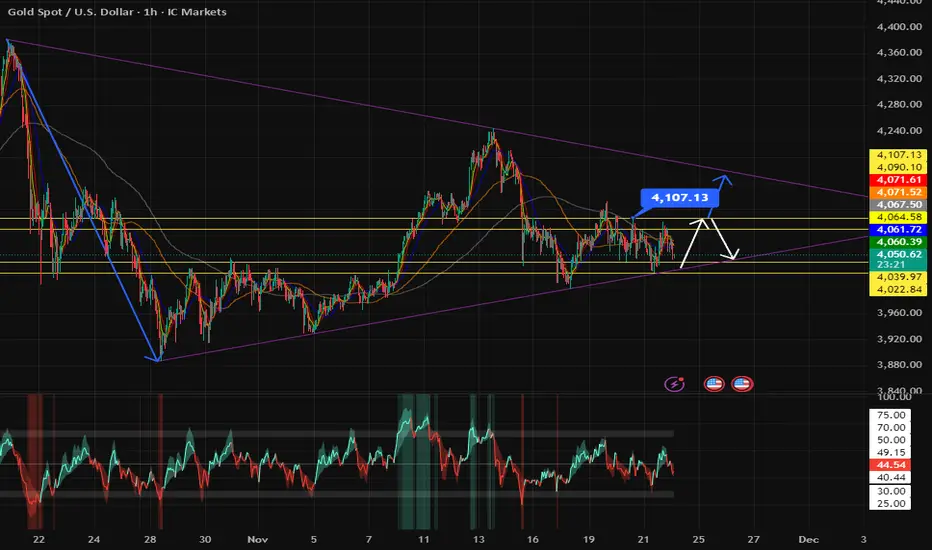
Gold price analysis November 24In the most recent session, gold continued to show signs of weakness when it failed to overcome the key resistance level of 4100. Profit-taking pressure appeared early and pulled the price back to the trendline - where the market is facing the risk of being broken if the selling pressure remains as it is. Once the trendline is broken, the short-term bullish structure will be completely broken and the correction range may extend to the deep support zone of 3935.
In this context, the most favorable strategy is to wait for the trendline breakout signal to trigger a SELL order, then follow the decline to the strong support zone of 3935.
Notable technical zones:
Support: 4040 – 4007 – 3935
Resistance: 4100 – 4145 – 5200
Recommended trading plan:
SELL when the price breaks the trendline around 4040
SELL DCA when the support of 4005 is broken
Target: 3935
Risk management: The bearish trend is invalidated if the candle closes back above 4100


A MAJOR BUY This is what I see happening any moment after market open ,
a buy at 4066-60, sl at 4040.
failing to buy more and closing below with a bearish candle tomorrow will signal more sells possibly next week .

ALERT SET AT 4068 on XAU/USDXAU/USD 1H - As you can see price is showing great signs of bullishness, respecting these areas of Demand and providing us with the bullish structure we expect.
You can see that I marked out and area of interest that price has come to clear and trade into perfectly. We have since seen price trade us higher giving us the opportunity to buy in.
I have gone ahead and marked out an area of interest just below current price with an alert set at 4068. I would like to see price come to trade down and into this before continuing this bullish momentum.
We could look to set a pending order here for this setup, as we know pending orders do hold risk though as we are not waiting for entry confirmation as such. I will follow up with a pending order.

XAUUSD (Gold) Is heading UPWARDS! - time to buyA few weeks ago XAUUSD (Gold) was in a short term downtrend but finally broke out of it. The price broke through the downward channel to the upside, the price also held onto strong support (the white trendline which acted as a support level). The price tested the white trendline several times but kept bouncing back each time it hit the support zone. The price then broke through all recent resistance zones and will very likely hit the next resistance zone which is marked as the "Take profit" area. BUY GOLD NOW!

GOLD USDHI GUYS.
UPDATE ON NEW SITUATION
GOLD failed to reach previous high on time so if it gets there on wed then we expect a correction.
Possible sells (Thursday , Friday ).
Trail your profits after the on going break because i see a high possible failure on trend this Wednesday .

XAUUSD LONGWe are waiting for the retest of the 1 hour retest around 4020 before we go long. Lets wait and see how it goes.

long move toward the IMB D1.
10:05 UTC+2
The short move has potentially already fulfilled its purpose.
The price took PWL (+ PDL and ff IMBᵃ D1).
This is a compression-based approach — therefore, from this zone I will expect a long move toward the IMBᵃ D1.
Inside that zone, I will watch the price again and make a new analysis. For now, the plan is to work toward it.
If the price holds below AL, then I will ignore longs today.

XAUUSD analysis todayHello traders, this is a complete multiple timeframe analysis of this pair. We see could find significant trading opportunities as per analysis upon price action confirmation we may take this trade. Smash the like button if you find value in this analysis and drop a comment if you have any questions or let me know which pair to cover in my next analysis.

XAU/USD – Bearish Momentum Approaches Key Support ZoneGold continues to trade within a clear downtrend on the H1 timeframe, respecting the descending trendline and forming consistent lower highs. Price is now moving toward a major support zone — an area that has previously triggered strong bullish reactions — making it a critical level to watch for today’s session.
Technical Outlook
Trendline: Price continues to respect the descending trendline, confirming strong bearish control.
Support Zone: 3,985 – 3,995 remains the most important demand area. This zone has acted as a reversal base multiple times.
Resistance Levels:
Immediate resistance: 4,025 – 4,035 (trendline confluence)
Upper resistance: 4,065 – 4,075
Indicators:
EMA Structure: Price remains below short-term EMAs → indicates sellers remain dominant.
RSI: Approaching oversold territory, suggesting a possible technical rebound.
Fibonacci: The 0.618 retracement aligns closely with the support area, increasing its reliability.
Price Behavior
The chart shows two previous consolidation boxes (accumulation phases), followed by expansions. The current structure is a deep pullback into major support. If selling pressure weakens at this zone, a short-term rebound toward the trendline is likely before the market decides its next major direction.
Trading Strategy
Scenario 1 – Bullish Rebound at 3,985 – 3,995
Wait for bullish confirmation candles + increasing volume.
Entry: 3,995 – 4,005
Target 1: 4,025
Target 2: 4,065
Stop-loss: below 3,975
Scenario 2 – Breakdown Below Support
Only trade if price closes clearly below 3,985.
Entry: around 3,980
Target 1: 3,960
Target 2: 3,930
Stop-loss: above 4,010
Final Note
The overall structure still favors the bearish side, but the support zone below is a decision point for the market. Observe price action carefully before entering. Follow for more daily strategies and insights, and save this analysis if you find it helpful.

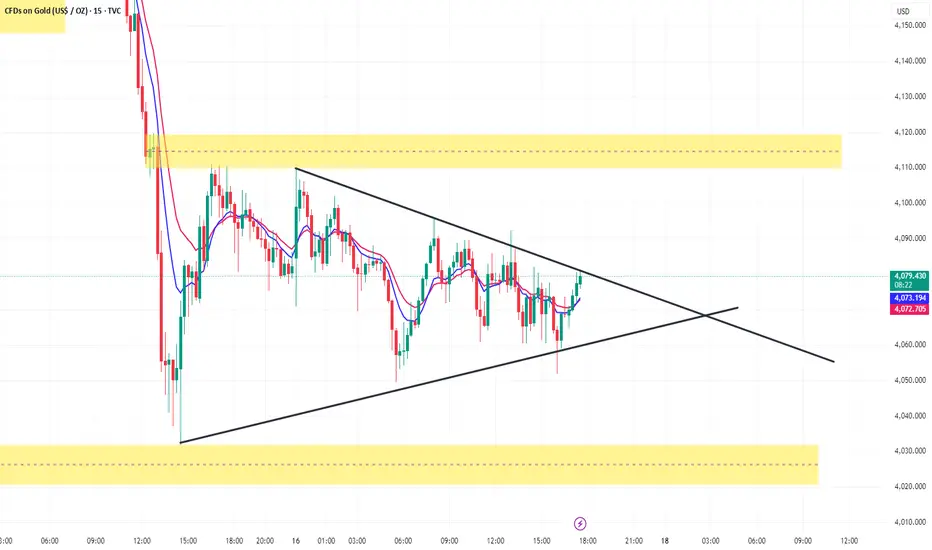
XAU/USD 15m **Symmetrical Triangle** structure.**Symmetrical Triangle** structure.
### **Why this is a Symmetrical Triangle**
* You have **lower highs** (descending trendline from top).
* You have **higher lows** (ascending trendline from bottom).
* Price is getting squeezed toward the **apex**.
* Volatility is decreasing → typical behavior before a breakout.
### **What this structure means**
A symmetrical triangle is a **neutral continuation pattern**, meaning:
* It can break **up** or **down**, depending on which side is broken with volume.
* The breakout usually decides the next big move.
### **Key breakout zones**
* **Bullish breakout:** Above ~4088–4092 zone (upper trendline + near supply)
* **Bearish breakout:** Below ~4060–4055 zone (lower trendline)
### **Also important**
You have **strong supply above** (yellow zone) and **strong demand below**, so expect:
* Fakeouts (liquidity grabs)
* Strong move after breakout
If you want, I can give you:
✔ Next expected move
✔ Buy/Sell bias
✔ SL/TP ideas based on your triangle
✔ Probability of breakout direction
Gold bulls rallied to reverse the trend; what's next?We perfectly timed both our long and short positions in gold, exiting all positions with profits. Now that gold is rebounding again, we should avoid shorting again and patiently observe the resistance levels above, especially the 4100-4110 area. Whether gold can break through this resistance remains to be seen. If your current trading is not going well, and we hope to help you avoid common pitfalls, feel free to contact us for discussion!
Based on the current gold price trend, we should first focus on the short-term support area around 4050-4030, and the resistance area around 4100-4110. The overall strategy should be to sell on rallies within this range. In the middle range, it's best to observe more and trade less, avoiding chasing the market. Wait patiently for key entry points. Specific trading strategies will be provided at the bottom; please pay close attention.

Gold Breakout and Potential RetraceHey Traders, in today's trading session we are monitoring XAUUSD for a buying opportunity around 4,080 zone, Gold was trading in a downtrend and successfully managed to break it out. Currently is in a correction phase in which it is approaching the retrace area at 4,080 support and resistance area.
Trade safe, Joe.

XAUUSD Tapped 4080 Twice!!The price tapped 4080 twice now, We expect another impulsive move down to 4050 which is our Support! Lets catch this drop.
