Bullish Scenario After Trendline BreakHello my trader friends,
I’m here with a short-term analysis on gold. Based on the chart, after the trendline break, I expect a bullish move. We’ll wait to see a strong result.
Stay tuned for more updates and analyses!
Trade ideas

XAUUSD | Gold Set to Explode from Triangle Pattern—Act Now!📊 Market Structure
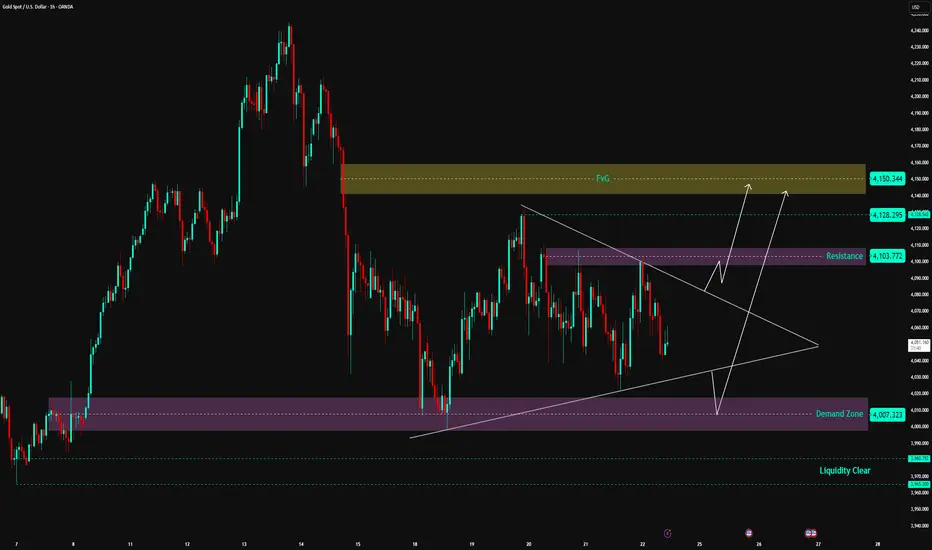
Gold is entering a tight accumulation phase within a Symmetrical Triangle pattern – indicating compression before a strong breakout.
On the downside, the price is still supported by the Demand Zone 4,007 – 4,020 USD , which is the main support area for the medium-term uptrend structure.
On the upside, the Resistance Zone 4,103 – 4,110 USD continuously exerts pressure, causing price rejection.
Currently, gold is trading right in the middle of the compression triangle → the market is preparing to choose a direction.
Looking at the wave structure, the trend slightly leans towards a break up to sweep liquidity in the high area.
💎 Key Technical Zones
• ⭐ FVG Supply Zone: 4,128 – 4,150 USD → expected strong reaction area if price breaks up
• 🟣 Resistance Zone: 4,103 – 4,110 USD → decisive area for direction
• 🟪 Demand Zone: 4,007 – 4,020 USD → strong base maintaining structure
• 🟦 Liquidity Clear: 3,980 USD → risk area if price collapses the triangle
🎯 Trading Plan – Two Possible Scenarios
1️⃣ BUY – Wait for Breakout from Triangle (priority scenario)
If the price breaks the resistance zone 4,103 – 4,110 with a strong H1 closing candle:
• Entry: 4,112 – 4,115
• SL: 4,095
• TP1: 4,128
• TP2: 4,145
• TP3: 4,150 (reach FVG)
→ This is a trend-following setup, with a high probability of sweeping liquidity above after the break.
2️⃣ BUY – Retest Demand Zone 4,007 – 4,020
If the price continues to follow the triangle pattern and falls to the trendline + demand zone:
• Entry: 4,010 – 4,017
• SL: 3,990
• TP1: 4,103
• TP2: 4,128
• TP3: 4,150
→ This is a very strong confluence area between Demand Zone + Trendline + pattern base.
❌ SELL? When is it valid?
Currently, selling is not prioritized, as the price is still above the Demand Zone and the larger structure still favors an uptrend.
Selling is only valid if the price:
• Breaks strongly below 4,007 USD
→ At this point, the market turns bearish, with a distant target of 3,980 USD.
🧠 Vincent’s View
Gold is under strong compression. When the triangle pattern is broken, the move will be extremely fast and decisive.
The current trend leans towards breaking up and heading straight into the FVG area 4,128 – 4,150 USD.
Just be patient and wait for the confirmation candle — don’t predict, react to the market.
⚡ “Breakout is born from pressure — patience profits.”
⏰ Timeframe: 1H
📅 Update: 24/11/2025
✍️ Analysis by: Captain Vincent
XAUUSDThe knowledge has been shared with you guys.
Just do not enter blindly wait and watch the price reaction on our zones.
And than decide weather to buy or sell,
Keep following for guys

Nov 24, 2025 - XAUUSD GOLD Analysis and Potential Opportunity📊 Analysis:
The market is currently in a range-bound structure.
The key level to monitor is 4055, which acts as an important support:
If price breaks below 4055, I may look for short opportunities, with the plan to sell rallies into resistance.
A break below 4022 would further strengthen bearish momentum.
On the upside, if price breaks above 4077, bullish strength begins to show, and the plan shifts to buying pullbacks into support.
Above 4100, bullish momentum is likely to accelerate significantly.
🔍 Key Levels to Watch:
• 4110 – Resistance
• 4100 – Resistance
• 4083 – Resistance
• 4077 – Key resistance
• 4055 – Major support
• 4039 – Support
• 4022–4030 – Support zone
• 4007 – Support
📈 Intraday Strategy:
SELL: If price breaks below 4055 → target 4048, with further downside toward 4039, 4030, 4022
BUY: If price holds above 4077 → target 4083, with further upside toward 4092, 4100, 4110

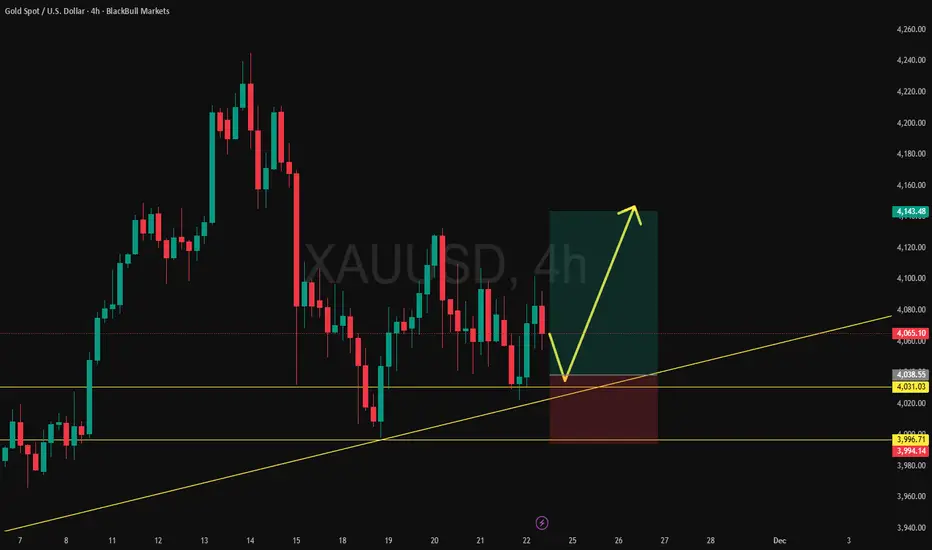
Gold: Daily Range Retest Setting Up a Late-December BounceGold remains in a clear daily range, currently retesting a prior support zone. The broader trend is still upward, and with December carrying a moderately bullish seasonal bias, the final days of the month favour a potential push back toward the range highs.
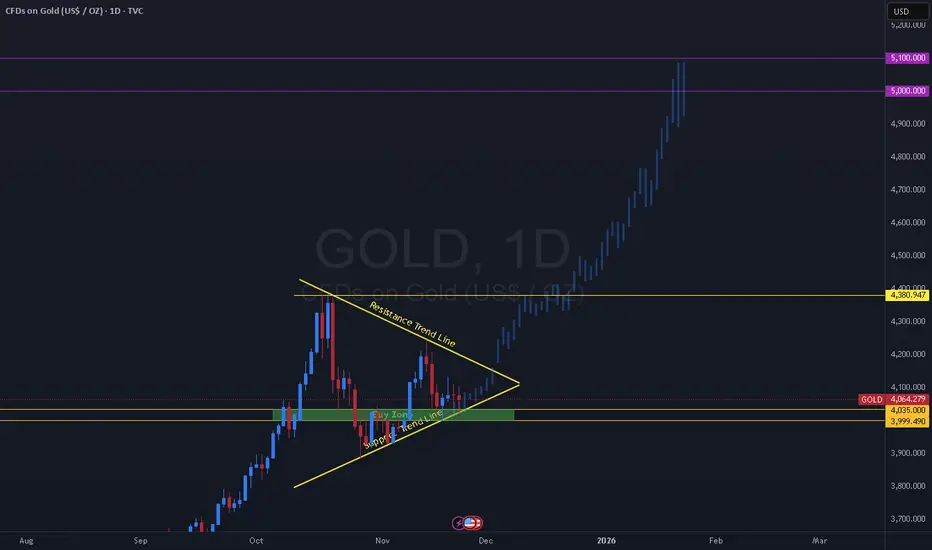
GOLD (XAUUSD) - Daily Structure Breakdown: Bullish OutlookGold has been consolidating within a symmetrical triangle formation, defined by a descending resistance trendline and an ascending support trendline. This compression followed the strong bullish impulse that preceded it.
Price repeatedly respected the Buy Zone highlighted in green, showing consistent demand and strong reactions from buyers each time price tapped into this area.
After the final retest of the support trendline, the price broke out aggressively to the upside, confirming a bullish continuation pattern. The breakout has since extended into a strong rally, with the price now targeting higher psychological levels.
Key technical levels include:
4,035 – 3,999: Buy Zone / High-value demand area
4,380: Previous major resistance
5,000 – 5,100: Next major psychological targets following the breakout
This structure indicates a classic bullish continuation where consolidation inside the triangle served as accumulation before the next impulsive move.
Weekly watchlist – Reviewing the setup on XAUUSDThere isn’t much to analyze on Gold at the moment, because I’m not really interested in taking short positions on XAUUSD. I prefer to wait and look for long opportunities only.
The best plan for now is to place a Buy Stop at 2,148 USD.
If a strong bullish move starts, I want to join the trend immediately.
If price gets rejected from this area, then we’ll simply re-evaluate buy setups again during the week.

Gold Bearish StanceHello Friends,
After a very long time we have published our gold analysis, Gold is under consolidation that can turned into correction.
Bearish targets are green boxes

XAUSUDPrice Action Trading is a method of financial market analysis where traders make buying and selling decisions solely based on the asset's price movements over time, without relying on technical indicators.
It's essentially the art of reading a "naked" or clean chart to understand the psychology and behavior of market participants.

XAUUSD (GOLD)Could we be expecting a good bullish week next week on gold???
It holds positioning at a very interesting buying key zone where we are now seeing an indecision candle forming either only a few minutes to closure.
Let’s hold and wait, if this key zone zone hold then we expecting new highs next week.

XAU/USD: Gold's Final Correction Before a Strong Rebound📊 Market Structure – Elliott Wave + SMC
Gold has completed impulse wave 1–5 at the peak of 4,207 USD and is entering an Elliott correction phase in the form of ABC .
Wave A : bottomed at Demand Zone 4,008 – 4,020 USD
Wave B : retraced upwards, creating consecutive Equal Highs and small BoS but has not broken the larger structure
Wave C : is forming, may extend down to the Demand Zone if the price loses 4,030
SMC signals reinforce the scenario of a completed correction:
A series of Equal Lows → the market still has liquidity below to "sweep" towards the Demand Zone
The area BoS – 4,076 is the decisive structure: if not broken upwards, the correction trend continues
The area FVG + Resistance 4,152 USD is the target for a major retracement wave after completing wave C
=> In summary: the market is in the final phase of correction. Once wave C is completed, gold is likely to rebound strongly in the larger trend.
💎 Key Technical Zones
🔹 Demand Zone – Main BUY area
4,008 – 4,020 USD
→ Strong Demand confluence + Elliott wave C + liquidity below.
→ High probability of reversal.
🔹 Reaction Zone – Temporary reaction area
4,030 – 4,040 USD
→ If the price retraces early but hasn't swept the bottom → the correction may still continue.
🔹 Supply & FVG Zones (Strong resistance)
4,152 – 4,207 USD
→ Main target of the retracement wave after the ABC pattern is completed.
🎯 Trading Plan – Vincent’s Execution Map
1️⃣ BUY Setup – According to Wave C (top priority)
Wait for the price to complete wave C at the Demand Zone:
Entry: 4,012 – 4,020
SL: below 3,984
TP1: 4,076
TP2: 4,128
TP3: 4,152
TP4: 4,207
→ This is the main setup of the day, confluence of both SMC + Elliott.
2️⃣ BUY Aggressive – Early buy according to Break of Structure
If the price breaks BoS 4,076 before reaching Demand:
Entry: 4,070 – 4,076
SL: 4,040
TP: 4,128 – 4,152 – 4,207
→ Setup for those who want to catch the impulsive wave early.
3️⃣ SELL Scalp – Small trend (not the main trade)
Only enter when the price retraces to Fibo:
Entry: 4,092 – 4,106
SL: 4,116
TP: 4,040 → 4,020
→ Short-term scalp, aiming to complete wave C.
🧠 Vincent’s View
The overall trend still leans towards Bullish Reversal after correction.
As long as the price holds Demand Zone 4,008 – 4,020 , gold can rebound strongly back to the target of 4,152 – 4,207.
“Liquidity always shows the way – patience is the real advantage.” ⚜️
⏰ Timeframe: 1H
📅 Updated: 21/11/2025
✍️ Analyzed by: Captain Vincent

Bond Yield Movements (US 10-Year, German Bunds)1. What Bond Yields Represent
A bond’s yield is essentially the return an investor earns for holding that bond. Yields move inversely to prices:
Bond prices rise → yields fall
Bond prices fall → yields rise
This inverse relationship reflects investor demand. When investors seek safety, they buy more bonds, pushing prices up and yields down. When they expect strong growth or higher interest rates, they sell bonds, pushing yields up.
Why the US 10-Year and German Bunds matter
The US 10-year Treasury yield is the world’s primary risk-free benchmark. It influences global bond markets, the US mortgage market, corporate borrowing costs, and equity valuations.
The German 10-year Bund yield is the benchmark for the Eurozone, influencing borrowing costs across Europe, including in countries like France, Italy, and Spain.
These yields act as barometers of economic health and market expectations.
2. Key Drivers of Yield Movements
a. Inflation Expectations
Inflation erodes the real return on bonds. Thus:
Higher expected inflation → higher yields, due to anticipated central bank tightening.
Lower expected inflation → lower yields, reflecting stable prices and easier policy.
Recent years have seen yields swing significantly due to rapid changes in inflation, especially after global supply-chain disruptions and energy shocks.
b. Central Bank Policies
The US Federal Reserve and the European Central Bank (ECB) play a central role.
When central banks raise interest rates, bond yields tend to rise as investors demand higher returns.
When they cut rates or conduct quantitative easing (QE)—buying bonds to inject liquidity—yields decline.
Forward guidance is equally important; even statements about future policy can move yields dramatically.
c. Economic Growth Indicators
Stronger economic data—GDP growth, employment figures, retail sales—pushes yields higher because markets expect tighter monetary policy ahead. Weak data tends to pull yields down due to expectations of lower growth and potential rate cuts.
d. Risk Sentiment and Safe-Haven Flows
During geopolitical tensions, financial instability, or market panics, investors flee to safe assets:
US Treasuries and German Bunds are premium safe-haven assets.
In risk-off environments, demand for these bonds rises → yields fall.
In risk-on environments, capital shifts to equities and risk assets → yields rise.
e. Fiscal Policy and Supply of Bonds
Large government deficits require increased bond issuance, sometimes pushing yields higher if supply outpaces demand. Conversely, fiscal consolidation reduces supply pressure.
3. US 10-Year Treasury Yield: Global Leader
The US 10-year yield is the world’s most influential interest rate. Its movements ripple across global markets.
a. Impact on Global Finance
Dollar strength: Higher yields attract capital into USD assets.
Emerging markets: Rising US yields often pressure EM currencies and stocks.
Equity valuations: Growth stocks, especially tech, are sensitive to yield changes as long-term cash flows are discounted at higher rates.
b. What Drives the US 10-Year Most
Federal Reserve policy
Rate hikes push yields up; dovish policies pull yields down.
Inflation trends
CPI, PCE inflation data strongly influence expectations.
Labor market strength
Strong job numbers raise expectations of Fed tightening.
Fiscal deficits and debt issuance
US Treasury supply can push yields higher if demand weakens.
Global demand
Foreign investors—Japan, China, and global funds—play a huge role in buying Treasuries.
c. Role in US Economy
Mortgage rates closely follow the 10-year.
Rising yields → higher borrowing costs → slowdown in housing.
Corporate debt becomes costlier as yields rise.
Treasury yields serve as a baseline for risk premiums across asset classes.
Thus, the US 10-year yield shapes both domestic and global liquidity conditions.
4. German 10-Year Bund: Europe’s Anchor
The German Bund serves a similar role for the Eurozone.
a. Why Bunds Matter Globally
Seen as the ultimate safe-haven within Europe.
Forms the basis for pricing all European government bonds.
ECB policy heavily influences Bund yields, often more directly than Fed policies affect Treasuries.
b. Drivers of Bund Yields
ECB policy stance
Tightening pushes yields higher; easing pushes them lower.
Eurozone inflation dynamics
Energy prices have historically been key drivers.
Growth divergence within Europe
Bund yields often fall when southern European debt markets show stress.
Global risk sentiment
Bunds act as safe assets during global or European crises.
c. Spread Analysis: The Bund vs. Other European Bonds
A critical aspect of European markets is the spread between the German Bund and other sovereign bonds, such as:
Italian BTPs
Spanish Bonos
French OATs
Wider spreads indicate market stress; narrower spreads imply confidence in the Eurozone’s stability.
5. Correlation Between US and German Yields
While each region has unique fundamentals, the two yields exhibit strong co-movement due to global capital mobility.
a. When US Yields Drive Bund Yields
Often seen when:
US inflation surprises the market.
The Fed adopts an aggressively hawkish stance.
Global investors move capital into or out of bonds collectively.
Because of arbitrage opportunities, global bond yields cannot diverge too much for too long.
b. When Bunds Diverge from Treasuries
This happens when:
European economic weakness contrasts with strong US growth.
ECB policy lags behind the Fed.
Eurozone debt concerns create local safe-haven demand.
Thus, co-movement is strong but not absolute.
6. Macro Implications of Yield Movements
a. For Currency Markets
Rising US yields → stronger USD.
Rising Bund yields → stronger EUR, if driven by growth rather than crisis.
b. For Equities
Higher yields pressure high-valuation sectors.
Lower yields support risk assets, especially tech and growth stocks.
c. For Commodities
Higher yields often coincide with weaker commodity demand, unless inflation is the driver.
Gold tends to fall when yields rise, as bonds offer higher real returns.
d. For Corporate and Government Borrowing
All debt becomes more expensive as benchmark yields rise.
Governments with higher debt burdens face fiscal pressure.
7. Conclusion
Movements in the US 10-year Treasury and German 10-year Bund yields hold immense significance for global markets. They encapsulate expectations about inflation, growth, central bank policy, and risk appetite. As benchmarks for global financing conditions, shifts in these yields determine everything from currency valuations and equity performance to housing markets and government budgets. Understanding their dynamics allows investors, policymakers, and traders to interpret the broader economic landscape and anticipate market trends.

NFP positive data may push gold down?Hello traders, this is a complete multiple timeframe analysis of this pair. We see could find significant trading opportunities as per analysis upon price action confirmation we may take this trade. Smash the like button if you find value in this analysis and drop a comment if you have any questions or let me know which pair to cover in my next analysis.

Gold’s Volatile Pullback & Next MoveHello my dear traders,
I’m back with an updated analysis on gold. Based on our previous outlook, we were expecting a price correction — and gold reacted beautifully to the analysis, delivering a strong pullback. We witnessed a sharp $250 drop, and now the price is recovering.
Gold is likely to move sideways in this zone for a while before choosing its next direction.
Follow me for more upcoming analyses — this story continues…

A SELLExpect this sell any moment from now through tomorrow , 4081-85 sl at 4100, but you can watch without trading


Gold dailyGold, after previous declines, has created a foundation for a long-term upward trend in the global ounce. This safe-haven asset is expected to record new monthly highs again. However, for short-term analysis, from the current price of $4,056, we set a target of $4,100 to $4,120 for the coming week or the next ten-day period.
Sasha Charkhchian

XAUUSD: Bearish CRT Setup (Turtle Soup + FVG Entry)The Narrative: Gold has successfully completed the "Manipulation" phase of the CRT cycle. We have a confirmed CRTH + TS (Turtle Soup) at the highs, where price swept liquidity and rejected. This signals that the high is likely in and smart money is positioning for a reversal "Turtle soup = explosive moves!".
The Technical Setup:
1. The Trap (Turtle Soup): The move above the previous high (CRTH) was a classic Turtle Soup designed to trap breakout buyers and stop out early sellers. This manipulation creates the fuel needed for the move down.
2. The Inducement ($$$): We have left clean sell-side liquidity ($$$) below the recent consolidation. This internal liquidity acts as a magnet for price to "gather" orders.
3. The Entry Zone (FVG): I am waiting for a retracement into the Bearish FVG (Fair Value Gap). This aligns with the CRT concept of selling at "Premium" pricing inside the imbalance. When a setup appears with an FVG, it becomes even more powerful.
Execution Plan:
WAIT: For price to trade back up into the dark grey FVG box.
TRIGGER: Watch for a Bearish Model #1 or rejection candle inside the FVG (a strong bearish close confirming the reversal).
TARGET: The CRTL (Candle Range Theory Low) at 4,022.53.
"Before you trade a pattern, learn the candle.". Wait for the close to confirm the entry.
📉 Trade safe!

GOLD LONGExpecting LONG on GOLD
ENTRY - 2 entries on the chart
SL - on the chart
TP - on the chart
GOOD LUCK!

Gold (XAUUSD): 15m timeframe idea, sell setupGold (XAUUSD): 15m timeframe idea, sell setup. Wait for price to close below the level. in this way both 1h and 15m are aligned and there is high chance to win both. I am already in 1h, waiting to add more with 15m.
Cheers

Gold key support at 4009The Gold remains in a bullish trend, with recent price action showing signs of a corrective pullback within the broader uptrend.
Support Zone: 4009 – a key level from previous consolidation. Price is currently testing or approaching this level.
A bullish rebound from 4009 would confirm ongoing upside momentum, with potential targets at:
4110 – initial resistance
4150 – psychological and structural level
4220 – extended resistance on the longer-term chart
Bearish Scenario:
A confirmed break and daily close below 4009 would weaken the bullish outlook and suggest deeper downside risk toward:
3975 – minor support
3933 – stronger support and potential demand zone
Outlook:
Bullish bias remains intact while the Gold holds above 4009. A sustained break below this level could shift momentum to the downside in the short term.
This communication is for informational purposes only and should not be viewed as any form of recommendation as to a particular course of action or as investment advice. It is not intended as an offer or solicitation for the purchase or sale of any financial instrument or as an official confirmation of any transaction. Opinions, estimates and assumptions expressed herein are made as of the date of this communication and are subject to change without notice. This communication has been prepared based upon information, including market prices, data and other information, believed to be reliable; however, Trade Nation does not warrant its completeness or accuracy. All market prices and market data contained in or attached to this communication are indicative and subject to change without notice.

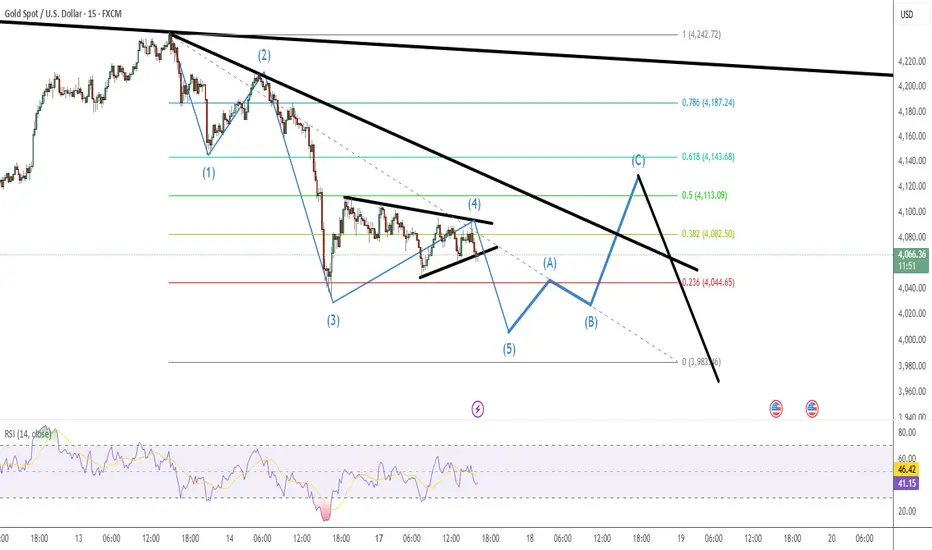
GOLD – Completing Wave (5) and Preparing for a Larger ABC RetracPrice action continues to respect the impulsive downside structure. Based on the internal wave count, it looks like we are finishing the final leg of Wave (5). The subwaves are clean, momentum is weakening, and structure is tightening inside a wedge—typical behavior at the end of an impulsive sequence.
Once Wave (5) completes, I expect a corrective A-B-C retracement to unfold.
Key expectations:
🔵 Wave Structure Outlook
Wave (4) has already topped inside the falling trendline
Wave (5) likely completes near the 0% zone
A corrective bounce should follow into:
A → around 4080
B → re-test of lower support
C → potential extension towards the 0.382–0.618 retracement (4082–4143)
⚠️ Bigger Picture
Even if the ABC correction plays out, the macro trend remains strongly bearish, and the dominant descending trendline continues to cap all rallies.
After the corrective structure completes, I expect another major move down following the thick black trendline.
🎯 Levels to Watch
Support: 3983
Short-term resistance: 4044, 4082, 4113, 4143
Gold Technical Analysis: High-Level Resistance Emerges, Focus onGold Technical Analysis: High-Level Resistance Emerges, Focus on Continued Pullback at the Start of the Week
Market Review: Gold suddenly turned downwards at the end of last week, and the key resistance level of 4210 we previously identified proved accurate. On Friday, gold prices reached a high of 4211 before retreating, breaking through the important 4100 level and ultimately falling to around 4032, resulting in a large bearish candlestick on the daily chart. This significant decline has raised market concerns about whether a continuous downtrend will form on the daily chart.
Technical Analysis: Daily Chart Analysis: Observing the daily chart, it is clear that the price highs have been gradually shifting downwards. This means that after encountering resistance at the three-point line (referring to the three key support levels), a second downward reversal is likely to occur. Currently, the fast and slow lines are still above the zero line, indicating that even if there is a decline, it is temporarily characterized as a pullback rather than a trend reversal.
Combined with candlestick analysis, the important support of the trendline is located near the $4000 psychological level. This is both our main target for short positions this week and a key position for attempting to establish long positions. If this support level is breached, gold prices could further decline to around $3890, near the lower Bollinger Band.
Key Resistance Level Analysis
It's worth noting that the halfway point resistance level of Friday's large bearish candle is precisely at $4130, which also coincides with the highest point of the rebound after the sharp drop on October 21st. If gold prices can regain and hold above this level, it would signify the end of this round of correction.
Short-Term Trading Structure
After a slight rebound at the open this morning, gold prices continued to fall under pressure, with the $4110 level forming effective resistance. Observing the 1-hour chart, gold is forming a head and shoulders pattern. As long as the price remains below $4150, this bearish structure remains intact. Even if a strong rebound occurs, as long as it doesn't break through the $4150 resistance, it should be considered a shorting opportunity.
Trading Strategy
Overall Approach
Today's core strategy is to sell on rallies. Although there is a technical rebound demand after Friday's sharp drop, the rebound strength is expected to be limited. As long as the key resistance of $4111 cannot be effectively broken, any rallies should be opportunities to short. Specific Trading Suggestions
Short Position Strategy:
Sell gold in batches around 4110-4120, with a position size of 20% of your capital.
Set a stop-loss of 8 points.
Target price: 4080-4060, with a further target of 4030 if the price breaks through.
Long Position Strategy:
Buy gold in batches around 4035-4040, with a position size of 20% of your capital.
Set a stop-loss of 8 points.
Target price: 4060-4080, with a further target of 4090 if the price breaks through.
Risk Warning: Investors must strictly control their position size and adhere to stop-loss discipline. Avoid holding losing positions. Specific entry points need to be adjusted based on real-time market movements. This analysis is for reference only.
Key Resistance Level: 4110-4150
Key Support Level: 4030-4000
