Here is my setup for today www.tradingview.com
If i wanna open a buy position i wait to see lower price otherwise i will wait to see confirmation and brake out.
Be patient and have a good week
Trade ideas

Gold trend in the last week of November⚔️1. Trendline
Descending Trendline (upper red line)
Acts as the main dynamic resistance.
Every retest results in rejection → the overall trend remains bearish.
The 4.150 – 4.160 zone is likely where price may retest the trendline before reversing lower.
Ascending Trendline (lower red line)
Previously the nearest dynamic support but has now been broken.
The downside breakout signals weakening momentum, favoring SELL setups.
⚔️2. Resistance Zones
Resistance 1: 4.148 – 4.150 (Fibo 0.5 – 0.618)
Confluence of Fibonacci retracement and the descending trendline.
High probability that price will retest this area and reject strongly.
Resistance 2: 4.245 – 4.250
The strongest resistance zone (Fibo 1.0).
Only reachable if a strong bullish pullback occurs.
⚔️3. Support Zones
Support 1: 3.995 – 4.000 & 4.028 – 4.030
Confluence of static support + psychological level.
A technical bounce may appear here.
Support 2: 3.890 – 3.900
The strongest support zone.
Main downside target if the price gets rejected from the upper resistance.
⚔️4. Price Scenarios
⭐️Primary Scenario (Bearish)
Price pulls back to 4.148 – 4.152, retests the descending trendline → rejection → moves down toward:
TP1: 3.995
TP2: 3.890
⭐️Alternative Scenario (Bullish)
Valid only if:
Price breaks above the descending trendline
Closes above 4.160
→ Next target: 4.250
TRADING RECOMMENDATIONS
BUY GOLD: 3890 – 3888
SL: 3878
TP: 100 – 300 – 500 pips
SELL GOLD: 4250 – 4248
SL: 4260
TP: 100 – 300 – 500 pips

WEEKLY ANALYSIS This week could be the beginning of another rally on Gold after creating the higher low on weekly and clearing some of the both sell and buy sides liquidity that sent mixed signals that deceived many of us which is also good and very important part of the trading process because it helps us to learn new things or upgrade on the things we know already and therefore prepares us for tomorrow .
So the chart above is how i expect the bullishness to start again with momentum this coming week , it wouldn't surprise me if the market range again or fail to buy more and closes below but as for now i only see buy continuation and i will only change my bias only if Gold fails to buy more and rather closes the week with a bearish candle, so this coming week is very important week and a confirmation week.
A buy and hold at 4060-55 sl at 4040

GOLD UNDER PRESSURE - NFP DAY! 💰 GOLD UNDER PRESSURE - NFP DAY! ⚠️
Current Price: $4,066 - $4,078 🔴
Opening Price: $4,078
Today's Range: $4,042 - $4,110
Yesterday: Trimmed gains after hitting $4,132
Monthly Performance: -4.29% ❌
Status: 🔴 BEARISH - CRITICAL NFP DAY
🚨 TODAY - SEPTEMBER NFP REPORT! 📊
THE MOST IMPORTANT DATA RELEASE! First jobs report since government shutdown. This will move gold MASSIVELY!
What's Happening:
❗ September NFP Today - First post-shutdown jobs data (8:30 AM ET)
❗ FOMC Minutes Yesterday - No major surprises, cautious tone
❗ Gold Trimming Gains - Fell from $4,132 to $4,066
❗ Dollar Strengthening - DXY above 99.50, pressuring gold
❗ December Rate Cut Odds - Dropped to 46.6% (from 62.9% last week)
❗ Risk-Off Mood - But not helping gold due to strong USD
📊 NFP EXPECTATIONS & IMPACT
Forecast:
Nonfarm Payrolls: +50,000 (vs +22,000 in August)
Unemployment Rate: 4.3% (unchanged)
Average Hourly Earnings: Key inflation indicator
How NFP Affects Gold:
Strong NFP (>50K) = GOLD DOWN 🔴
Fed less likely to cut rates
Dollar strengthens
Gold typically drops 30-50+ pips
Weak NFP (<50K) = GOLD UP 🟢
Fed more likely to cut rates
Dollar weakens
Gold typically rallies 40-60+ pips
In-Line NFP (~50K) = CHOPPY ⚪
Mixed reaction
Depends on other components (wages, unemployment)
📊 TECHNICAL ANALYSIS
Market Structure: BEARISH 🔴🔴
Gold failed to break above $4,112 resistance yesterday despite FOMC. Now trading below key support. Bears have control short-term.
Key Development: Gold trimmed earlier gains, trading around $4,090, easing from intraday high near $4,132. Bulls tested $4,112 resistance but failed.
Critical Support Levels (Under Attack!) 🔵
Support 1: $4,065 - $4,075 (Current fight zone)
Support 2: $4,042 - $4,050 (Today's low - Critical)
Support 3: $4,000 - $4,005 (Psychological - Major)
Support 4: $3,987 - $4,002 (November open)
Support 5: $3,965 (November 6 low)
Key Resistance Levels (Recovery barriers) 🔴
Resistance 1: $4,090 - $4,100 (Immediate ceiling)
Resistance 2: $4,112 - $4,120 (20-day SMA - Strong)
Resistance 3: $4,140 - $4,150 (Major barrier)
Resistance 4: $4,170 - $4,212 (Last week's range)
📈 TECHNICAL INDICATORS
RSI (14): 46 (Bearish - Neutral zone but trending down) 📉
RSI (4H): 46 (Neutral-to-bearish tone)
MACD: Momentum indicator turned lower below midline ❌
Moving Averages:
Price below 20-SMA ($4,080) 🔴
20-SMA acting as resistance ❌
100-SMA and 200-SMA still below (long-term bullish) ✅
Pattern: Broader SMA configuration points to consolidative bias
Volume: Above average - Institutional positioning for NFP
🎯 TODAY'S TRADING STRATEGIES
SCENARIO 1: WEAK NFP 🟢 (40% Probability)
IF NFP < 50K (Weaker than expected):
Fed rate cut odds increase → Dollar falls → Gold RALLIES!
LONG Setup:
Entry: Immediate spike after NFP (within 5 min)
Targets:
TP1: $4,100 📍 (+30 pips)
TP2: $4,120 📍 (+50 pips)
TP3: $4,150 📍 (+80 pips)
Stop Loss: $4,040 (Tight - move to breakeven fast!)
Risk/Reward: 1:2+ ratio ✅
SCENARIO 2: STRONG NFP 🔴 (45% Probability)
IF NFP > 50K (Stronger than expected):
Fed stays hawkish → Dollar strengthens → Gold DROPS!
SHORT Setup:
Entry: Immediate drop after NFP
Targets:
TP1: $4,042 📍 (-25 pips)
TP2: $4,000 📍 (-65 pips)
TP3: $3,987 📍 (-80 pips)
Stop Loss: $4,095
⚠️ WARNING: Fast-moving market - use tight stops!
SCENARIO 3: IN-LINE NFP ⚪ (15% Probability)
IF NFP ~50K (As expected):
Strategy: WAIT for Clear Direction
First 15-30 min will be CHOPPY
Look at other components (wages, unemployment)
Trade the SECOND move after dust settles
Direction depends on market interpretation
💎 NFP TRADING PLAN (Step-by-Step)
BEFORE NFP (Now until 8:30 AM ET):
✅ Close ALL positions or set VERY wide stops
✅ Reduce position size to 50% of normal
✅ Set alerts at $4,100 and $4,040
✅ Be ready - Have orders prepared but NOT placed
✅ Stay calm - Don't panic trade!
DURING NFP (8:30-8:35 AM ET):
⏰ Read the number - Higher or lower than 50K?
👀 Watch initial reaction - Which way is it moving?
⚠️ Wait 2-3 minutes - Let fake moves clear
🎯 Confirm direction - Is it continuing or reversing?
AFTER NFP (8:35+ AM ET):
✅ Enter ONLY if direction is clear
✅ Use smaller positions - Volatility extreme!
✅ Move SL to breakeven after +20 pips
✅ Take partial profits at each target
✅ Trail your stop - Protect profits!
🌍 FUNDAMENTAL ANALYSIS
YESTERDAY'S FOMC MINUTES:
Cautious tone but no major surprises
Focused on data-dependent approach
Concerns about post-shutdown economic weakness
No clear signal on December cut
Market Reaction: Muted - Gold initially spiked to $4,132 then fell back
TODAY'S NFP - WHAT MATTERS:
Most Important:
Headline NFP Number (+50K expected)
Unemployment Rate (4.3% expected)
Average Hourly Earnings (inflation signal)
Why This NFP is Special:
First data since 43-day shutdown
May show shutdown impact on economy
Will heavily influence December Fed decision
Could reset market expectations entirely
BULLISH FACTORS ⬆️
✅ Weak Jobs Data Expected - Shutdown impact likely
✅ Government Concerns - Economic weakness possible
✅ Analysts still predict gold may reach $4,456-$4,509 end November
✅ Central banks targeting 750-900 tonnes purchases 2025
✅ If NFP weak → Rate cut odds rise → Gold up
BEARISH RISKS ⬇️
⚠️ Strong Dollar - DXY above 99.50 and strengthening
⚠️ December Cut Odds Low - Only 46.6% now
⚠️ Failed $4,112 Break - Bears defending
⚠️ Technical Weakness - Below 20-SMA
⚠️ If NFP strong → Rate cut odds fall → Gold down
🔥 MARKET SENTIMENT: EXTREMELY CAUTIOUS
Pre-NFP Positioning:
Traders are:
Closing longs ahead of NFP
Waiting on sidelines
Expecting big volatility
USD bulls positioning for strength
Analyst Views:
Gold may stay pressured near $4,078 unless it reclaims $4,112-$4,140
Post-NFP Targets:
Weak NFP: $4,150-$4,200
Strong NFP: $4,000-$3,965
💡 PROFESSIONAL GAME PLAN
For DAY TRADERS:
⚡ DO NOT TRADE 30 MIN BEFORE NFP!
Close all positions by 8:00 AM ET
Wait for NFP release at 8:30 AM ET
Let first 2-3 min settle
Trade the confirmed direction
Use TIGHT stops (20-30 pips max)
Take quick profits
For SWING TRADERS:
📊 Today Decides the Week!
IF weak NFP → Go LONG for $4,150-$4,200 (hold 3-5 days)
IF strong NFP → Stay FLAT or SHORT to $4,000
This data will set trend for rest of November
For LONG-TERM INVESTORS:
💎 Patience!
IF gold drops to $3,950-$4,000 after strong NFP → BUY
IF gold rallies on weak NFP → Wait for next dip
Long-term target still $4,500+ (2026)
📅 TODAY'S TIMELINE
Pre-Market: Consolidation $4,065-$4,080 (nervous calm)
8:30 AM ET: NFP RELEASE 🔥🔥🔥
8:30-8:45 AM: EXTREME volatility (100+ pip moves possible!)
9:00 AM-12:00 PM: Direction confirmed, follow-through
Afternoon: Profit-taking, position adjustments
🎬 BOTTOM LINE (TL;DR)
Price: $4,066-$4,078 (Weak)
Event: NFP TODAY 8:30 AM ET
Bias: NEUTRAL until NFP (Then clear!)
Strategy: WAIT for NFP, trade the reaction
Risk Level: EXTREME (Highest this month!)
🔔 NFP CHEAT SHEET
Strong NFP (>60K):
Gold → $4,000-$4,042 🔴
Action: SHORT or stay flat
Expected NFP (~50K):
Gold → Choppy $4,050-$4,100 ⚪
Action: Wait for secondary move
Weak NFP (<40K):
Gold → $4,120-$4,150+ 🟢
Action: LONG aggressively
Remember: First move can be fake! Wait for confirmation!
📊 TECHNICAL OUTLOOK
Trend: ⚠️ BULLISH (Long-term) but BEARISH (Short-term)
Momentum: WEAK - Bears in control 🔴
Support: TESTING at $4,065-$4,075 ⚠️
Resistance: STRONG at $4,090-$4,112 🚧
Pattern: Failed breakout + Rejection at 20-SMA
Today's Outcome: NFP decides EVERYTHING!
⚠️ RISK MANAGEMENT - NFP DAY!
✅ TINY Positions - Risk MAX 0.5% (Extreme volatility!)
✅ WIDE Stops - 40-50+ pips (Initial spikes huge)
✅ Quick Profits - Lock gains FAST (Market can reverse)
✅ NO Predictions - REACT to data, don't guess
✅ Breakeven Fast - Move SL to BE after +20 pips
✅ Accept Losses - If wrong, exit and wait
🎯 SWING TRADE SETUP (Post-NFP)
Setup A - Weak NFP Rally:
Entry: $4,080-$4,090 (after weak NFP confirmed)
Target 1: $4,150 (Hold 2-3 days)
Target 2: $4,200 (Hold 5-7 days)
Stop Loss: $4,050
Setup B - Strong NFP Drop:
Entry: $4,050-$4,060 (after strong NFP confirmed)
Target 1: $4,000 (Hold 1-2 days)
Target 2: $3,965 (Hold 3-5 days)
Stop Loss: $4,085
🏆 NFP TRADING WISDOM
Historical Patterns:
Initial spike often REVERSES within 15 min
True direction emerges after 30-60 min
Average NFP move: 60-100 pips in first hour
Gold inversely correlated with NFP surprises
What Professional Traders Do:
Close positions before NFP
Wait for initial volatility to settle
Trade the SECOND move (more reliable)
Use smaller size than normal
Move to breakeven quickly
Don't fight the trend after NFP
🔮 FORECAST
If Weak NFP:
Today: Rally to $4,120-$4,150
Friday: Consolidate gains
Next Week: Push to $4,200+
If Strong NFP:
Today: Drop to $4,000-$4,042
Friday: Test support
Next Week: Range $4,000-$4,100
If In-Line NFP:
Today: Chop $4,050-$4,100
Friday: Direction unclear
Next Week: Wait for more data
🚨 CRITICAL NFP REMINDERS
⚠️ BIGGEST VOLATILITY DAY - Expect 100+ pip swings!
⚠️ First Move Often FAKE - Don't chase immediately
⚠️ Slippage is HUGE - Market orders dangerous
⚠️ Spreads WIDEN - Costs increase dramatically
⚠️ News Can Leak - Sometimes moves before 8:30
⚠️ Other Components Matter - Not just headline NFP
⚠️ Revisions Count - Previous months often revised
📊 SUPPORT/RESISTANCE SUMMARY
Critical Support: $4,042, $4,000 (Must hold!)
Strong Support: $4,065, $4,050
Weak Resistance: $4,090, $4,100
Strong Resistance: $4,112, $4,120, $4,150
NFP Breakout Up: $4,112 (Bulls win)
NFP Breakdown Down: $4,042 (Bears win)
⚠️ FINAL DISCLAIMER
Today is THE most volatile and dangerous trading day this month. NFP releases cause extreme price swings, false breakouts, stop hunting, and massive slippage. This analysis is for educational purposes only. NEVER trade the first minute after NFP. Use position sizes 50% smaller than normal. Always use stop losses. Be prepared to lose on this trade - even professionals get whipsawed. The market can gap through your stops. Past NFP reactions don't guarantee future results. If you're not experienced with NFP trading, STAY FLAT today. Consult a licensed financial advisor before trading.
📱 MOST DANGEROUS DAY!
💬 NFP at 8:30 AM ET
🔔 100+ pip moves expected
⚡ DON'T GUESS - REACT!
🙏 Trade safe or don't trade!
#Gold #XAUUSD #NFP #NonFarmPayrolls #ForexTrading #JobsReport #HighVolatility #RiskManagement #DayTrading #EventTrading #FOMCMinutes #MarketAnalysis #CriticalData #TradingSafety

GOLD market after “Fed fever”, growth momentum is challengedOANDA:XAUUSD prices remain in the spotlight as the market has been experiencing a series of strong fluctuations following mixed signals from the Federal Reserve and labor data. However, developments show that the risk of price declines is increasing as the precious metal has repeatedly failed in its efforts to hold the $4,100/ounce area, the first resistance level of this year's hot period.
For most of 2025, gold has risen more than 55%, despite high bond yields and a strong dollar. But as the Fed’s final policy meeting approaches and the market lacks consensus on the path of interest rate cuts, the traditional correlation between gold, interest rates, and the dollar is returning. According to CME’s FedWatch, the market still expects a more than 70% chance of the Fed cutting interest rates next month, while economists maintain a more cautious assessment of only about 50/50.
This puts the upcoming economic data in a decisive position for both market expectations and gold’s stability in this trading week.
Fed’s Dovish Return: A Direct Impact on Gold’s Upward Momentum OANDA:XAUUSD
Gold settled in the first half of the week as demand for havens increased, while the ADP report showed that the private sector cut an average of 2,500 jobs per week in the four weeks to November 1.
The 4,000 USD/ounce level continues to be the key threshold determining the short-term trend, as the market is moving within a correction zone but has not yet broken the medium-term bullish structure.
Technical analysis and suggestions OANDA:XAUUSD
1. Price Structure & Overall Trend
• Price is still within the ascending channel that has extended since August, although the range has narrowed compared to October. The October peak around 4,128 USD acts as a major medium-term resistance.
• The current decline is still only a pullback within the uptrend, as long as price holds above 3,972 USD (Fib 0.382) and especially the 4,000 USD psychological & technical support.
2. Key Technical Zones
• Nearest resistance: 4,128 – 4,216 USD
(A strong resistance cluster where price has been repeatedly rejected in November.)
• Nearest support: 4,055 – 4,000 USD
(This zone aligns with Fib 0.382 and the short-term bottom.)
• Deeper supports:
3,846 USD (Fib 0.5) – Important for a deep pullback scenario
3,720 USD (Fib 0.618) – Reaction support in case of strong macro volatility
3. Price Momentum – RSI
• RSI has moved out of oversold territory but remains weak and has not re-established a bullish structure.
• The RSI-MA21 is flat → the market lacks strong momentum; sideways movement or a retest of the 4,000 USD zone is highly likely.
4. Short-Term Outlook (Next Week)
• Market bias: Neutral to slightly bearish, but the medium-term uptrend remains intact.
• Price is likely to retest 4,000 USD, then form one of two scenarios:
o Hold 4,000 → rebound to 4,128 – 4,216 USD
o Break 4,000 → drop to 3,972 – 3,846 USD
👉 Conclusion: 4,000 USD is the decisive level for the short-term trend.
BUY XAUUSD PRICE 4102 - 4100⚡️
↠↠ Stop Loss 4106
→Take Profit 1 4094
↨
→Take Profit 2 4088
SELL XAUUSD PRICE 4016 - 4018⚡️
↠↠ Stop Loss 4012
→Take Profit 1 4024
↨
→Take Profit 2 4030

Gold Trade Plan 24/11/2025Dear Traders,
Gold is currently moving within a range between 4000–4100, and the news about an initial agreement between Russia and Ukraine will have a strong impact on gold and the EUR/USD pair.
I expect that after price breaks out of the range, it will reach the first target at 3970. After that, we need to observe the price action.
If 3970 is broken decisively, I expect the price to reach 3850–3750 this week. However, if the 3970 zone acts as support, I anticipate a sharp upward move.
Regards,
Alireza!

XAU/USD Intraday Plan | Gold Under Pressure, 4,078 Remains KeyGold delivered choppy price action yesterday due to the news releases, with buyers failing to break above the 4078 resistance. The metal has now slipped lower and is currently testing the upper boundary of the Support Zone.
With price still holding below both the MA50 and MA200, the sellers maintain the short-term advantage, as these moving averages continue to act as dynamic resistance.
For buyers to step back in, we need to see a clean recovery above 4053 and then a confirmed break of the key 4078 level for buyers to attempt a move toward 4115.
If selling pressure remains, a full test of the Support Zone (4027-3996) is likely. A break below this area could trigger a deeper correction into the HTF Support Zone (3968-3921).
📌 Key levels to watch:
Resistance:
4053
4078
4115
Support:
4027
3996
3968
3921
🔎Fundamental focus:
A batch of U.S. data — including Flash PMI and Consumer Sentiment revisions — could bring volatility after yesterday’s choppy moves.
We also have political headlines and Fed speakers throughout the day, which may add intraday swings as markets react to fresh news.

XAUUSD Analysis todayHello traders, this is a complete multiple timeframe analysis of this pair. We see could find significant trading opportunities as per analysis upon price action confirmation we may take this trade. Smash the like button if you find value in this analysis and drop a comment if you have any questions or let me know which pair to cover in my next analysis.

XAU/USD 20 November 2025 Intraday AnalysisH4 Analysis:
-> Swing: Bullish.
-> Internal: Bullish.
Analysis and bias remains the same as analysis dated 20 October 2025.
Price has printed as per previous intraday expectation by printing a bearish CHoCH which indicates, but not confirms, bullish pullback phase initiation.
Price is currently trading within an established internal range, however, I will continue to monitor price with regards to depth of pullback.
Intraday expectation:
Price to continue bearish, react at either discount of 50% internal EQ, or H4 supply zone before targeting weak internal high priced at 4,380.990.
Note:
The Federal Reserve’s sustained dovish stance, coupled with ongoing geopolitical uncertainties, is likely to prolong heightened volatility in the gold market. Given this elevated risk environment, traders should exercise caution and recalibrate risk management strategies to navigate potential price fluctuations effectively.
Additionally, gold pricing remains sensitive to broader macroeconomic developments, including policy decisions under President Trump. Shifts in geopolitical strategy and economic directives could further amplify uncertainty, contributing to market repricing dynamics.
H4 Chart:
M15 Analysis:
-> Swing: Bullish.
-> Internal: Bullish.
As per analysis dated 14 November 2025, price has printed a bearish CHoCH to indicate, but not confirm bearish pullback phase initiation.
Price is currently trading within an established internal range.
Intraday expectation:
Price to trade down to either discount of 50% internal EQ, or M15 demand zone before targeting weak internal high, priced at 4,245.195
Note:
Gold remains highly volatile amid the Federal Reserve's continued dovish stance, persistent and escalating geopolitical uncertainties. Traders should implement robust risk management strategies and remain vigilant, as price swings may become more pronounced in this elevated volatility environment.
Additionally, President Trump’s tariff announcements, particularly against China, are expected to further amplify market turbulence, potentially triggering sharp price fluctuations and whipsaws.
M15 Chart:

GOLD WILL BEAR MARKET UNTIL FRIDAY I'm trying to analyze using the ichimoku pola, and I'm looking at the time that is shared in the tf4h. According to my analysis, gold will experience a decline up to 3678.24 or during the market's peak on the next day.

MORE SELLS This is a sell confirmation candle in the purple sphere, more sells coming and even tomorrow , a lot has happened today in the market

Gold Preparing for Final Drop Before Major RallyGold is currently developing the final stages of a corrective structure, with price breaking down from the minor consolidation and heading toward the completion of wave v of (C).
Short Opportunity
Sell Entry: 4,115 – 4,135
Short-term Target:
TP 1: 3,880
TP 2 (Completion of v of C): 3,780 – 3,760 zone
Stop Loss: Above 4,160
LONG-TERM BUY SETUP (Major Impulse Reversal Expected)
Once the corrective wave v of (C) completes in the 3,760–3,800 demand zone, gold is expected to reverse sharply into the beginning of a new bullish impulse.
Buy Opportunity
Buy Entry Zone (High Probability):
3,760 – 3,820
Stop Loss: 3,700
Targets:
TP 1: 4,300
TP 2: 4,500
TP 3: 4,720+ (macro channel resistance)
Long-Term Bias
The structure suggests gold is completing a large corrective pattern and preparing for a strong bullish continuation toward new highs.

GOLD TESTING CRITICAL $4,000 SUPPORT!🚨 ALERT - CRITICAL SITUATION!
Gold is in DANGEROUS TERRITORY! The market is testing the psychologically critical $4,000 level after a sharp decline. This is a make-or-break moment!
What's Happening:
❗ Price Expected to DECLINE Today - Analysts forecast further downside
❗ $4,000 Psychological Support - Being tested RIGHT NOW
❗ DXY Strengthening - Dollar at key support (99.50), pressuring gold
❗ Bearish Momentum Active - Third consecutive day of decline
❗ Triangle Breakdown Risk - Pattern suggests more downside
📊 TECHNICAL ANALYSIS
Market Structure: BEARISH 🔴🔴🔴
Gold has broken down from consolidation triangle and is now testing the crucial $4,000-$4,040 support zone. This is buyers' LAST STAND!
Current Battle: Bulls defending $4,000-$4,040 vs Bears pushing for breakdown
CRITICAL Support Levels (Must Hold!) 🔵
Support 1: $4,020 - $4,040 (Current fight zone - CRITICAL!)
Support 2: $4,000 - $4,008 (Psychological - LINE IN SAND!)
Support 3: $3,987 - $4,002 (November open - Major)
Support 4: $3,930 (Bullish invalidation - DANGER!)
Support 5: $3,886 - $3,900 (Previous lows)
Key Resistance Levels (Recovery barriers) 🔴
Resistance 1: $4,090 - $4,100 (KEY - Daily pivot)
Resistance 2: $4,110 - $4,120 (Strong ceiling)
Resistance 3: $4,150 - $4,155 (Major barrier)
Resistance 4: $4,187 - $4,200 (Last week's high)
📈 TECHNICAL INDICATORS
RSI (14): 45-48 (Bearish momentum) 📉
RSI (1H): 52 (Neutral equilibrium - Dormant)
MACD: Bearish crossover confirmed ❌
Stochastic: Near oversold - Bounce potential soon ✅
Moving Averages:
Price BELOW 20-day EMA 🔴
Testing 50-day SMA support ⚠️
100-day MA holding (Long-term) ✅
Bollinger Bands: Contraction mode - Big move coming
Volume: Above average - Institutional activity present
🎯 TODAY'S TRADING STRATEGIES
SCENARIO 1: FURTHER DECLINE 🔴 (55% Probability)
On November 18, 2025, price of XAU/USD expected to decline
IF Gold Breaks Below $4,000:
This opens door for significant correction!
SHORT Setup (Aggressive):
Entry: Break below $3,995-$4,000 with volume
Targets:
TP1: $3,987 📍 (-15 pips from $4,000)
TP2: $3,930 📍 (-70 pips)
TP3: $3,886 📍 (-114 pips - October low)
Stop Loss: $4,032 (Above consolidation)
⚠️ WARNING: This is WITH the trend now - but use caution!
SCENARIO 2: SUPPORT BOUNCE 🟢 (35% Probability)
IF Gold Holds Above $4,006-$4,020:
Buyers defending $4,000-$4,040 support zone - Wyckoff spring confirmation possible
LONG Setup (Counter-trend):
Entry: $4,006-$4,012 (if bounce confirmed)
Targets:
TP1: $4,065 📍 (+55 pips)
TP2: $4,090 - $4,100 📍 (+90 pips)
TP3: $4,120 📍 (+110 pips)
Stop Loss: $3,998 (Below $4,000)
Risk/Reward: Good 1:2.5+ ratio ✅
SCENARIO 3: RANGE TRADING ⚪ (10% Probability)
IF Gold Consolidates Between $4,020-$4,090:
Scalping Strategy:
Buy: $4,020-$4,030
Sell: $4,080-$4,090
Targets: 30-40 pips
SL: Very tight (20 pips)
💎 BEST TRADE SETUPS FOR TODAY
CONSERVATIVE APPROACH (Highly Recommended!) 🎯
WAIT FOR CLEAR SIGNAL! This is a dangerous zone.
Setup A - Buy the $4,000 Bounce (Preferred):
Wait for price to TOUCH $4,000-$4,008
Look for strong bullish candle (rejection)
Entry: $4,010-$4,015 (after confirmation)
Target: $4,065 → $4,100
SL: $3,990
Why: Psychological level + High R:R
Setup B - Breakdown Short:
Wait for CLEAR break below $3,995
Entry: $3,990-$3,995 (after retest)
Target: $3,950 → $3,930
SL: $4,020
⚠️ DO NOT TRADE between $4,030-$4,070! No man's land!
🌍 FUNDAMENTAL ANALYSIS
WHY GOLD IS FALLING 📉
DXY Recovering - Dollar found support at 99.50 (61.8% Fib), bouncing back
Fed Hawkish Tone - Officials signaling cautious approach to rate cuts
Risk-On Sentiment - Equities rising, reducing safe-haven demand
Government Reopened - Uncertainty removed
Profit Taking - After 7% rally two weeks ago
BULLISH FACTORS (Long-term) ⬆️
✅ Analysts still predict gold may reach $4,456-$4,509 by end November
✅ Central banks purchased 634 tonnes YTD (Targeting 750-900)
✅ ETF holdings grew 619 tonnes ($64B) in 2025
✅ Geopolitical tensions persist
✅ Fed rate cut still possible December (though less certain)
BEARISH RISKS (Short-term) ⬇️
⚠️ DXY Strength - Dollar bouncing from support
⚠️ Technical Breakdown - Triangle pattern failed
⚠️ Momentum Bearish - MACD crossed down
⚠️ $4,000 Break - Would trigger stop losses
⚠️ FOMC Minutes This Week - Could show hawkish Fed
🔥 MARKET SENTIMENT: BEARISH SHORT-TERM
Analyst Views:
Today (Nov 18):
Expected to trade $4,000-$4,100 with DOWNSIDE bias
This Week:
Critical week - FOMC minutes could determine direction
Watch $4,000 level - break = $3,930 target
Month End:
IF $4,000 holds → Recovery to $4,200-$4,300 possible
IF $4,000 breaks → Drop to $3,886-$3,930 likely
💡 PROFESSIONAL GAME PLAN
For DAY TRADERS:
⚡ HIGH RISK Day!
$4,000 is THE level - trade the bounce or breakdown
Use VERY tight stops (15-20 pips)
Take quick profits (don't be greedy)
Best time: Wait for NY session clarity
For SWING TRADERS:
📊 Critical Decision Point
IF $4,000 holds with strong bounce → GO LONG (3-5 day hold)
IF $4,000 breaks cleanly → GO SHORT to $3,930
Don't trade in the middle!
For LONG-TERM INVESTORS:
💎 Patience Required
This could be THE dip to buy
Target: $3,950-$4,000 for accumulation
Vision: $4,500+ by 2026
Strategy: Dollar-cost average (don't go all-in yet!)
📅 KEY EVENTS THIS WEEK
Today (Tuesday):
Watch $4,000 level reaction
DXY movement crucial
Nvidia earnings (affects risk sentiment)
Wednesday:
FOMC Minutes Release (CRITICAL!)
Fed speakers
Thursday-Friday:
Economic data
Weekly close direction important
🎬 BOTTOM LINE (TL;DR)
Price: $4,024-$4,080 (Bearish)
Bias: 🔴 BEARISH (Short-term danger zone)
Key Level: $4,000 (Break = Big drop | Hold = Bounce)
Best Action: WAIT for $4,000 test, then act
Risk Level: EXTREME (Highest of the week!)
🔔 THE $4,000 LEVEL - MAKE OR BREAK!
IF GOLD HOLDS ABOVE $4,000:
✅ Bulls still alive
✅ Target recovery to $4,090-$4,120
✅ Buy the dip opportunity
IF GOLD BREAKS BELOW $4,000:
❌ Bears take full control
❌ Target $3,987 → $3,930 → $3,886
❌ Sell rallies strategy
BETWEEN $4,000-$4,090:
⚪ Indecision zone
⚪ Choppy price action
⚪ Wait for breakout!
📊 TECHNICAL OUTLOOK
Trend: ⚠️ BULLISH (Long-term) but BEARISH (Short-term)
Momentum: WEAK - Sellers in control 🔴
Support: TESTING at $4,000-$4,040 🚧
Resistance: STRONG at $4,090-$4,100 🔒
Pattern: Descending triangle breakdown / Bear flag
Next Move: Break $4,000 = DROP | Hold $4,000 = BOUNCE
⚠️ RISK MANAGEMENT - CRITICAL!
✅ Tiny Positions - Risk MAX 0.5-1% (Market dangerous!)
✅ Wide Stops - Give trades room (30-40 pips minimum)
✅ Quick Exits - Lock profits FAST if you get them
✅ Respect $4,000 - This is THE most important level
✅ No Revenge Trading - If stopped out, STEP AWAY
🎯 SWING TRADE SETUPS
Setup A - Support Bounce (High Risk/Reward):
Entry: $4,000-$4,015 (AFTER bounce confirmation)
Target 1: $4,090 (Hold 2-3 days)
Target 2: $4,150 (Hold 5-7 days if breaks $4,090)
Stop Loss: $3,985 (TIGHT!)
Setup B - Breakdown Trade:
Entry: $3,985-$3,995 (after confirmed break)
Target 1: $3,950 (Hold 1-2 days)
Target 2: $3,930 (Hold 3-5 days)
Target 3: $3,886 (Hold 1 week)
Stop Loss: $4,025
🏆 PROFESSIONAL ANALYSIS SUMMARY
Gold is at the MOST CRITICAL JUNCTURE this month. The $4,000 psychological level is being tested after:
3 consecutive days of decline
Triangle pattern breakdown
DXY finding support and bouncing
The Setup:
Price trading at $4,023.83 as of 18.11.2025
Expected trading range: $4,000-$4,100
Analysts expecting DECLINE today
Most Likely Scenarios:
Scenario 1 (55%):
Test $4,000 → Break below → Drop to $3,930-$3,950
Scenario 2 (35%):
Test $4,000 → Strong bounce → Rally to $4,090-$4,120
Scenario 3 (10%):
Chop between $4,020-$4,090 for 1-2 days
The Big Picture:
This is a CORRECTION within a long-term BULL MARKET. If $4,000 holds, this becomes a great buying opportunity for the move to $4,456-$4,509 by month-end.
💪 TRADING PSYCHOLOGY WARNING
THIS IS THE SCARIEST MOMENT!
When price tests psychological levels like $4,000, emotions run HIGH
Fear makes traders sell at the bottom
Greed makes traders buy too early
WAIT for confirmation! Don't predict, REACT!
🎓 LESSON: PSYCHOLOGICAL LEVELS
Why $4,000 is SO important:
Round Number - Easy to remember = many orders cluster here
Stop Loss Magnet - Bulls have stops just below it
Buy Order Pile - Bulls waiting to buy the dip here
Media Attention - "Gold below $4,000!" headlines create action
Trading Strategy:
Don't trade BEFORE it hits $4,000
Watch HOW it reacts AT $4,000
Trade the REACTION, not the prediction!
🔮 FORECAST
Today: Test $4,000 - Reaction determines next move
Tomorrow: If $4,000 holds → bounce | If breaks → $3,950
Wednesday: FOMC minutes = BIG volatility
End of Week: $4,100+ OR $3,930 (no middle ground likely)
Month End: Recovery to $4,200-$4,300 if $4,000 holds
🚨 CRITICAL WARNINGS
⚠️ $4,000 = NUCLEAR LEVEL - Massive volatility expected
⚠️ False Breaks Common - Wait for confirmation
⚠️ Stop Hunt Risk - Price may spike below then recover
⚠️ FOMC Wednesday - Save powder for that volatility
⚠️ Don't Catch Knife - Wait for clear signals
📊 SUPPORT/RESISTANCE SUMMARY
Critical Support: $4,000 (EVERYTHING depends on this!)
Strong Support: $3,987, $3,930, $3,886
Weak Resistance: $4,065, $4,080
Strong Resistance: $4,090-$4,100, $4,120, $4,150
Breakdown Level: $3,995 (Game over for bulls short-term)
Breakout Level: $4,100 (Bulls regain control)
📈 DXY CORRELATION
Important: DXY found support at 99.50 and is bouncing!
DXY up = Gold pressure ✅ (Happening now!)
If DXY breaks above 100.30 = More gold downside
If DXY fails at 100 = Gold relief rally
Watch DXY closely today!
⚠️ FINAL DISCLAIMER
This is the most dangerous trading day this week. Gold at $4,000 support is extremely volatile and unpredictable. This analysis is for educational purposes only. Never risk more than 0.5-1% on any trade today. Use stop losses religiously. False breakouts are common at psychological levels. Wait for clear confirmation before entering trades. The market can remain irrational longer than you can stay solvent. Past performance does not guarantee future results. Consult a licensed financial advisor before trading.
📱 Today is CRITICAL!
💬 Watch $4,000 like a hawk!
🔔 Extreme volatility incoming
⚡ Follow updates throughout the day
🙏 Trade safe, not big!
#Gold #XAUUSD #ForexTrading #TechnicalAnalysis #4000Support #CriticalLevel #RiskManagement #FOMC #DayTrading #SwingTrading #MarketAnalysis #PsychologicalLevel #Volatility

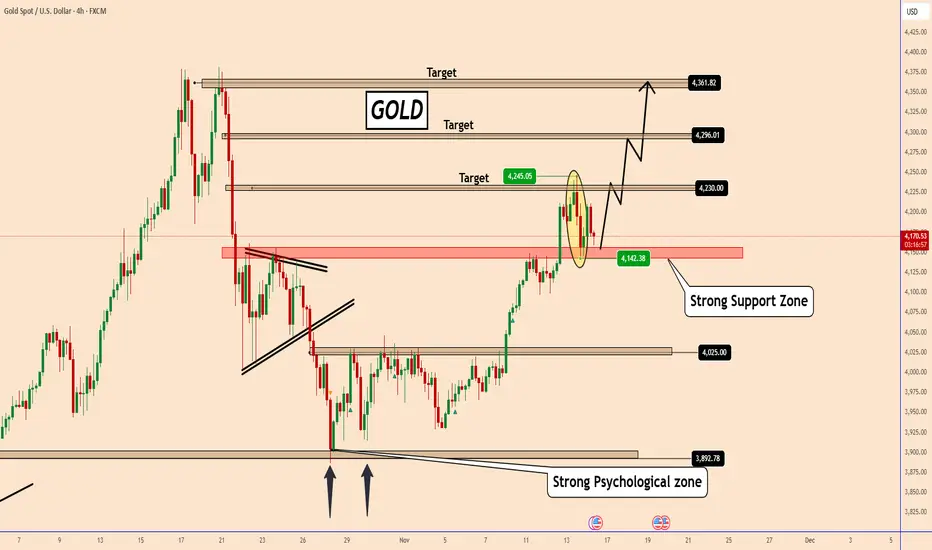
Gold: Bullish Structure Still Intact Despite Price VolatilityGold: Bullish Structure Still Intact Despite Price Volatility
Yesterday, Gold dropped nearly 2.5% in just one hour with no clear fundamental catalyst behind the move. The entire market reacted in an unusual, chaotic way.
Almost every chart showed extreme volatility at the same time.
During the spike, Gold fell from 4245 to 4142, tapping into a major structural support zone visible on the left side of the chart. So far, that area is holding, and if the market avoids another abnormal volatility event today, Gold may attempt to resume its broader bullish trend.
Interestingly, Gold had been climbing since Monday on expectations that the U.S. government would reopen. But the moment it actually did, Gold sharply reversed — a reaction that makes little sense from a fundamental perspective.
If the support zone continues to hold and normal price behavior returns, the bullish scenario remains valid.
Key Targets:
🎯 4230
🎯 4296
🎯 4360 (maximum extension)
You may find more details in the chart!
Thank you and Good Luck!
❤️PS: Please support with a like or comment if you find this analysis useful for your trading day❤️
XAUUSD: Market Analysis and Strategy for November 17thGold Technical Analysis:
Daily Resistance: 4250, Support: 4000
4-Hour Resistance: 4145, Support: 4030
1-Hour Resistance: 4110, Support: 4050
The technical picture is largely in line with recent analysis expectations. The weekly chart shows a pullback after a rally, making short-term bullishness somewhat difficult. The daily candlestick pattern's "rounded bottom" support remains intact, and the Bollinger Bands are narrowing. Historically, the risk of a further decline after a technical correction remains relatively high. Those who have been following my recent articles know the important level of 4030. Investors need to be cautious around 4030; a break below this level could lead to a short-term move towards 3930. If the price rebounds and recovers 4130/4160 in the short term, a bullish outlook is warranted, with the 4220/4250 area as a potential resistance level.
Based on the 1-hour chart, gold is currently in a short-term tug-of-war between bulls and bears, with overall market sentiment remaining weak. Watch for support momentum from the MACD/KDJ indicators.
NY Market Trading Strategy:
BUY: 4050 near
BUY: 4040 near
SELL: 4106~4110
More Analysis →

XAUUSD | Gold Signal |Now 24,2025TREND TARGET FOR TODAY 📊
Gold prices fell on Monday, extending Friday’s decline, as investors awaited more U.S. economic data for clearer signals on the Federal Reserve’s policy outlook.
Attention will mainly focus on September retail sales and PPI data on Tuesday, along with weekly jobless claims on Wednesday.
Expectations for a December rate cut have shifted after Fed Chair John Williams signaled support for another cut in the near term.
The market is now pricing in about a 70% chance of a 25-basis-point rate cut next month, compared to around 40% last Thursday following the strong jobs report.
XAUUSD trading strategy around key price areas:
♾️SELL XAUUSD 4102–4104
🚨SL: 4109
💰TP 1: 4097
💰TP 2: 4092
💰TP 3: 4087
💰TP 4: 4082
♾️BUY XAUUSD 4030–4032
🚨SL: 4025
💰TP 1: 4036
💰TP 2: 4041
💰TP 3: 4045
💰TP 4: 4050

GOLD USDHI GUYS,
We are to hold our entries till wed.
however for those that didn't make entries last week we have a pull back this Mon
to complete the Head shoulder price pattern.
The yellow trend-line for sells is not active or accurate as we need to make it to (wed) and adjustments will be made.

GOLD Risky Long!
HI,Traders !
#GOLD will soon hit
A wide horizontal support
Level around 4024.36 and
After the retest a local
Bullish rebound and a move
Up are to be expected !
Comment and subscribe to help us grow !

Gold Rebounds at Channel Support – Short-Term Bullish OutlookXAU/USD – Gold Analysis
After the recent drop in gold and the continued strength of the U.S. dollar, price has reached the lower boundary of the ascending channel. As long as this level doesn’t break, it remains a positive sign. Today’s candle has left a bullish wick with a solid body, showing that there is still buying interest at this support.
For today, I expect gold to move toward the mid-channel area, where the next reaction will give us more information about the short-term trend. Even though gold appears to be forming a bearish structure overall, it still needs to grab liquidity to the upside before continuing lower.
That’s why, for now, my bias for today is bullish, expecting a corrective move upward before the market decides its next major direction.

ANOTHER SELLA sell at 4034-40, sl at 4056 and I will try and update because buyers could push it up more

BUY GOLD NOW, FOCUS We Take a buy position here, and focus on 4035.076, AND IF MORE MOMENTUM Continues we could see, 4050.133 level been reached,
*TRUST THE SYSTEM*

XAUUSD STILL BULLISHInternal falling wedge created. Manage your risk properly!
ENTRY: 4090
TP1: 4180
TP2: 4200
SL: 4027

Gold Near Channel Support – Bulls Preparing for Another Leg Up?Gold ( OANDA:XAUUSD ) is approaching the Support zone($4,193 – $4,137) and the lower line of the ascending channel .
In terms of Elliott Wave theory , it looks like Gold is completing the main wave 4 .
I expect Gold increase from the Support zone($4,193 – $4,137) to Potential Reversal Zone(PRZ) and Resistance zone($4,316 – $4,270) .
First Target: $4,253
Second Target: $4,297
Stop Loss(SL): $4,133
Please respect each other's ideas and express them politely if you agree or disagree.
Gold Analyze (XAUUSD), 1-hour time frame.
Be sure to follow the updated ideas.
Do not forget to put a Stop loss for your positions (For every position you want to open).
Please follow your strategy; this is just my idea, and I will gladly see your ideas in this post.
Please do not forget the ✅ ' like ' ✅ button 🙏😊 & Share it with your friends; thanks, and Trade safe.
