OUTLOOK XAUUSD 15m Analysis (19th November 2025)Hey Guys, this is just a trade idea and not a financial advise.
BUY/SELL SCENARIOS:
BUYS:
1) Body Candle Close above the 4078.34 level.
2) Retest the 15m Bullish CHOCH at the 4078.34 level.
3) Create a 3/5m Bullish Engulfing Candle to capitalise on BUYS towards the 4145.00 level.
SELLS:
1) Body candle close below the 4059.57 level.
2) Retest the 15m Bearish CHOCH at the 4059.57 level.
3) Create a 3/5m Bearish Engulfing Candle to capitalize on SELLS towards the 3998.00 level.
Always trade with a trading and trust the process. Cheers
Trade ideas

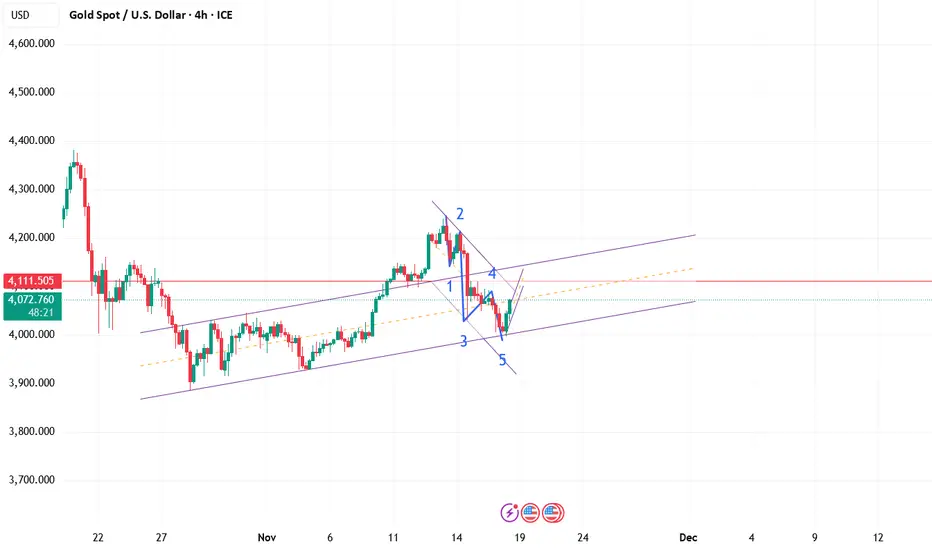
I expect a 3-wave upward correctionAn impulse wave is observed from 4245 to around 4000. This correction clearly consists of 5 waves that started with a reaction to the channel bottom. I expect a 3-wave upward correction.
Below 4,025 USD = continuation lower; above 4,060 USD = rebound.Gold is sitting on a knife’s edge.
Bulls are trying to defend 4,030 USD, but momentum still favors the sellers after the breakdown below 4,100 USD.
If 4,030 USD breaks, expect a slide toward 3,950–3,880 USD.
If buyers reclaim 4,060 USD, we could see a technical rebound toward 4,160 USD.
For now, the professional move is patience — wait for confirmation either way.
Below 4,025 → sell the continuation.
Above 4,060 → buy the reclaim.
Between those levels → stay out and protect capital.

XAUUSD 1-hour chart is preparing for the next corrective On the XAUUSD 1-hour chart, an ABC corrective pattern is developing, expected to push the price down to complete Wave 4.
* Waves A and B of this correction are already completed.
* The B wave shows a clear internal ABC structure with an overshoot, and the price has now started moving down, forming Wave 1 of the five-wave sequence that will complete the final C wave.

XAUUSD Analysis – Major Buy Zone Reached!Gold (XAUUSD) has finally tapped into the key demand zone between $4,000 – $4,020, a level that previously acted as a strong reaction point.
This zone has now been respected again with a clean liquidity grab below recent lows.
🔍 Market Breakdown
Price has been in a steady decline after rejecting the supply zone around $4,130 – $4,150 (highlighted red).
Today, we saw a sharp wick down into the green demand zone, showing buyer presence and absorption of sell-side liquidity.
FOMC and USD news lined up ahead increases volatility, but also increases the probability of a strong reversal from this zone.
📌 My Bias
I’m expecting: 1️⃣ A small corrective dip or retest back into the green zone
2️⃣ A strong bullish rally targeting the supply zone above
3️⃣ Final target around $4,130 – $4,150 if momentum holds
🎯 Buy Targets
Entry Zone: 4000 – 4020
TP1: 4075
TP2: 4130 (Main Target)
TP3: 4150 (Extended)
SL: Below 3985
⚠️ Why This Setup Makes Sense
Price swept liquidity beneath the previous lows
Buyers responded strongly from the demand zone
USD weakness expected around major news events
Clean imbalance above waiting to be filled
Strong bullish structure still intact on higher timeframes
💬 Engagement Question
Do you think Gold will respect this demand zone and push upward, or will news drag it lower?
Drop your opinion in the comments!👇🔥
If you want me to break down the next move after the news release, just comment “Update” and I’ll post a follow-up. 📈💬

Gold Awaits PPI & GDP – Buy Dips, Sell Rallies🟡 XAU/USD – PPI & GDP Data to Define Range Expansion
🔍 Market Context
Gold remains range-bound between $4000–$4100, consolidating after last week’s liquidity sweep.
This week’s key U.S. data — Core PPI, Retail Sales, GDP, and Core PCE — will likely dictate the next major move.
Slight improvement in inflation and consumption data could strengthen the USD temporarily, but overall bias remains bullish mid-term as the Fed is expected to maintain a dovish stance into Q1.
📊 Technical Outlook (4H Chart)
Main Sell Zone (Super OB): 4170–4200 → potential reversal supply zone.
Fair Value Gap (FVG): 4130–4160 → short-term reaction zone if price retraces.
Sell Zone: 4090–4095 → short opportunity aligned with intraday bearish structure.
Buy Zone 1: 4024–4025 → minor demand, expecting internal liquidity sweep.
Buy Zone 2 (Main OB): 4003–4001 → strong order block with multiple rejections; key liquidity pool.
Structure: H4 BOS (Bullish) intact, suggesting a liquidity sweep before next expansion upward.
🎯 Trade Plan
1️⃣ SELL Setup – Short-term reaction from FVG
Entry: 4090–4095
Stop Loss: 4100
Take Profit 1: 4055
Take Profit 2: 4040
Take Profit 3: 4025
➡️ Reasoning: Price is likely to tap the lower edge of FVG and sweep local liquidity before a downside reaction toward internal range demand.
2️⃣ BUY Setup – First demand zone test
Entry: 4024–4025
Stop Loss: 4022
Take Profit 1: 4065
Take Profit 2: 4080
➡️ Reasoning: Expecting a short-term liquidity grab below the mid-range before bullish continuation.
3️⃣ BUY Setup – Main OB accumulation zone
Entry: 4003–4001
Stop Loss: 3998
Take Profit 1: 4045
Take Profit 2: 4075
Take Profit 3: 4090
➡️ Reasoning: Deep liquidity zone aligning with higher-timeframe OB. If macro data disappoints, this area can trigger the next impulsive leg to retest 4170+.
🧭 Overall Bias
→ Ranging bias before Core PCE
→ Buy dips – Sell rallies within 4000–4100 until a clear breakout post-GDP/PCE data.
→ Watch for false breakouts around FVG and maintain risk control before U.S. session releases.

XAU/USD 24 November 2025 Intraday AnalysisH4 Analysis:
-> Swing: Bullish.
-> Internal: Bullish.
Analysis and bias remains the same as analysis dated 20 October 2025.
Price has printed as per previous intraday expectation by printing a bearish CHoCH which indicates, but not confirms, bullish pullback phase initiation.
Price is currently trading within an established internal range, however, I will continue to monitor price with regards to depth of pullback.
Intraday expectation:
Price to continue bearish, react at either discount of 50% internal EQ, or H4 supply zone before targeting weak internal high priced at 4,380.990.
Note:
The Federal Reserve’s sustained dovish stance, coupled with ongoing geopolitical uncertainties, is likely to prolong heightened volatility in the gold market. Given this elevated risk environment, traders should exercise caution and recalibrate risk management strategies to navigate potential price fluctuations effectively.
Additionally, gold pricing remains sensitive to broader macroeconomic developments, including policy decisions under President Trump. Shifts in geopolitical strategy and economic directives could further amplify uncertainty, contributing to market repricing dynamics.
H4 Chart:
M15 Analysis:
-> Swing: Bullish.
-> Internal: Bullish.
As per analysis dated 14 November 2025, price has printed a bearish CHoCH to indicate, but not confirm bearish pullback phase initiation.
Price is currently trading within an established internal range.
Intraday expectation:
Price to trade down to either discount of 50% internal EQ, or M15 demand zone before targeting weak internal high, priced at 4,245.195
Note:
Gold remains highly volatile amid the Federal Reserve's continued dovish stance, persistent and escalating geopolitical uncertainties. Traders should implement robust risk management strategies and remain vigilant, as price swings may become more pronounced in this elevated volatility environment.
Additionally, President Trump’s tariff announcements, particularly against China, are expected to further amplify market turbulence, potentially triggering sharp price fluctuations and whipsaws.
M15 Chart:

Elliot Wave TheoryElliot did a beautiful thing for us why analyzing the market for us
now we benefit fro his wave theory.
Good luck.

XAU/USD – Gold Under Heavy Pressure, 4,000$ Break Looks ImminentGold continues to slide as the US Dollar strengthens, fueled by resilient US data. With markets waiting for the final week of November and the upcoming FOMC decision, safe-haven flows remain weak—making XAU/USD extremely vulnerable to further downside.
📊 Technical Outlook – H1/H30
The short-term structure remains clearly bearish:
1️⃣ Trend Bias: Bearish
Price keeps rejecting the descending trendline.
Every pullback is shallow and absorbed quickly by intraday supply zones.
2️⃣ Key Technical Levels
Resistance / Supply Zones:
4,078 – 4,089
4,104 (major confluence: Fibo + H1 supply)
Support / Liquidity Targets:
4,023 – 4,013
3,989 – 3,975 → major liquidity zone (high reaction probability)
3️⃣ Scenarios to Watch
🔻 Scenario 1 — Continuation Drop (Primary Bias)
Break below 4,044 → targets 4,023, then the liquidity sweep at 3,99x – 3,97x.
🔄 Scenario 2 — Pullback Before Drop
Retracement to 4,054 – 4,078 → rejection → continuation lower.
🔺 Scenario 3 — Deeper Recovery (Low Probability)
Only valid if price closes above 4,104, unlocking a move toward 4,13x – 4,15x.
🎯 MMF Trading Plan
SELL – Trend-Following (Primary)
Sell Zone 1: 4,054 – 4,078
SL: 4,105
TP: 4,023 → 4,013 → 3,99x
Sell Zone 2: 4,089 – 4,104
SL: 4,112
TP: 4,054 → 4,023
BUY – Only as a Reaction Trade (Liquidity Sweep)
Buy Zone: 3,99x – 3,97x
SL: 3,955
TP: 4,023 → 4,054
⚠️ Buy setups are counter-trend and require strong confirmation.
Primary bias remains SELL as long as price stays below 4,104.
⚜️ MMFLOW TRADING View
Gold is being pushed toward the psychological 4,000$ support.
A clean break could trigger a broader bearish expansion into 3,98x – 3,95x.
With month-end positioning, FOMC expectations, and shifting Fed sentiment, volatility is likely to increase sharply.
Stay with the trend—SELL the rallies. BUY only at deep liquidity zones with confirmation.

XAUUSD set to retest weekly low?NFP positive data, has boosted DXY to existing bullish trend, as mirror effect on GOLD is continuing it's shorter term downtrend.
with back to back 2 daily doji at the weekly level, XAUUSD with today's Sydney session 4h closed with bearish engulfing candle with crossover of 10ema and 20ema signaling possible further drop.
Due to extended FVG below 4055.00 level, is price coming to retest weekly low?
Keep eye for more updates !

Gold view Gold bias remain bullish
Previous Resistance around-4045 - 4055 zone acting as support watching for potential bullish displacement, Invalidation closing below this zone Will turn Bias into bearish Till 4020 and 4000
This is not a financial advice

Gold Market Consolidates Awaits Non-Farm Payrolls Report; TechniGold Market Consolidates Awaits Non-Farm Payrolls Report; Technicals Slightly Bearish, But Blindly Chasing the Market is Discretionary
The gold market is trading in a narrow range amid a tense atmosphere ahead of the data release, with both bulls and bears awaiting tonight's non-farm payrolls report to break the deadlock.
The gold market is at a crucial crossroads. After months of consolidation, tonight's September non-farm payrolls report is seen as a key catalyst that could break this deadlock.
As the last official employment data before the Fed's December meeting, this report should have significant market influence; however, Wall Street is cautious about its reference value.
The Non-Farm Payrolls Suspense
This non-farm payrolls report comes against a very special backdrop—it is not only the first release of September data but also the last official comprehensive employment data before the Fed's December interest rate meeting.
Market analysts point out that the delayed release of the November non-farm payrolls data may further weaken the likelihood of a Fed rate cut, making tonight's data even more noteworthy.
Before the data release, market sentiment generally leans towards a technically bearish outlook for gold, but traders are also wary of potential unexpected volatility from the data.
Gold continued its consolidation within a range ahead of the non-farm payrolls data release. A bearish bias within this range remains the mainstream strategy, with very low participation from bulls throughout the day.
Technical Analysis: From a technical analysis perspective, the 4-hour chart for gold shows that the price failed to stabilize above the middle Bollinger Band during the daytime pullback, exhibiting a weak and gradual downward trend.
Key Resistance Levels: 4082, 4110
Core Support Levels: 4040, 4000
The market cannot rule out the possibility of a retest of the 4000 level, but blindly chasing the market in this range-bound pattern carries significant risk. A strategy of buying low and selling high is more prudent.
Short entry points are suggested in the 4110-20-30 area, with a secondary short entry point at 4147-50, targeting 4000 and holding if it breaks through. For short-term traders, repeated shorting opportunities can be initiated at the given resistance levels.
Trading Recommendations
For tonight's Non-Farm Payrolls report, a more cautious approach is advised:
Long Strategy: Buy gold around 4040-42, stop loss at 4032, target 4080, 4100!
Short Strategy: Consider shorting if the resistance level of 4110 (the high of the previous day) holds.
It is worth noting that tonight's Non-Farm Payrolls data is the first publicly released employment data in nearly two months, and it is expected to cause significant market volatility. Investors must manage risk carefully.
With the release of tonight's Non-Farm Payrolls data, the gold market may end its months-long consolidation and begin a new one-sided trend.
For cautious investors, waiting for the data release before following the trend may be a wiser choice; for short-term traders, a strategy of buying low and selling high before the data release can still be cautiously implemented under strict risk control.

Gold Short-Term Technical Analysis (November 21st)With the release of the hawkish minutes from the Federal Reserve, the US dollar index climbed back above 100, suppressing gold prices. Yesterday, gold rebounded after testing a low near 4055 in the US session, then rallied slightly to around 4110 in the early morning before weakening again. In the Asian session, it broke lower, briefly touching around 4040. During the European session, it fell again, touching 4038 before stabilizing and rebounding. It has repeatedly tested the support around 4040 without breaking it, and is currently fluctuating.
11/22 Gold Short-Term Trading Strategy
Sell gold near 4085, with a stop-loss at 4095, targeting below 4070/60. Buy gold near 4044/5f, with a stop-loss at 4034, targeting 4070/80.

Gold Multiple Bottom Rejection/Inverse Head and Shoulders PatterGold is also showing strong signs of a bullish correction. Multiple bullish patterns have formed and we can take that as a strong indication of bullish strength.

BULLISH MOVEPrice has broken a trendline after forming a inverted head and shoulder structure. Buyers are gaining momentum here

Gold Short-Term Trading Guide (November 18th)!!!The US released some unemployment claims data, and gold briefly broke through 4000 before experiencing a strong rebound. Is this rebound merely a flash in the pan due to the data, or will it help reverse the gold bullish trend?
First, we should note that gold is still generally weak. The 1-hour moving averages are still in a bearish crossover, indicating continued downward momentum. Gold is also still trading within a 1-hour downtrend channel. If gold continues to trade within this channel, the overall trend will likely remain one of oscillating decline. The upper resistance level of the 1-hour downtrend channel has now moved down to around 4068. If gold rallies below 4068, the strategy remains to sell on rallies.
Gold prices naturally fluctuate, just like the tides. Volatility creates opportunities. If gold cannot break through the 4068 level, the rebound may be short-lived. Until a break above 4068 is achieved, continue to sell on rallies.
US Session Trading Strategy:
Sell gold at 4060, stop loss at 4070, target 4000-3980;

Gold Holds the 4020 Support – Market Awaits the Next Breakout🔸 Market Overview
Gold trades around $4029/oz, slightly down. Daily range 4019–4055 shows strong volatility as traders await upcoming US data.
📊 Technical Analysis
• Short-term trend: mild bearish correction
• Resistance: 4042 – 4055
• Support: 4020 – 4012
• EMA20–50: price below → bearish momentum
• H1 Candle: long upper wick → sellers active
💡 Outlook
Above 4019–4020 → chance for a bounce to 4038–4045.
Below 4019 → drop toward 4010–4005.
No clear reversal yet — wait for confirmation.
🎯 Trade Setups
🔻 SELL XAU/USD: 4042 – 4045
🎯 TP: 40 / 80 / 200 pips
🛑 SL: 4049
🔺 BUY XAU/USD: 4019 – 4022
🎯 TP: 40 / 80 / 200 pips
🛑 SL: 4012

17-11-2025 _ Short Term Bullish Idea _ XAUUSD M301- Potential Flag Pattern.
2- After pullback between 61.8 - 78% Fibo Retracement expect a push to the Up Side.
Note: Only trade in case of a buy setup.

Gold Price Outlook – Trade Setup (XAU/USD)📊 Technical Structure
OANDA:XAUUSD XAUUSD Gold (XAU/USD) continues to drift lower, now trading around $4,030–$4,035, following a sharp decline from last week’s highs above $4,150. The 1-hour chart shows price pressing into a major support zone between $3,993–$4,005, which has historically attracted buyers.
Immediate resistance lies at $4,079–$4,089, a supply region that capped upside attempts earlier. A recovery toward the resistance zone is possible if the support zone holds, though the broader structure remains corrective.
A close below $3,989 would invalidate the rebound setup and expose downside potential toward $3,960.
🎯 Trade Setup
Idea: Buy from support zone for a corrective rebound into resistance.
Entry: $3,993 – $4,005
Stop Loss: $3,989
Take Profit 1: $4,079
Take Profit 2: $4,089
Risk–Reward Ratio: ≈ 1 : 4.95
Bias is cautiously bullish from support, but sentiment remains fragile due to macro headwinds.
🌐 Macro Background
Gold extended losses into Tuesday’s Asian session, trading near $4,030, weighed down by renewed U.S. Dollar strength and hawkish remarks from Federal Reserve officials.
FXStreet reports: “Gold price declines below $4,050 as USD strength and hawkish Fed comments weigh on sentiment.” 【FXStreet】
USD Strength:
The U.S. Dollar has strengthened for a third consecutive day, making gold more expensive for foreign buyers and pressuring the metal’s short-term outlook.
Delayed U.S. Data & NFP Ahead:
With the record-long U.S. government shutdown delaying official economic data, traders are now focused on Thursday’s NFP release, which may steer Fed expectations.
Hawkish Fed Commentary:
Officials including Atlanta Fed President Raphael Bostic and Kansas City Fed President Jeff Schmid expressed concern about persistent inflation and signalled a preference for keeping rates steady.
Rate Cut Expectations Drop:
CME FedWatch shows rate-cut expectations for December falling to 45%, down from over 60% last week.
UBS noted that the “totality of data” before the December meeting may still lean toward supporting a third rate cut this year.
China Buying Gold:
China added 15 tons to its gold reserves in September, providing medium-term support but insufficient to offset immediate USD-driven pressure.
Overall, macro drivers remain mixed: strong USD and hawkish Fed weigh on gold, while central bank demand and uncertainty offer a buffer at lower levels.
🔑 Key Technical Levels
Resistance: $4,079 – $4,089
Support: $3,993 – $4,005
Psychological Level: $4,050
📌 Trade Summary
Gold remains under pressure but is testing a major support zone around $3,993–$4,005. If this area holds, a corrective rebound toward $4,079–$4,089 is likely. However, continued USD strength or firmer Fed rhetoric could limit upside momentum.
⚠️ Disclaimer
This analysis is for reference only and does not constitute trading advice. Trading involves significant risk, and proper risk management is essential.

SELL XAUUSDI am selling Gold for the remainder of the week. Holding the sell. Trade what you see and not what you feel. I will take profits as we go down. It's weekend after all tomorrow.

The time is right to operate on the upper and lower rails.When gold prices rebounded to around 4095-4110, they encountered significant resistance. This price level is likely a key technical resistance area. It could be the starting point of the previous price decline (i.e., the previous high), an important psychological level, the upper Bollinger Band on the daily chart, or a significant Fibonacci retracement level, such as the 38.2% or 50% retracement level. Near this price level, selling pressure will significantly increase. From a candlestick pattern perspective, this could manifest as a bearish engulfing pattern, an evening star pattern, or consecutive upper shadows, all indicating that the upward momentum is gradually weakening. Therefore, placing short orders in batches around 4090-4110 is advisable, anticipating a pullback after the price encounters resistance and then tests the lower support levels.
The 4030-4020 area forms a strong support level within the current trading range. This level may be a low point platform formed by previous pullbacks, the lower Bollinger Band on the daily chart, or the location of the upward trend line. When the price pulls back to 4030-4020, it will attract bullish funds to enter the market to buy on the dip, while short sellers will also choose to take profits, thus forming buying support. From an indicator perspective, if the price touches the 4030-4020 area, the Relative Strength Index (RSI) may enter the oversold zone (e.g., below 30), signaling an impending price rebound. Therefore, placing long orders near 4030-4020 is an attempt to speculate on a rebound to the upper part of the trading range after the price finds support here. The stop loss is set below 4020 to prevent a larger pullback if the support level is effectively broken.
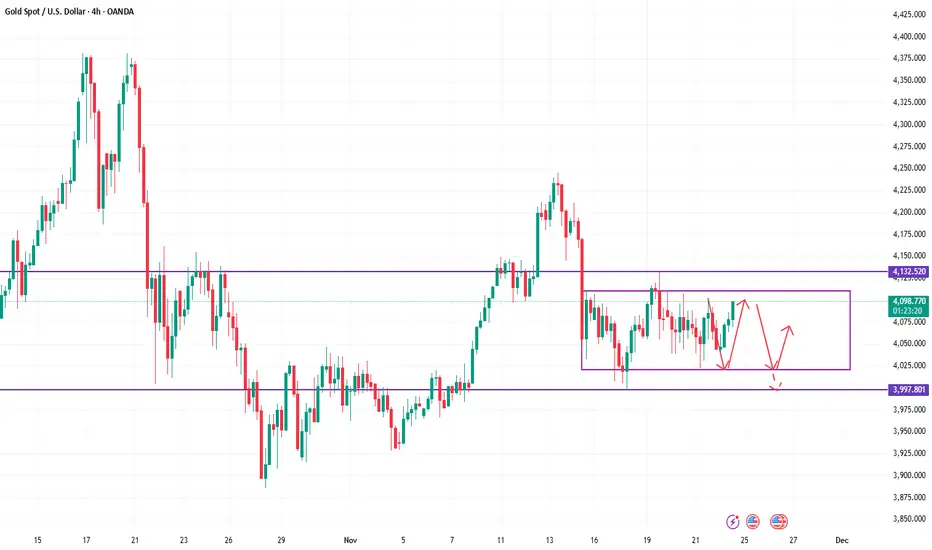
In summary, the gold market is currently oscillating within the 4030-4020 and 4095-4110 ranges. Trading strategies should revolve around a "sell high, buy low" approach. When the price approaches the upper limit of the range, look for shorting opportunities, targeting the lower limit; when the price approaches the lower limit, look for long opportunities, targeting the upper limit. This strategy often yields good results when the market lacks significant fundamental news. Specifically, short gold around 4095-4110, targeting around 4050; and long gold around 4030-4020, targeting around 4070.
XAUUSD: Market Analysis and Strategy for November 24thGold Technical Analysis:
Daily Resistance: 4145, Support: 4000
4-Hour Resistance: 4110, Support: 4022
1-Hour Resistance: 4085, Support: 4040
The weekly chart closed with a doji, putting pressure on short-term bullish sentiment. The consecutive doji closes on the daily chart suggest a slowdown in the short-term upward trend and exacerbate the expectation of consolidation. The upper Bollinger Band resistance continues to move downwards, and the price will need to focus on the 4040 level (the middle Bollinger Band) during the day. The next key level is 4000; a break below this level would warrant a short-term sell-off. If the price can recover above 4085 in the short term, a continued bullish trend is possible, with the 4140/4150 area as another resistance level to watch. Long-term holders can still look for buying opportunities around 3930/3920;
Looking at the 1-hour chart, gold rebounded after a decline in the European session, with the Bollinger Bands narrowing. The focus in the US session will be on the continuation of this rebound, with resistance levels around 4078 and 4092. The short-term range to watch is 4040-4100;
Trading Strategy:
BUY: 4040near
SELL: 4078~4085
More Analysis →

XAU Selling Model #2Hello everyone, Welcome to the XAU-SYNDICATE...
This is my entry model for selling. If the price holds within the bearish trendline and print a clean 15 min rejection candle backed by strong volume. I'll take that as my cue to execute sell positions from this zone, aiming for a short-term downside move.
#XAU-SYNDICATE
