Trade ideas

Tues 18 Nov - Latest UpdateLet's see how the Asian session goes.
Waiting for our plan setup for New York session.

GOLD BEARISH MOMENTUM BELOW 4084GOLD – MARKET OUTLOOK
Gold traded sideways between 4103 and 4055 on Monday as investors awaited key U.S. economic data for clues on the Federal Reserve’s rate path, following a sharp 2% decline in the previous session.
Below 4055: A 1H close beneath this support is expected to trigger further bearish momentum toward 4013 → 3979, confirming continuation of the downside bias.
Above 4103: A break and 4H close above this level would shift momentum to the upside, opening the way toward 4148.
Pivot: 25010
Support: 4055 · 4013 · 3979
Resistance: 4103 · 4148
Gold is currently consolidating within its pivot range — maintaining pressure below 4055 keeps the bearish outlook intact, while a stable move above 4103 would signal a bullish recovery.

XAU/USD – Gold Outlook as November EndsLast week, gold consolidated tightly between 4,040 and 4,110, building base ahead of what could be a very reactive December. Entering the final month of the year, seasonal dynamics may amplify volatility. On the fundamental side, all eyes are on a possible Fed rate cut:
If a cut does happen, gold could rally toward 4,180, the upper boundary of the ascending channel, as dovish Fed policy weakens the dollar.
If no cut materializes, the stronger dollar may force a breakdown below the channel, targeting ~3,930 as the next major support.
Technically, the consolidation zone acts as a launchpad — a breakout above or below will likely trigger a strong directional move. For now, gold remains in wait-and-see mode, with risk skewed to the catalyst from U.S. monetary policy.

Spot gold traded under pressure and fluctuated, with the market Spot gold traded under pressure and fluctuated, with the market awaiting US data for guidance.
On Monday (November 24), spot gold continued its recent decline, facing renewed selling pressure. Gold prices are currently trading around $4050 per ounce, down approximately 0.35% on the day. Despite conflicting signals from Federal Reserve officials, the US dollar index remains high, hovering near its highest level since late May, continuing to suppress dollar-denominated gold. Meanwhile, global stock markets generally strengthened, and market risk appetite rebounded, further weakening the appeal of safe-haven precious metals. Furthermore, signs of easing tensions in the Russia-Ukraine conflict may weaken gold's safe-haven premium, suppressing bullish momentum. Over the past week, gold has generally maintained a range-bound trading pattern, without a clear direction.
The US dollar index remains firmly above the important psychological level of 100, consolidating around 100.15 on Monday, just a step away from the late May high of 100.39. The market is closely watching a series of upcoming US economic data releases, including Tuesday's PPI and retail sales figures, Wednesday's initial jobless claims, and various indicators that have gradually resumed release since the US government shutdown. These data will provide key clues about the future direction of the US dollar and could inject new volatility momentum into gold, a non-interest-bearing asset.
On the other hand, market expectations for another Federal Reserve rate cut in December have intensified. According to the CME Group's FedWatch tool, federal funds futures traders have raised their probability of a December rate cut to 70%-74%. This optimism has boosted investor appetite for risk assets, with most Asian stock markets rebounding on Monday, further weakening the safe-haven demand for gold.
This week sees a flurry of key data releases, potentially setting a direction for gold.
The US will release a number of economic data points this week, including:
US September Retail Sales (MoM)
US September PPI (YoY and MoM)
US November Conference Board Consumer Confidence Index
US November Richmond Fed Manufacturing Index
US Initial Jobless Claims for the week ending November 22nd
These data will provide important insights into the health of the US economy. Weak data could reignite market expectations of a Fed rate cut, driving gold prices to rebound and potentially even back above $4100; conversely, strong data would reduce the probability of a rate cut, potentially causing gold to break below the key $4000 support level. Furthermore, the US dollar index is currently near a six-month high; if it continues to hold above 100, it will exert sustained downward pressure on gold prices.
Technical Analysis: The range-bound pattern continues; watch for a breakout.
From a technical perspective, gold traded in a range last week. Gold prices closed lower on Monday, rebounded after hitting a weekly low of $3998 on Tuesday, and then fell back on Wednesday, closing with a small bullish candle with a long upper shadow. Thursday and Friday saw consecutive doji candles. The weekly chart ultimately recorded a small bearish candle with upper and lower shadows, indicating a stalemate between bulls and bears.
From a daily chart perspective, since gold prices encountered resistance around $4132, they have repeatedly tested the lows and rebounded, suggesting that the current trend is a rebound rather than a reversal. However, there is significant resistance around the previous high of $4110, and further upward movement will be difficult without significant positive catalysts. Although gold prices briefly rose to $4100 last Friday, they failed to break through the previous high of $4110 and quickly fell back to around $4050, showing typical consolidation characteristics.
With a lack of major news stimuli at the beginning of this week, gold is expected to continue to fluctuate within the $4000-$4130 range. Trading should focus on range trading, paying close attention to breakouts at key levels. If gold prices fail to break out effectively, the consolidation pattern may continue. Trading Strategy Recommendations:
Overall Strategy: Range-bound trading, primarily shorting on rallies, with long positions as a secondary strategy. Strict stop-loss orders are essential to control position risk.
Short Position Strategy:
Short positions in batches around 4100-4105, with position size limited to 20% of total capital. Stop-loss at 8 points. Target 4050-4030, with a further target of 4020 if the price breaks below.
Long Position Strategy:
Long positions in batches around 4020-4025, with position size limited to 20% of total capital. Stop-loss at 8 points. Target 4040-4060, with a further target of 4080 if the price breaks above.
Key Resistance and Support:
Resistance: $4110-$4130
Support: $4020-$4000
Investors should closely monitor real-time market movements and data releases, adjusting their strategies accordingly.

Report 24/11/25Report summary:
Europe’s policy debate has pivoted from cyclical noise to structural urgency. Christine Lagarde warned that the euro area’s export-led “old growth model” is out of date and that years of inaction risk a slow grind lower in productivity and per-capita income. Her prescription is to deepen the single market and remove internal trade barriers so domestic demand can carry more of the load, a message sharpened by Germany’s protracted manufacturing slump. This is a meaningful shift in elite signaling: it frames EU stagnation as a design problem rather than a business cycle dip, and it implies a multi-year policy program that favors services, capital-market integration, and defense/tech over heavy industry status quo.
At the same time, Brussels is pressing ahead with a “reparations-style” loan that would use the income from frozen Russian assets to collateralize roughly €140 billion for Ukraine, despite competing ideas out of Washington to redeploy the funds for U.S.-led vehicles. The plan’s viability rests on EU political consensus and legal comfort with the primacy of sanctions law over sovereign asset protections; if it holds, it creates a medium-term floor under Kyiv’s financing and a fresh precedent for sanctions leverage in geopolitical bargaining.
Japan is moving the other way on the cycle: a new ¥21.3 trillion (~$135 billion) package mixes energy subsidies, cash handouts, and tax cuts to cushion real incomes and counter tariff-related shocks. Markets faded the “Truss moment” angst, but the bigger macro tell is in rates: Japan’s 10-year JGB yield is pressing multi-decade highs near ~1.78%–1.80%, reflecting both fiscal supply and a slow-moving regime shift at the BOJ. The policy mix, more fiscal, less BOJ repression, keeps USDJPY volatile, raises MoF intervention risk if disorderly FX develops, and re-prices term premia globally via portfolio rebalancing.
Over in the U.S., a different kind of regime change is underway in capital markets: the “AI capex” financing machine. Investment-grade titans and speculative-grade data-center developers have flooded debt markets; Oracle’s credit-default-swap costs jumped as issuance and leverage climbed, and analysts now talk about another ~$20–$60 billion from data-center issuers next year if financing conditions allow. The broader template is stark: Wall Street expects big-tech borrowing of roughly $1.2 trillion from 2025–2028 to fund an AI build-out that could approach $3 trillion in total spend, leaving equity, private credit, ABS, and vendor financing to fill the gap. That’s powering near-term growth but also tightening financial conditions for the marginal borrower and increasing draw-down risk if adoption proves S-shaped rather than exponential.
Energy geopolitics adds another shock-absorber/accelerant. Fresh U.S. sanctions on Russian oil have widened Urals’ discount to Brent, stranded sanctioned barrels at sea, and driven crude afloat to ~1.4 billion barrels while tanker day-rates jump. This raises freight-adjusted delivered prices for some buyers and lengthens supply chains as India and China probe alternatives in the Americas. If sustained, higher shipping costs tighten effective supply even if headline output is stable, a bullish skew for time-spreads and for crack margins if logistics bottlenecks persist.
U.S. monetary policy is the wild card short-term. The Fed is openly split after two cuts, with some officials citing firmer labor and sticky services inflation to argue against a December move; the shutdown-delayed data flow has complicated consensus-building. Markets that had priced a near-certain cut marked odds back to a coin-flip and the dollar firmed. This tug-of-war keeps rate-sensitive equities choppy and supports DXY on dips while curve steepening remains the path of least resistance if growth doesn’t crack.
Western trade policy is hardening. Allies are coordinating to contain subsidized Asian steel overcapacity, a step that would entrench defensive measures beyond the U.S. and EU and nudge input costs higher for downstream users. In the Americas, the White House removed 40% tariffs on slices of Brazilian food imports to temper U.S. food inflation, signaling tactical dial-a-tariff flexibility rather than a clean de-escalation of protectionism. The common theme is industrial policy with a CPI lens.
Market reactions and near-term setup
U.S. equities are oscillating between hopes of a gentle disinflationary glide and the reality of capital-intensive AI economics. November saw the Nasdaq slump as investors punished cash-burn-adjacent AI stories and questioned returns on the next $500 billion of big-tech capex, yet breadth improved late in the week as non-AI cyclicals rallied. Expect “violently flat” tape: big ranges, muted trend until a catalyst resets the earnings/discount-rate mix. Positioning is rotating toward cash-returners and old-economy beneficiaries of the AI build (power gear, engines, grid).
European risk assets are bifurcating. Banks and defense/aerospace remain relative winners on regulatory flexibility and fiscal rearmament talk, while exporters tethered to capex goods lag amid weak global manufacturing. Lagarde’s push for single-market deepening is equity-positive in the long run but slow-acting; near-term, EU assets key off the dollar and the U.S. rate path.
JGBs are under persistent pressure as supply and term premia reprice. Foreign inflows into long JGBs have picked up given improved hedged yields and life-insurer asset-liability shifts, but the market will still demand higher coupons if fiscal packages multiply. The BOJ’s slower purchase pace adds another marginal bear impulse. Expect global spillovers via reallocation out of U.S. duration, particularly on hedged bases.
Oil’s micro is dominated by logistics and refined-product dynamics more than OPEC headlines in the very near term. U.S. product demand is running a touch above 20 mb/d into late November, with gasoline normalizing and distillates steady; a prolonged tanker squeeze would tighten physical benchmarks even if OECD inventories look comfortable, a setup that can push Brent time-spreads into backwardation on shipping-led tightness.
Strategic forecasts (3–12 months)
For the euro area, the base case is low-trend growth with positive dispersion. Countries that execute on services liberalization and defense/dual-use tech will outgrow heavy-industry incumbents. A successful Russian-asset loan would stabilize Ukraine support and reduce tail-risk premia in European credit and FX by anchoring war financing, though Kremlin countermeasures are an overhang. The upside risk is a faster-than-expected single-market push that narrows the EU-U.S. productivity gap; the downside is political fragmentation that delays reforms and keeps potential growth sub-1%.
For Japan, modest real growth with rising nominal anchors is plausible if fiscal offsets persist and the BOJ gradually normalizes. The yen’s fair value shifts stronger over the horizon as real yields creep up and the current account benefits from capex-related reshoring and tourism, but path dependence is messy: any USDJPY slide below “lines in the sand” could trigger MoF action that sparks risk-off waves across Asia.
For the U.S., AI-led investment remains a growth prop, yet the financing mix raises credit-cycle sensitivity. If bond buyers demand wider spreads and private credit tightens structures, 2026 capex could slip to the low end of Street estimates for data-center developers. The soft-landing case still holds if labor eases without a profits recession, but the equity factor mix tilts from “duration + narrative” toward “cash + capacity to fund.”
Fiscal and political implications
Lagarde’s critique implies Brussels-level initiatives: capital-markets union, cross-border banking waivers, and defense R&D funding, all of which raise EU banks’ ROE and M&A option value if they materialize. Japan’s fiscal stance, tax cuts and subsidies, keeps households whole but lifts JGB supply needs and medium-term debt-sustainability questions. In the U.S., a divided Fed and a Congress that toggles between deregulatory pushes (e.g., accounting conflicts reconsidered) and tactical industrial policy keeps policy risk high for megacap tech, auditors, and regulated utilities powering data centers.
Key asset implications
Gold (XAUUSD) is a geopolitical hedge caught between elevated real yields and fresh conflict/energy frictions. With the Fed divided and the dollar bid on growth-and-carry, rallies can stall in the absence of a shock; sustained oil shipping tightness or an escalation in Ukraine would argue for renewed upside via risk premia and central-bank diversification. Think choppy with upward spikes on event risk.
S&P 500 and Dow Jones are likely to remain range-bound into year-end as earnings revisions flatten and the market digests the true cost of AI. Favor cash-flow-rich defensives, power-grid/engine suppliers riding off-grid data-center builds, and U.S. industrials with pricing power; fade thematic spikes in highly levered AI-infrastructure plays if spreads re-widen and CDS headlines recur.
USDJPY should stay positively correlated with global yields. Japan’s stimulus and BOJ gradualism keep dips shallow, but any acceleration toward 160 would invite verbal or actual MoF intervention; rallies back toward 150 would likely require either softer U.S. data or a BOJ policy surprise. Expect realized vol to stay high as life-insurers and foreign reserve managers rebalance.
DXY retains a carry and growth premium as long as the Fed resists rapid easing and European/Japanese yields lag on a hedged basis. Event-risk spikes tend to be bought, especially if EU reform is slow and Japan telegraphs only incremental normalization. A clear pivot from the Fed or a synchronized non-U.S. growth surprise would be needed to knock the dollar into a new down-trend.
Crude oil is fundamentally range-bound but tactically skewed higher on logistics. Elevated “oil on water,” rising freight, and U.S. product resilience offset soft spots in OECD macro. Watch how quickly India/China re-route to non-sanctioned grades and whether winter diesel tightens; a fast normalization of shipping would cap rallies, but another sanctions turn could put $5–$10 on Brent via spreads.
Playbook (30–90 days):
The market is rotating from “rates-only” narratives to a three-engine regime, policy mix, financing cost of AI infrastructure, and logistics-driven energy micro. In that mix the base case for the next one to three months is range-bound risk with violent factor swings: the dollar stays resilient on carry, global curves keep a mild steepening bias as Japan and Europe inch toward fiscal-led reflation, and oil trades the logistics tape rather than headline supply. Under that backdrop the most robust portfolio stance is barbelled: own quality cash generators and “picks-and-shovels” to the data-center build on one side, and convex hedges to financing or FX shocks on the other. Below are concrete trade expressions, triggers, and risk controls for your named assets, written to be executable without relying on a single macro outcome.
For gold (XAUUSD), treat the metal as event-volatility insurance funded by carry elsewhere. The near-term headwind is real yields when the Fed sounds cautious on further cuts, but the tail winds, sanctions volatility in energy markets, sovereign asset seizures crossing new legal lines, and central-bank diversification, keep upside convexity alive. Express longs through a call-spread ladder dated beyond the next Fed meeting to avoid theta bleed around speeches; a typical construction buys a call roughly 3% to 5% out of the money and sells one 8% to 10% out, sized so that the maximum loss is under one week of average P&L. If you prefer linear, add on dips that coincide with dollar up-days and U.S. 10-year breakevens steady to higher; cut if the dollar breaks out with real yields rising in tandem, because that mix historically compresses gold’s risk premium rather than reprices it higher. The hedge to a core long is a tight tenor risk-reversal (sell a small put to part-fund the call), but keep the short put notional capped so assignment would be a one-day VaR event, not a portfolio reset.
For U.S. equities via the S&P 500, run a “cash-plus-protection” frame rather than a pure beta bet. Earnings revisions are good but flattening as the street digests the true cost of the next leg of AI capex and the debt it rides in on. Overwrite strength in the index level with 30–45-day covered calls against quality positions that already yield high free cash flow; recycle the premium into 2%–3% out-of-the-money index put spreads, which finance cheaply when implied correlation is low. If you prefer outright index structures, a collar that sells a call roughly 4% out and buys a put 3% down, then sells a second put 7% down in smaller size, creates downside funding without over-insuring grindy tapes. Upgrade the factor mix inside the sleeve: overweight grid equipment, power electronics, engines and backup power tied to data-center build-outs, plus U.S. industrials with pricing power; underweight highly levered AI-infrastructure stories that require continuous market access. The invalidation for a constructive stance is a sharp, credit-led widening in IG spreads alongside a stronger dollar; that combo says “financing is the problem,” in which case switch from collars to outright long puts for a few weeks.
For the Dow Jones, lean into the value tilt as your relative hedge against a stumble in long-duration tech. A simple spread, long Dow futures versus short Nasdaq futures, keeps you market-neutral on U.S. growth while monetizing any further de-rating of capex-heavy stories. If you don’t run futures, you can synthesize with large-cap value ETF versus a mega-cap growth ETF, but keep the pair dollar-neutral and rebalance weekly because factor drift is high in this tape. The stop is not a level but a condition: close the spread if the 3-month change in 10-year real yields rolls over while IG spreads tighten; that mix usually re-accelerates duration leadership and hurts the pair.
For USDJPY, keep a two-handed plan: long-USD tactical swings on dips toward well-telegraphed “lines in the sand,” paired with cheap optionality for a policy or intervention surprise that strengthens the yen. The driver into year-end is still rate-differentials and issuance: Japan’s supplementary budget lifts JGB supply and nudges term premia up, while BOJ normalization remains incremental. Buy USDJPY on retracements that coincide with U.S. yields firming and oil bid, but carry a protective 1-by-2 put spread (long one nearer-dated USDJPY put, short two further-dated deeper-strike puts in much smaller notional) to monetize any Ministry of Finance shock move. Size the options so that, in an intervention gap-down, your delta flips long JPY rather than leaving you naked. If you own Japanese equities, consider funding partial FX hedges via rolling forwards when the basis softens; the carry drag is smaller than the earnings volatility from a fast yen rally.
For the broad dollar via DXY, the path of least resistance is still a buy-the-dip stance as long as non-U.S. growth is patchy and the Fed resists a rapid easing path. The way to trade it without basis noise is a basket: long USD versus EUR and GBP in larger weight and versus a liquid Asian cross in smaller weight to capture policy divergence. Use futures or forward points rather than options unless you specifically want tail cover; if you do, own USD calls struck just beyond recent highs with maturities that hop over the next central-bank meetings. The risk to this stance is a synchronized upside surprise in European services activity together with a BOJ signal that accelerates normalization; should that occur, flip to selling DXY rallies and close any EURUSD shorts first, because the euro will do the heavy lifting of any non-U.S. growth surprise.
For crude oil, trade the structure rather than the headline. Freight tightness, sanction routing and “oil on water” dynamics are as important to prompt pricing as OPEC chatter, and they predominantly express through time-spreads and cracks. If you have access to futures curves, a small long prompt-minus-next calendar (long the nearer month, short the next) benefits from shipping bottlenecks and inventory draw-downs without taking full flat-price beta; pair that with a modest crack-spread long if U.S. product demand firms into winter. If your toolkit is listed options on WTI or Brent, a diagonal call spread—long a nearer-dated at-the-money call and short a further-dated call a few dollars higher, lets you monetize a transient tightness while selling more expensive longer-dated vol. The invalidation is a rapid normalization in tanker availability or a clear downdraft in U.S. product supplied; if either occurs, close structure longs and keep only residual upside via cheap calls.
Risk management across the sleeve should emphasize condition-based exits and position sizing that assumes gap risk. For gold and crude options, cap premium outlay on each structure to no more than your average daily P&L to avoid “insurance becoming the risk.” For equity collars and put spreads, avoid clustering maturities: stagger them so you’re not forced to roll the entire hedge book on the same week. For USDJPY and DXY, treat policy meetings and unscheduled official comments as jump risk; keep some of the FX exposure in options so your first response to a gap is to adjust delta, not liquidate at the worst print. For the Dow-versus-Nasdaq pair, monitor credit spreads and real yields daily; those two variables explain most of the pair’s variance right now, and a regime flip there is your earliest warning to step aside.
Scenario mapping is straightforward. In a benign glide, U.S. growth okay, Europe improving at the margin, Japan steady, shipping constraints lingering, the dollar stays firm but not disorderly, gold grinds with episodic spikes, oil’s structure outperforms flat price, the S&P 500 chops but rewards cash-returning cyclicals, and the Dow-over-Nasdaq pair works. In a financing shock, AI-capex issuers pay up, IG spreads widen, and the dollar rallies, beta underperforms protection, the S&P 500 put spreads pay, Nasdaq lags the Dow, USDJPY pops higher unless MoF steps in, and gold initially stalls before catching a late safe-haven bid. In an intervention or policy upside shock, BOJ hints at faster normalization or MoF acts decisively, the yen strengthens abruptly, DXY softens, gold rallies alongside duration, oil dips on stronger yen and softer global growth expectations, and you monetize the USDJPY downside optionality while covering some equity hedges.

GOLD HIT OUR TARGET:+200 PIPS SECUREDHello my dear traders 🌟
As I shared with you earlier, we were expecting a bullish move on Gold — and it played out perfectly according to our analysis 🚀✨
📈 Profit from this setup: +200 pips
Great analysis → Great profits ✔️
If you don’t want to miss the upcoming analyses, entries, and targets,
stay with me, my trader friends 🙌💛

XAU Selling Model #1Hello everyone, Welcome to the XAU-SYNDICATE...
This is my entry model #1 for selling. so I'll wait for my zone, as soon as the price reaches my zone I'll look for a Liquidity hunt and bearish candle confirmation and plan my trade accordingly. 5-MIN, MSS after liquidity grab is most important part and extra confirmation.
#XAU-SYNDICATE


Testing Uncle Merlin from Excel 2003s StrategySimple as the chart. Dollar is strong. More discounted price on BTC.
Will BTC be the new Gold? Economic War Wise.
I've been wrong far too many times. So if this is wrong I'm right.
Does gold need more news to determine the main trend?Over the weekend, gold continued to move in an accumulation pattern – sideways, without forming a strong trend. It is expected that today the price will still fluctuate within the range of 4030 – 4109 (may deviate by 1–2 points). Therefore, the best strategy is to watch and trade within the range.
🔻 PRIORITY SELL ZONE
Watch for short sells when the price hits the following resistance areas:
4148-4150
4130-4133
4100-4103
4109-4112
4067 – 4065 (nearest area)
→ SL: 10 points | TP: 10 points
🔺 PRIORITY BUY ZONE
Watch for short buys at strong support areas:
4040 – 4042
4025 – 4020
3965 – 3960
→ SL: 10 points | TP: 10 points
📌 Important Note
Today, prioritize trading within the Sideway range, as the price may continue to accumulate.
When the market breaks 4030 or 4109 with a strong candle, consider chasing buys or sells in the breakout direction.
Within the range, the most effective strategy remains short reversal scalping according to the zone.

XAU/USD – Price Remains Trapped in a Sideways RangeXAU/USD – Price Remains Trapped in a Sideways Range, Market Awaits a Clear Breakout (H1 Analysis)
Gold continues to trade within a well-defined consolidation structure on the H1 chart, showing clear rejection from both the upper supply zone and the lower demand zone. This signals that institutional traders are accumulating positions before a stronger directional move.
The market is currently oscillating between the major support band near 4000–3990 and resistance around 4135–4140, forming a sideways compression with decreasing momentum. Price is reacting repeatedly to the EMA cluster and the mid-range Fibonacci levels, suggesting that liquidity is being built on both sides.
Key Technical Zones
Resistance zone: 4135 – 4140 (major supply, trendline confluence)
Mid-range resistance: 4068 – 4075
Support zone: 4000 – 3990 (strong demand, liquidity pool)
Secondary support: 4020 – 4010
Market Structure Insight
Price is creating a potential “fake-break and sweep” setup. Liquidity above the resistance at 4135 may attract a final push upward before the market reverses to sweep the lower range again. RSI remains neutral near the midline, supporting the idea of continued range trading. EMA alignment remains flat, confirming non-directional momentum.
Trading Strategy Ideas
1. Sell Strategy (Preferred in Range Market)
Wait for price to retest 4135 – 4140
Look for bearish rejection patterns (rejection wick, engulfing)
Target: 4068 → 4020 → 3990
Stop-loss above 4150
2. Buy Strategy (Counter-trend inside range)
Wait for a dip into 4000 – 3990 support
Confirm with bullish RSI divergence or EMA bounce
Target: 4068 → 4135
Stop-loss under 3980
3. Breakout Plan
Bullish breakout above 4140: Target 4200 then 4250
Bearish breakdown below 3990: Target 3940 then 3880
The optimal play is to continue trading the range until a clear breakout occurs. Remember to manage risk strictly and only trade confirmations, not emotions.

GOLD Bearish Setupbefore shorting i want to see the upside move till 4270 then we can go with the momentum of sellers let see...

xauusd high risk buysThis is a high risk and low probability trade. Am anticipating for Gold bullishness till ATH.
Please manage risk

Gold 15m support heading towards 4110Main Bias : Bullish (Buy) – The overall trend and recent price action suggest buyers are stepping in. Price recently tested a strong support zone and showed a clear reaction, indicating potential upward movement.
Entry Zone : Around 4,078 – 4,081 – This is a retest of a previous resistance now turned support (breaker level). Entering here gives a favorable risk-to-reward setup.
Stop Loss (SL) : 4,068 – 4,070 – Placed just below the support to protect against a deeper pullback.
Target (TP): 4,110 – 4,120 – The next major resistance area where price could face selling pressure.
Confluences:
Price bounced cleanly from the breaker support level
Candlestick reaction shows buyers are stepping in
Momentum aligns with the bullish bias, confirming the potential move upward
Summary : Look for a buy around 4,078 – 4,081, aiming for 4,110 – 4,120, with a stop around 4,068 – 4,070. The setup is supported by strong support (breaker) and confirming bullish price action, giving a clear and manageable trade plan.
This is not financial advice.

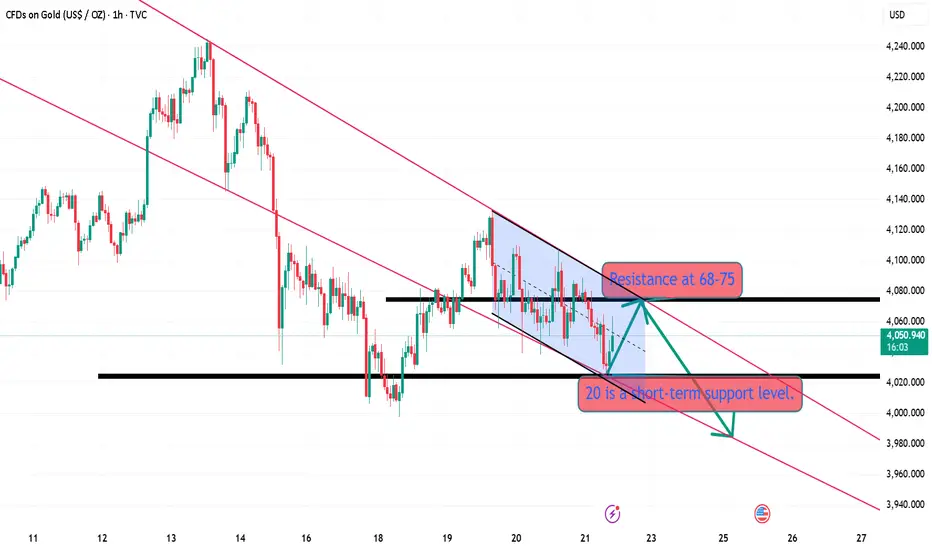
Gold Weekly Closes on November 21; Rebound Still BearishGold prices rebounded quickly to around 4088 after opening before continuing to fall. Key support lies around the previous low of 4020, which is the last line of defense for the bulls. A breach of this level would open up further downside potential, with the next target likely around 4000. However, this is only the first small target; a further break below this level could lead to a retest of the previous low of 3900.
From the 4-hour chart, the key resistance level to watch is 4076-85, while the key support level is 4020-25. Technically, a pullback is more likely. We will patiently wait for key entry points.
monitoring bearish trend breaking support target 3860 and 3770
weekly bottomed after 3770
possibly the start of a bearish trend to 3440 on the monthly, but we will see a retracement up on the bottomed weekly first


POssible 1:5 R2R on XAUUSDThis is a Follow up after the first entry from the previous post, Target 1 has been hit @ 4101 .
Still with Targets 2 and 3 in sight, we will b e anticipating a break and close above the 4089 price zone for a possible reentry as described in chart to target between 4172 - 4211 .
No Entry until this requirement
This is something to look out for upon the release of NFP today
Else, a possible Slide down to $3900
Patience is the way! Ieios

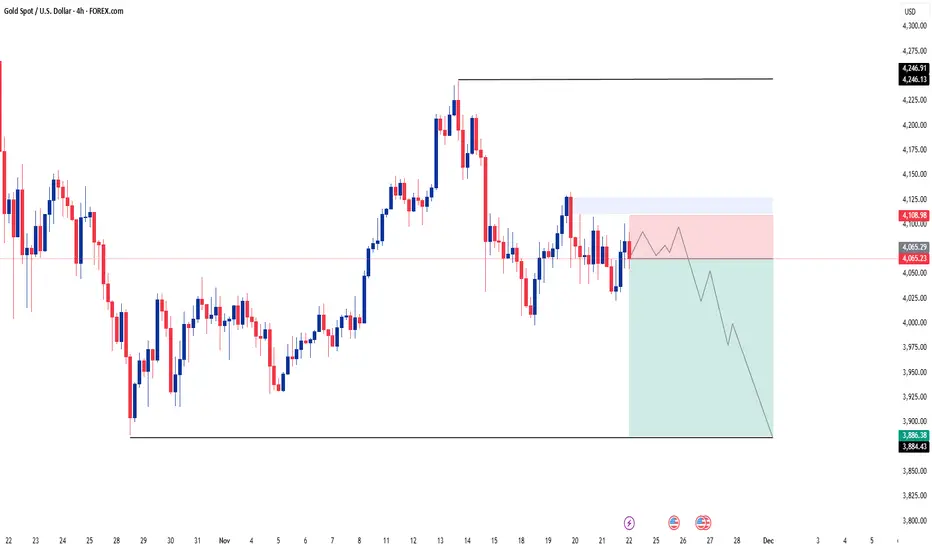
XAUUSD : Bearish Flip Targets $3930 LiquidityKey Observations and Interpretation
Previous Trend: The price experienced a strong bullish move, peaking around the $4,240 level, followed by a significant retracement.
Break of Structure (BOS): There was a previous Break of Structure (BOS) to the upside around $4,040, which indicated the start of the recent upward move. The price has now retraced back to and below this level.
Market Structure Shift/Change of Character: The move from the $4,240 peak down to the recent low near $3,990, followed by a lower high (X) at approximately $4,120, suggests a potential shift in market character from bullish to bearish.
Inducement/Minor Liquidity Sweep (I/S): The price action that led up to the high at X seems to have swept minor internal liquidity (I/S) before the larger drop.
Demand Zone/Fair Value Gap (D/FVG): The shaded area between roughly $4,040 and $4,070 represents a zone that was likely a prior demand zone or contains a Fair Value Gap (FVG). Price is currently interacting with this zone. In a bearish scenario, this zone is expected to act as resistance (a supply zone) after the structure shift.
Target Liquidity ($$$): The chart highlights multiple clear liquidity targets below the current price, marked by the triple dollar signs ($$$). These are levels where retail traders have likely placed stop-loss orders or where sell-limit orders are resting. These levels are approximately:
$3,980
$3,960
$3,930
📉 Projected Move
The analysis projects a likely scenario where the price:
Tests/Fills the D/FVG Zone: The price may experience a small bounce or consolidation within the $4,040 - $4,070 D/FVG zone (now acting as potential resistance/supply).
Continuation Lower: From this zone, the expectation is for the price to continue its move down.
Liquidity Sweep: The primary targets for the bearish move are the highlighted liquidity levels ($$$) below the $4,000 psychological level, with the deepest target around $3,930.

Where Can Gold (XAUUSD) Take a Correction?Looking at your chart, Gold is moving up in a short-term recovery, but there are strong resistance zones above where a correction (downward move) can happen.
1️⃣ Zone: 4113 – 4120 (Current Area)
This is a minor resistance.
Small pullback is possible but not a major reversal zone.
2️⃣ Major Resistance Zone: 4143 – 4147
This is the first strong supply zone.
Price fell sharply from this zone earlier.
This is the most likely area for correction.
3️⃣ Strong Resistance: 4176 – 4180
If price continues upward, this is the next major resistance.
High probability that gold will correct from here.
4️⃣ Upper Resistance: 4200 – 4207
This aligns with your upper trendline.
This is the highest and strongest reversal zone.
A deep correction can start from here.
Stay Tuned For More Updates

XAUUSDNote that these analyzes are only for recording personal accounts and journals that will be reviewed in the future.
Please do not enter into any trade just by viewing the analysis, thank you.

GOLD USDHI GUYS,
UPDATE
GOLD has made it to take profit zone , a delay today has changed the sell structure .
sells, soon. keep your eyes open.
possible news today.
