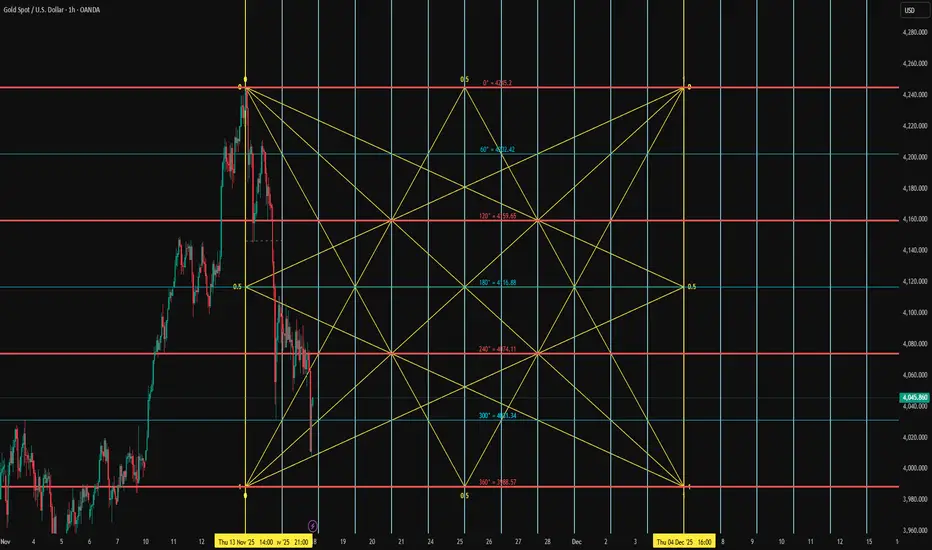
Gold still in it's year-end range, good scalping opportunitiesThis year's high is in, the same forecast as last year if you watched with me this time last December.
We can expect that the new year candle will target the previous high quickly and swiftly as always, but until then we scalp this year-end wick range using LTF OB/FVGs for minimal pip TPs
Trade ideas

XAUUSD - REJECTING THE DAILY ORDER BLOCK, BULLISH CONFIRMATION Gold is forming a bullish structure after rejecting the daily Order Block, which is acting as strong support.
🟢 1st Scenario:
Gold may continue pushing up toward 4200 , which is the H4 Order Block acting as resistance.
From this level, price may either reject or break through the area.
🟢 2nd Scenario:
If Gold can break above 4200 and form a clear break-and-retest structure, the trend is likely to continue.
The next important level to watch is 4340 .

Congrats Traders — Gold Delivered Exactly as Expected 7 Hrs AgoCongratulations to everyone who followed the analysis from 7 hours ago.
Gold respected the Survival Zone (4010–3998) perfectly — price touched 3998, failed to break lower, and launched a strong rally all the way to 4082, exactly as projected.
Current price: 4060
This reaction reinforces how critical the 3998–4010 zone remains. Buyers stepped in aggressively, proving once again that technical levels dominate the market — not headlines or emotions.
Market Notes
Clear rejection at 3998 triggered a clean bullish impulse.
Momentum held until 4082, completing the projected move.
Current pullback near 4069 suggests continued volatility and two-sided trading.
Updated Technical Outlook
Holding above 4055 keeps short-term momentum on the bullish side.
A strong break above 4085 opens the door toward 4096 → 4111 and possibly higher.
Any return to 4010–3998 will once again be a decisive battle zone for gold.
Final Notes
We remain neutral, disciplined, and fully guided by the chart.
Price action is the only truth — follow levels, not emotions.
Manage risk. Use proper stops.
Wishing everyone continued success and consistent gains.

LOOKING TO BUY INTO GOLD AGAINXAU/USD 1H - I think its time to start looking to buy into Gold again, as you can see on the left of the screenshot price has broken structure on the higher timeframes to the upside.
This has indicated an end to this bearish momentum and potentially the start of the next bull run. Now that price has come back down to correct itself fractally we have even more of an indication.
All we need now is further confluence which will come from Demand being injected into this market, as you can see we have had that, price has created a large bullish candle.
I would love to see price pullback now into a fractal Demand Zone, giving us the opportunity to get involved in this market with a more refined entry, time will tell though. We should be prepping for longs.

Key Gold Reversal Times for Daily Trading“Time-based analysis focuses on identifying the specific times when the market is likely to reverse or show strong movement. Instead of analyzing only price levels, it studies cycles, timing patterns, and repetitive market behaviors to predict when major or minor turning points may occur.”
Gold: Bullish Momentum Pauses Before the Next Move Gold: Bullish Momentum Pauses Before the Next Move
Gold kicked off the week with an aggressive rally, recovering nearly 50% of the previous drop from 4380 to 3880 in just 24 hours.
Price is now testing a key resistance area around 4130–4150, where we’re seeing a short-term pause in momentum. This could signal that Gold is gearing up for the next impulsive leg to the upside.
However, caution is advised — this pause might develop into a deeper or longer correction before the next move higher. Despite that, the broader trend remains bullish, with no clear signs of reversal for now.
📈 Key Targets:
4190
4230
4360
You may find more details in the chart!
Thank you and Good Luck!
❤️PS: Please support with a like or comment if you find this analysis useful for your trading day❤️

XAU Swing Trade Set upBB set ups for long and short.
Monthly is still Bullish and needed to touch the opening monthly,

XAUUSD (Gold) Analysis Setup Price is moving inside a small rising channel toward a demand zone. If price breaks below the channel and retests, a short-term pullback toward the demand zone is possible before the next big move.
Summary:
Setup: Rising channel → possible correction
Short Target: Demand zone
Confirmation: Break + retest of channel support
If you want, I can create a cleaner version or provide a long idea too
Support with Boost and Comments .

GOLD Overall Structure (1D Timeframe)✅ 1. Overall Structure (1D Timeframe)
• A descending corrective channel (yellow lines)
• Major rejection at the channel top
• Price making lower highs (LH) → still bearish structure
• Price currently sitting below the mid-range of the channel
This means:
👉 Gold is still in a corrective downtrend, not bullish yet.
👉 High probability the market wants to fill lower OBs before any breakout.
________________________________________
✅ 2. Key Areas I Highlighted
🔷 1D TF FVG (4,107–4,150) – Major Resistance
• This zone is extremely important.
• Price has failed here multiple times already.
• As long as price is below this → bearish pressure continues.
This is the “breaker” level for bulls.
________________________________________
🔴 1D OB Zones Below (Demand Areas)
I mapped the OB zones correctly:
1️⃣ OB: 3,990 – 3,950
• First liquidity target
• Already almost tapped/mitigated
• Still valid for another reaction
2️⃣ OB: 3,929 – 3,885
• Stronger demand
• Highly likely to get tapped if the rejection continues
• My trendline bottom also aligns here → confluence
3️⃣ OB: 3,800 – 3,700
• If price breaks deeper into channel
• This is the next liquidity layer
These OBs line up perfectly with my descending channel.
________________________________________
Extreme Liquidity Below
I noted:
• 3100
• 3000
• 2600
These are macro liquidity harvest levels, NOT near-term.
Price falls here only if:
• Channel breaks down
• Major macro bearish shift occurs
→ Not likely in the next few weeks unless massive catalyst.
________________________________________
✅ 3. Updated Structural Reading (Using New Drawing)
A. Price recently failed to break the upper channel
This supports more downside.
B. I drew an ABC correction
The new chart also still shows:
• A → B → C decline likely forming
• Potential completion at the lower trendline
This supports a drop before any rally.
C. My white projection (V-shape recovery)
This large bullish projection is valid ONLY if:
• Price touches lower OB
➡️ 3,929 – 3,885
• And then breaks back above
➡️ 4,150
Only then the big bullish run can start.
________________________________________
📉 4. Most Likely Path (Updated With New Chart)
Based on my new structure:
Primary Scenario (70% probability)
Price drops to the lower OB:
→ 3,929 – 3,885
Possibly even wick into:
→ 3,800 – 3,700
Then:
Strong bounce → retest 1D FVG (4,107–4,150)
If rejection again → continuation inside channel.
________________________________________
Bullish Scenario (30% probability)
For my yellow arrow to be valid:
1. Price must touch the lower OB
2. Then form a strong reversal
3. Then break upward out of the descending channel
4. Then close above 4,150
5. Target becomes: 4,380 → 4,800
This matches my yellow long-term projection.
________________________________________
🎯 5. Key Levels to Watch (Updated)
Immediate Support
Level Significance
3,990 Weak OB – might not hold
3,950 First real support
3,929 – 3,885 🔥 Strong OB + channel bottom confluence
Immediate Resistance
Level Significance
4,107–4,150 🔷 Strong 1D FVG (must break for bulls)
4,200 Channel breakout level
4,380 First macro target
________________________________________
⭐ 6. Simple Final Summary (Very Clear)
My new chart indicates:
✔️ Market still bearish inside descending channel
✔️ Price likely drops to 3,929–3,885 OB
✔️ This is the best zone for bullish reversal
✔️ Bulls must break 4,150 to confirm trend change
✔️ If breakout happens → target 4,380–4,800
✔️ If OB fails → deeper channel drop to 3,700 OB
I drew the structure correctly. The analysis fully matches my levels.

Gold BUYFurther upside for gold , Grey lines are key levels for me waiting for a pullback into the fvg zone for a possible buy

Gold (XAU/USD) – Market Structure Analysis | November 24, 2025Bias: Neutral → Slight Bullish
Key Level to Watch: 4,075.24 USD
Gold is stabilizing inside a tightening consolidation zone, holding structure above the 4,040–4,000 support region while struggling to secure acceptance above the 4,100 psychological level. This compression indicates reduced volatility and signals an upcoming breakout as liquidity builds on both sides of the range.
Intraday order-flow shows buyers stepping in with higher lows and a steady recovery back into resistance. However, the broader structure remains neutral until a decisive break confirms directional dominance.
⸻
Technical Breakdown
Market Structure
• Market is range-bound between 4,000–4,100, forming a compression pattern
• Higher intraday lows indicate emerging bullish presence
• No confirmed breakout yet — market remains balanced
Key Resistance Zones
• 4,075.24 – Initial reaction level
• 4,087.69 – 4,090.45 – Critical breakout band
• 4,099.86 – 4,104 – Upper resistance cluster
• 4,150 – Higher-timeframe structural resistance
Key Support Zones
• 4,044.09 – Immediate intraday support
• 4,036.62 – Secondary support
• 4,032 → 4,000 – Structural support and bearish validation floor
⸻
Outlook & Interpretation
Gold remains in a neutral structure with slightly improving bullish sentiment. For buyers to take full control, price must break and hold above the 4,087–4,090 region. Until then, the market sits in equilibrium, with both sides defending key liquidity zones.
⸻
Trading Plan
Bullish Scenario
Break and hold above 4,087–4,090 → upside targets:
• 4,099 → 4,104 → 4,150
Neutral Scenario
Price remains between 4,044 – 4,087 → expect continued consolidation and liquidity build-up.
Bearish Scenario
Break below 4,044 → downside targets:
• 4,036 → 4,031, with 4,000 as the broader structural support.

Gold short-term biasLooking at the Supply levels, am bearish for now on XAU until price breaks the high of the upper supply

1. Gold Correction Completed Bullish Move AheadBased on the previous analysis, we were expecting a price correction. Gold reacted perfectly and the correction provided a profitable move for us.
Now, we are anticipating a bullish movement.

LiamTrading – XAUUSD H1 | Monday Scenario LiamTrading – XAUUSD H1 | Monday Scenario
Wait for gold to retest the upper trendline before choosing a direction
Quick Overview
On the H1 chart, gold is still oscillating within a triangle pattern with a descending upper trendline and a gradually rising lower trendline. In my opinion, the price still needs an upward move to retest the upper trendline – coinciding with the FVG + POC Volume Profile area – before deciding to create a new trend (either breaking upwards or continuing to decline).
Regarding the USD, many Fed officials have started signaling a potential rate cut, but remain very cautious. UBS and Barclays both lean towards the scenario of the Fed cutting rates in December if upcoming data continues to be weak. This makes it difficult for the USD to break out too strongly, creating room for gold to technically rebound to resistance areas.
Technical Analysis H1
Current structure: price is moving sideways accumulating, with lower highs following the descending trendline, and lows supported by the lower trendline.
Area 4079–4081:
FVG + POC Volume Profile.
Coinciding with the upper trendline → a very strong resistance convergence area, suitable for a sell scenario based on reaction.
Nearest support area: around 4040–4035; if this area breaks, the likelihood of the price returning to test 4010–4000 is quite high.
A clear bullish reversal signal is only evident if the Dow structure increases again, at least when the price breaks above and holds above 4061 and then surpasses the descending trendline.
Reference Trading Scenario
Sell at FVG + POC + trendline (priority)
Entry: 4079–4081
SL: 4086
TP: 4060 → 4045 → 4010
Logic: The price is expected to be pushed up to fill the FVG and touch the POC/trendline before sellers return. This area converges many technical factors, so the win rate is better compared to selling in the middle of the sideways range.
Buy when the bullish structure is confirmed
Condition: price breaks above 4061 and closes the H1 candle holding above this area, while also escaping the descending trendline.
Reference Entry: 4061–4068 (retest the breakout area)
SL: 4050
TP: 4095 → 4130 → 4150
At that point, the triangle pattern is broken upwards, the Dow increase returns, prioritizing buying according to the new trend instead of trying to sell the top.
Trading Notes
Areas for short scalping: 4060, 4040, 4010, 4130 – always wait for clear candle reactions on M5–M15 before entering orders.
Each order should only risk 0.5–1% of the account; when the order reaches about 1R, move SL to breakeven to protect capital.
If you have a different scenario for XAUUSD H1 today, leave a comment and follow the LiamTrading channel to update the daily gold plan on TradingView.

XAU/USD Weekly Outlook | Gold Stuck in Consolidation RangeGold ended the week stuck inside a broad consolidation range, trading between 4052 support and 4098 resistance, showing indecision as neither buyers nor sellers have been able to take control.
Both the MA50 and MA200 are flat, reflecting a lack of strong directional momentum — the market is in balance, waiting for a catalyst.
Buyers need a confirmed break and sustained hold above 4098, followed by a break of 4142, to shift momentum. Until then, any upside attempts remain corrective within the range.
Failure to reclaim 4098 increases downside pressure. A drop below 4052 would expose the
4016–3968 Support Zone. If selling momentum extends further, gold could slide into the HTF Support Zone at 3921–3862, which is a major higher-timeframe demand area.
📌 Key levels to watch:
Resistance:
4098
4142
4198
4232
Support:
4052
4016
3968
3921
3862
🔎 Fundamental focus:
This week brings key U.S. data releases such as Core PPI, Retail Sales, Consumer Confidence, and Durable Goods Orders. With gold stuck in a range, any surprise in inflation or consumer strength could spark volatility.

Negative factors continue to dominate the short-term trend. Negative factors dominate, suppressing the upward trend of gold prices.
Diminished expectations of interest rate cuts + Support from the US dollar: Currently, the probability of the Federal Reserve cutting interest rates in December is only 10%, and Morgan Stanley has even completely abandoned this expectation. As an interest-free asset, the fading expectations of interest rate cuts will significantly reduce the attractiveness of gold. At the same time, the US dollar index has formed a solid support at 100.3, and gold and the US dollar usually have a negative correlation. The strength of the US dollar will continue to put pressure on gold prices, which is the core factor suppressing the gold price next Monday.
-Decline in geopolitical risk demand: Recent cease-fire negotiations between Palestine and Israel have continued, and the conflict in Ukraine has also sent out signals of cooling. Previously, the risk-averse funds that bought gold due to concerns over geopolitical conflicts are gradually withdrawing. The decline in risk-averse demand has deprived gold of an important upward momentum. This trend is likely to continue until next Monday, further suppressing the gold price.
-Weak technical signals: On November 21, the international gold price has fallen below the key support level of 4050 US dollars, and is at the end of the triangular convergence range, showing a trend of continuously lower highs. The weak technical pattern will affect investor sentiment. Short-term there will be few large-scale buy orders to support the gold price, and even some investors may prematurely sell for risk aversion, further intensifying the downward pressure on the gold price.
Next week's gold strategy analysis
sell:4075-4065
tp:4055-4035-4000
sl:4085

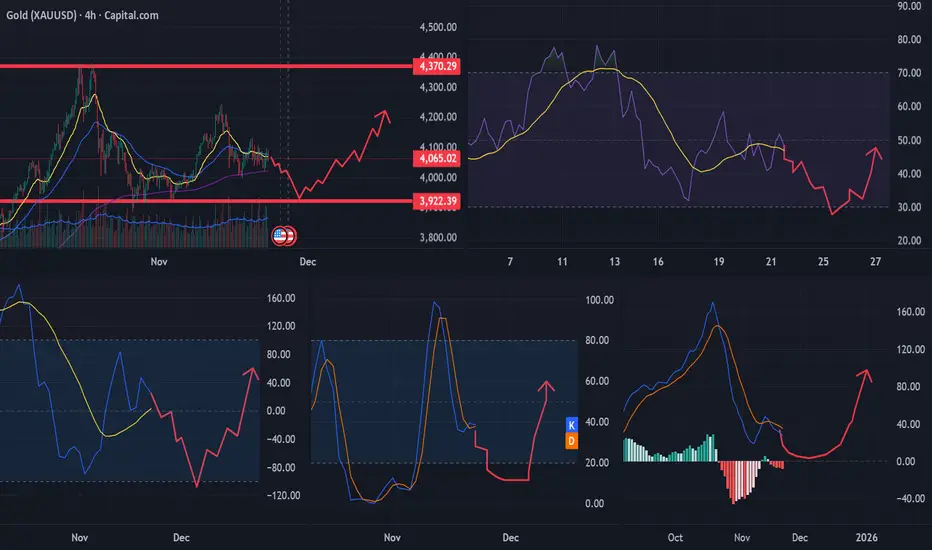
Gold Weekly Summary and Forecast 11/23/2025Gold moved in ranges last week but eventually printed a green candle in 2W TF. I am expecting the price to continue to rise in regards of overall bullish trend. Possibly touching previous ATH at 4380.

Gold Preparing for 3920–3950 Retest Before Bullish ContinuationMonthly timeframe (1M)
Gold historically spends 3–4 months in a consolidation or bounce range before continuing the macro trend.
After a parabolic move up, the current monthly candle shows a large top wick, signaling temporary buyer exhaustion – but the long-term trend remains firmly bullish.
Weekly timeframe (1W)
Price made a clean retest of the 20EMA, which is a textbook “healthy pullback” in strong uptrends.
RSI coming off the overbought zone with a mild bearish crossover.
CCI clearly trending down.
MACD showing the first signs of a potential rollover, but no confirmed bearish cross yet.
Overall: the weekly chart is in a bullish correction, not a reversal.
Daily timeframe (1D)
MACD is approaching the zero line, which rarely breaks below on gold during bullish cycles.
RSI near 50 – the typical lower boundary for bullish pullbacks.
CCI touched oversold once and looks ready for another retest.
Gold typically touches the 50EMA during corrections – which hasn’t happened yet.
Last daily candle closed above EMA20, but momentum is still weakening.
This strongly suggests a retest of the 3920–3950 zone (1D EMA50 area) before continuation.
4H timeframe
Price is currently fighting with the 20EMA and 50EMA.
The 200EMA was tested twice and held perfectly, supported by oversold conditions across:
RSI, CCI, MACD curl, and Stoch.
This signals quiet institutional buying on dips.
Final outlook
Most probable scenario:
Retest of 3920–3950 (1D EMA50 zone)
Trend remains strong on higher timeframes; lower timeframes are completing a healthy correction.
check the trend Given the support level broken, the downward trend will likely continue. Then, considering the price behavior in the next support level, possible scenarios have been identified.

XAUUSD -SetupPrice has confirmed a bearish breakout from the structure, and I’m expecting continuation toward the three downside targets. As long as price maintains bearish momentum and stays below the key levels, the setup remains valid.
Bias: Bearish
Invalidation: ❌ Setup becomes invalid if price closes above 4107.50.
Watching for sustained downside pressure and continuation toward the marked take-profit zones.

I will be going long on gold after the market opens.Are youreadyGold prices remained relatively stable this week, offering traders some room for maneuver. This week, after reaching a high of 4132, gold prices fluctuated between 4000 and 4110, showing greater stability compared to the previous volatile market. This provided favorable conditions for implementing trading strategies, and several short-selling operations during this period also achieved the expected results.
From a weekly chart perspective, the chart shows a doji pattern, indicating that the forces of bulls and bears are relatively balanced in the short term, lacking a clear one-sided trend, suggesting that investors are generally cautious. Historical data shows that Fridays are often prone to price fluctuations, so it is necessary to remain vigilant about risk management. Looking at the hourly chart, prices have entered a key support/resistance zone, currently trading near the Bollinger Band's middle line. If it can effectively hold this position, it is expected to retest the resistance levels of $4090 and $4100. In terms of trading strategy, it is recommended to place long orders in batches within the 4050 to 4070 range after the market opens, and closely monitor market dynamics. If there are any further changes, we will promptly notify you of any adjustments to the plan.
The above are my personal thoughts! If they are helpful to you or you agree with my ideas, please like and follow to support me! All strategies have a limited lifespan, so while referring to them, you should also closely monitor market changes. I will also respond flexibly according to actual market fluctuations, and I will announce the specifics in the channel!

Nov 21, 2025 - XAUUSD GOLD Analysis and Potential Opportunity Summary:
It’s Friday, and the market still hasn’t given a clear direction. For now, I’m using 4074 as the bull–bear line:
• Above 4074 → buy on pullbacks that hold
• Below 4074 → sell on pullbacks that fail
Stay flexible and let price action confirm the direction.
🔍 Key Levels to Watch:
• 4120 – Resistance
• 4107–4110 – Resistance
• 4100–4102 – Resistance
• 4096 – Resistance
• 4089 – Resistance
• 4082 – Resistance
• 4074 – Bull/Bear line
• 4067 – Support
• 4055 – Support
• 4020–4030 – Support zone
• 4007 – Support
• 3998–4000 – Psychological support zone
📈 Intraday Strategy:
• SELL if price breaks below 4074 → target 4067, then 4063, 4055, 4050
• BUY if price holds above 4081 → target 4088, then 4092, 4100, 4107

XAUUSD H1 TIME FRAME CHART ANALYSIS CONFIRMED TARGET SEE AND CHE📉 Chart Breakdown
1. Current Price
Around 4077.5
2. Sell Zone
Marked as “XAU/USD SELL Area” around the current price.
This suggests you’re planning to enter (or already entered) a sell trade near 4077–4080.
3. Stop Loss (Stop trade)
Highlighted red zone above.
SL appears to be around 4102.
4. Take-Profit Targets
Target 1: 4040
Target 2 (Next target): 4000
