Bearish Delivery Activated Between OG ZonesVANTAGE:XAUUSD price has rejected cleanly from the new
🐼Bearish OG Zone, and the OG TrendMaster just printed a 📉Short signal.
Buyers lost control, so my bias is to the downside, targeting the lower OG zone.
Short Bias:
• Entry: 4,078 – 4,090 (Bearish OG zone)
• Stop: Above 4,118
• TP1: 4,045
• TP2: 4,025
• Final Target: Lower OG Zone (around 4,000 – 3,990)
Fundamentals also line up with a bearish bias on gold. Today’s key U.S. releases NFP, Unemployment Rate, and Average Hourly Earnings can create strong volatility. If jobs and wages come in stronger than expected, the dollar typically strengthens and gold sells off. Even neutral numbers can keep pressure on gold as markets price in tighter monetary conditions. With heavy USD data on deck, the short setup aligns well with the macro narrative.
Trade ideas

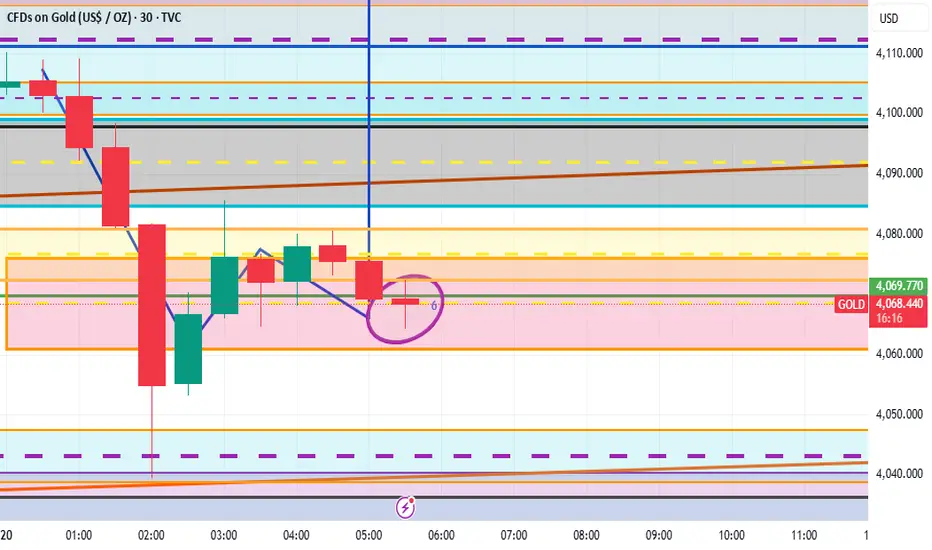
FIRST CONFIRMATION CANDLE If this current m30 candle in the purple sphere closes bullish then it will be first good confirmation of more buys so we will wait for other higher time frames for more confirmation but if it closes bearish by 6am it will be best to close buys and wait for a while because it will push down further but could be rejected to close around 4070 before we buy again , it could also lead to more sells if it closes bearish so it will be best to close and wait for the reaction after that .
Gold(XAUUSD)-Bullish Setup/RiskyChartPrice flipped bullish after CHoCH and BOS on the 15m/1H structure.
Market retraced into a clean demand zone and showed strong displacement back upward.
I'm expecting continuation toward PDH, with intraday targets at 4090 → 4108 → 4120.
As long as price holds above the 4060–4050 demand area, bullish bias remains valid.

Gold softens after Fed minutes as smokestacks cap every rally Is there any way we can get a December rate cut now?
Gold has softened after the release of the minutes from the Federal Reserve's last interest rate decision.
The minutes show there’s no unified push toward cutting, which could make a December move unlikely.
Several Federal Reserve officials supported lowering rates in October, but others preferred keeping policy unchanged, and some pushed back firmly against easing.
Technically, XAUUSD continues to form smokestacks, printing repeated double-top structures. The price is now hovering around 4,070, sitting under possible short-term resistance at 4,150. XAUUSD losing the 50-day MA further could shift bias more decisively lower.

Gold Technical Analysis and Trading Strategy (November 19th) MaGold Technical Analysis and Trading Strategy (November 19th)
Market Review: Yesterday, the gold market showed a bottoming-out and rebound trend. After testing the support level of 3998, the price stabilized and rebounded. In the evening, it broke through the key resistance level of 4030, officially turning into a bullish pattern. Subsequently, after a second pullback to the 4029 support level, it launched a strong rally, reaching a high of 4082. The daily chart ultimately closed with a small bullish candlestick with a relatively long lower shadow, ending the previous three-day losing streak. This candlestick pattern indicates that after a fierce battle between bulls and bears, the bulls have regained dominance.
Technical Analysis
From a daily chart perspective, although yesterday's positive close alleviated short-term downward pressure, the overall technical pattern still presents some concerns:
The short-term moving average system above still provides significant resistance, and the price has not yet achieved a substantial breakout.
After three consecutive days of negative closes, the rebound of this single positive candle is more likely a technical correction.
The price retraced again in the morning session, indicating that the bullish momentum still needs further confirmation.
Key Levels Analysis:
Support Area: Around 4050 (a support/resistance level), this level will be the watershed between bulls and bears today.
Resistance Area: 4100-4105 (the previous high of the negative candle), this is a significant short-term resistance zone.
Trading Strategy
Operational Approach: Primarily buy on dips, secondarily sell on rallies.
Specific Layout Long Position Strategy: Buy in batches in the 4050-4055 range, with a position size of 20% and a stop loss of 8 points. Target levels are 4080-4100, with a potential further upside to 4110 if the price breaks through.
Short Position Strategy: Sell in batches in the 4100-4105 range, with a position size of 20% and a stop loss of 8 points. Target levels are 4080-4060, with a potential further downside to the 4050 support level if the price breaks below.
Risk Warning: The impact of the Fed meeting minutes should be closely monitored today.
The non-farm payroll data will be released on Thursday and may have a significant impact on the market.
Strictly adhere to position management; the stop loss for each trade should not exceed 8% of the position size.
Specific entry points should be adjusted flexibly based on real-time market movements.
XAUUSD: Market Analysis and Strategy for November 19thGold Technical Analysis:
Daily Resistance: 4150, Support: 4000
4-Hour Resistance: 4150, Support: 4082
1-Hour Resistance: 4120, Support: 4098
Technically, the weekly candlestick chart shows a rebound, indicating confirmed support. Yesterday's daily chart closed with a hammer pattern after the rise, strengthening confidence in the technical rebound. Intraday, the effectiveness of the Bollinger Middle Band support needs to be monitored. The 4000 level has stabilized in the short term. News and data in the next few trading days will remain a key focus for the market. Now that 4100 has been broken, short-term traders can follow the trend. If the NY market experiences a slight pullback, it's also a good opportunity to buy, targeting the 4220/4250 area. We need to focus on the probability of a December rate cut; if it returns to above 60%, gold could accelerate its upward movement.
Looking at the 1-hour chart, gold rebounded strongly in the European session, with the price action within an upward channel. Having broken through 4100, the short-term trend suggests further continuation. Watch for support levels from the MACD/KDJ indicators. For the European and American sessions, consider buying on a pullback to around 4095/4082.
Trading Strategy:
BUY: 4095~4082
SELL: 4150~4158
More Analysis →

Continue to short gold in the $4075-$4095 range!Gold prices rebounded slightly after falling below the $4,000 mark, a move highly consistent with previous technical analysis expectations. As previously predicted, gold prices successfully reached the key target of $4,000 after a period of sustained downward volatility, indicating a significant release of bearish momentum. This pullback was accompanied by high market sensitivity to macroeconomic data, particularly following the unexpected rise in initial jobless claims. This heightened concerns about the future labor market prompted investors to reassess the Federal Reserve's monetary policy path, leading to a resurgence in safe-haven demand and driving a significant rebound in gold prices.
The data reflects signs of a possible marginal slowdown in the job market, causing some traders to reduce their bets on further interest rate hikes. This led to a decline in US Treasury yields and downward pressure on the US dollar index, thus providing short-term support for precious metals. As a result, gold prices quickly rebounded from their lows, recovering some lost ground and successfully reversing the previous continuous decline, returning to a range-bound trading pattern.
From a current technical perspective, although gold prices have rebounded, the overall trend has not yet completely escaped downward pressure. Bears remain dominant, with the medium- and long-term moving averages arranged in a bearish pattern, indicating a cautious market sentiment. In the short term, the $3990-$4000 range is a key support zone. This area not only represents a previous consolidation level but also represents a concentration of technical buying and stop-loss orders, providing strong support for the current phase. Resistance is concentrated in the $4100-$4090 range, a densely packed area of resistance that has been tested multiple times recently without success. Coupled with the possibility of some trapped positions selling off, gold prices are expected to face some selling pressure on any upward movement.
Given the current weak and volatile market, the trading strategy can continue the approach established at the beginning of the week. It is recommended to short gold in batches when the price rebounds to between $4075 and $4095. At the same time, close attention should be paid to important events such as US inflation data, the non-farm payroll report, and speeches by Federal Reserve officials, as these factors may exacerbate market volatility and alter the short-term trend. If there are significant changes in the fundamentals, such as higher-than-expected inflation or significantly weaker economic data, the strategy will be adjusted accordingly and timely updates will be provided.
Overall, the gold market is currently in a phase of intensified battle between bulls and bears, with the direction still unclear. In terms of trading, it is advisable to remain flexible, control positions, avoid chasing highs and lows, and focus on structural opportunities in a volatile market.
The above are my personal thoughts! If they are helpful to you or your ideas align with mine, please like and follow to show your support! All strategies have a limited lifespan, so while referring to them, you should also closely monitor market changes. I will also respond flexibly based on actual market fluctuations, and I will announce specifics in the channel!

XAUUSD potential Long term sell XAUUSD is currently testing a very strong zone , if it fails to break above we will see a very big dip coming our eyes should be on @ 4105 as long as its below this zone we could expect further dips

Long GOLD (GC, GLD, etc)I am planning to go to a long GOLD position again. Maybe needs some consolidation, but the eventual target will be 4800-5000 around mid-end 2026. I will choose otm GLD leap calls.
There is an alternative scenario that the price will drop to ~3850 first to form a wedge pattern. If so, I will double down on my leap calls.

Gold SellPrice broke above the previous highs and made a new Higher High, showing that buyers took control and flipped the structure bullish. After that push up, price pulled back into the same breakout area, which is now acting as demand. This is the level where I expect the uptrend to continue. As long as price holds above this zone, I’m staying bullish with targets back toward the recent HH. If price breaks below the current HL, the setup is invalid — that’s where my stop is.
Entry: 4,028.85
Stop Loss: 3,965.98
Take Profit: 4,253.68

GOLD long continuation after shifting the structureWe got a Gold continuation trade, we prioritizing longs over shorts as price shift the structure and it's showing bullish interest. The 4h structure is really good and aligns with the 15m Order-flow that we have. Remember to trust your BIAS and stick to your plan. It's normal to be wrong sometimes. For us, we still looking for longs on Gold. Trade now BE we holding to the top or until it hit BE.

GoldXAUUSD
- Bearish Channel as an corrective pattern in Short Time Frame
- Order Block
- Demand Zone
- Change of Characteristics
- Fibonacci Level - 23.60% / 38.20%

Gold’s Survival Zone: 4010–3998 Decides EverythingKey Levels for Today
Gold is trading at a decisive zone this morning:
4000–4004 → A clean break below this range opens the door toward 3945–3930.
Holding above 4000 → Keeps the bullish recovery scenario alive.
Break above 4055 → Signals strength returning, with upside targets at 4070 – 4085 – 4096 – 4111. Any sustained move above these levels indicates a potential continuation to higher zones.
Technical Overview
1H–3H timeframe:
Price is trading below all major moving averages (10/20/50/100/200) — a clear short-term bearish signal.
4H timeframe:
Gold is still receiving solid support near 4010.
Critical Zone (4010–3998):
This is a life-or-death area for gold today. Expect heavy “battle” here.
Failure to defend this zone will likely drive price directly toward 3945–3930.
Trade Levels & Scenarios
Bullish Scenario (Long):
Entry: Above 4026 (risk from 4017)
Targets:
4036–4039 → 4045 → 4055 → 4068 → 4079–4083 → 4090 → 4097 → 4107 → 4127 → 4132
Bearish Scenario (Short):
Entry: Below 3998 (risk from 4007)
Targets:
3991 → 3985 → 3977 → 3970 → 3958 → 3943 → 3930 → 3921 → 3901
Final Notes:
If you find this analysis helpful, your comment or share truly makes a difference.
Disclaimer
This analysis reflects a personal technical and fundamental view. It is not financial advice or a buy/sell recommendation.Trading financial markets involves significant risk; all decisions are the sole responsibility of the trader.
Wishing everyone a profitable day and a successful trading week.
#GoldRider

Key Gold Reversal Times for Daily Trading“Time-based analysis focuses on identifying the specific times when the market is likely to reverse or show strong movement. Instead of analyzing only price levels, it studies cycles, timing patterns, and repetitive market behaviors to predict when major or minor turning points may occur.”
XAUUSD on retracement At moment market is on implusive bullish strike.
-I’m still watching again retracement for a buy trade at 4100-4090 zone and my target remains 4145 then 4174 in extension.
-Secondly if H4-H1 candle closed above 4145 then market will test 4175-4185 without drop.
keep in mind If 4080 break below our setup gets invalid.
Unmute FOREXLAB for 24/7 updates

Gold Reaches 127.20 – Correction Expected"After gold reached the 127.20 Fibonacci extension, I expect a correction toward the highlighted zones on the chart. On the 1H timeframe, RSI has also reached overbought levels, supporting the correction scenario

Will gold prices rise in a one-sided manner?
I. Fundamental Analysis
The gold market is currently in a delicate balance, caught between two major forces: monetary policy expectations and a strong US dollar.
Core Driver: Rising Fed Rate Cut Expectations
Main Logic: Recent dovish signals from several Fed officials (such as Waller and Williams), pointing to significantly lower core inflation and signs of weakness in the labor market, have openly supported a rate cut in December. This caused market bets for a December cut to surge from 40% to 72%.
Market Impact: Rate cut expectations lower US Treasury real yields and weaken the dollar's appeal, providing the most crucial upward momentum for non-yielding gold. This is the core factor currently supporting prices.
Primary Pressure: Strong US Dollar
The US Dollar Index hovering near six-month highs makes dollar-priced gold more expensive for holders of other currencies, capping the upside for gold.
Uncertainty Factors:
Key Data Pending: US Retail Sales, PPI, and Initial Jobless Claims data due this week will be key to validating the Fed's potential rate cut logic. Any strong data could weaken rate cut expectations and weigh on gold.
Geopolitical Risks: Persistent conflicts in Ukraine and the Middle East provide safe-haven demand. Continued inflows into Gold ETFs offer underlying support, limiting significant downside.
Fundamental Summary: The market is weighing "upward momentum from rate cut expectations" against "pressure from a strong dollar and data uncertainty," leading to a lack of clear directional momentum in the short term and resulting in consolidation.
II. Technical Analysis
The technical picture clearly shows the current consolidation phase and provides key entry and risk management levels.
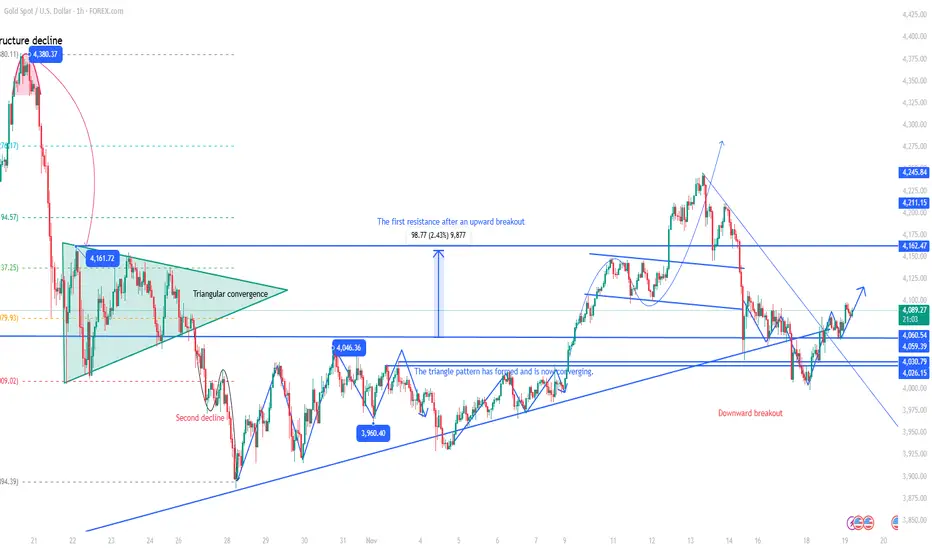
Daily Chart: Symmetrical Triangle Consolidation
Pattern: Lower highs and higher lows are forming a symmetrical triangle pattern, indicating a balance between bulls and bears and brewing a potential breakout.
Key Levels:
Core Support: $4030 (triangle lower trendline support).
Core Resistance: $4130-$4135 (triangle upper trendline and previous high resistance).
Indicator: The MACD shows a bearish crossover but with weakening momentum, indicating lackluster selling pressure and a market awaiting a new direction.
4-Hour / 1-Hour Charts: Range-Bound
Main Range: Price action is confined within a broad $4020 - $4130 range.
Short-Term Structure: The convergence and flattening of short-term moving averages and the MACD lines indicate a temporary market equilibrium, waiting for an external catalyst to break.
Technical Summary: Gold is consolidating within the $4020-$4130 range. Until this range is decisively broken, buying near support and selling near resistance is the primary strategy.
Comprehensive Trading Strategy
Core Idea: Range-bound trading, selling highs and buying lows. Look for long opportunities near the range support and short opportunities near the range resistance.
Key Resistance Zone: $4110 - $4130
Key Support Zone: $4020 - $4040
Specific Operational Plan:
Short Strategy (Sell on rally to resistance)
Ideal Entry Zone: $4120 - $4130
Stop Loss: Above $4140 (a decisive break above the range high)
Targets: First target $4070-$4060, second target $4050.
Long Strategy (Buy on dip to support)
Ideal Entry Zone: $4040 - $4050
Stop Loss: Below $4020 (a decisive break below the range low)
Targets: First target $4080-$4090, second target $4100.
Breakout Follow-up Strategy (Contingency Plan)
Upside Break Confirmation: If the price breaks and sustains above $4140, it signals a potential upward move. Consider following the breakout with long positions, targeting $4180-$4200.
Downside Break Confirmation: If the price decisively breaks below $4020, it indicates increased downside risk. Consider following the breakout with short positions, targeting $3980-$3950.
Risk Warnings and Trading Discipline
Monitor Data and Events: Closely watch the release of US economic data this week and any unexpected comments from Fed officials, as they can instantly shift market expectations and cause sharp volatility.
Strict Risk Management: Always use stop-losses and control the percentage of capital risked per trade. Avoid holding losing positions hoping for a reversal, especially in ranging markets.
Remain Flexible: If the price action shows hesitation or false breakouts near key levels, exit positions and wait for clearer signals.

Gold Rebounds: 4100 Test Fails, Awaits RetryGold is in a rebound trend, attempting to break through 4100. The first breakout attempt failed, with prices pulling back to around 4090—awaiting fresh bullish momentum for another breakout
Buy 4080 - 4085
TP 4100 - 4110 -4120
Accurate signals updated daily. They serve as a reliable guide for trading issues – feel free to refer to them. Hope they help!

XAUUSD On the 1-hour chart, Gold is currently trading inside a tight symmetrical triangle, with price compressing between a rising trendline from the November 5th lows and a descending trendline from the November 14th highs.
Price is hovering around the $4,070 zone, which also aligns with the 50-period moving average, showing indecision but increasing pressure for a breakout.
A break and retest above the $4,085–4,095 resistance zone (highlighted in grey) may trigger a bullish momentum wave. The projected breakout target points toward the $4,180–4,220 region, based on the measured move from the previous swing.
As long as price holds above the rising trendline support, the structure remains bullish, with buyers expected to step in on any retest of support.

Still Good Long R:R's (Gold)Setup
Bullish trend / Correction
Gold still above 50 day moving average
Daily RSI stable around 50 level
Has made a 50% correction of rally since breakout at 3400
Commentary
It seems likely gold needs to first complete an ABCD correction before moving higher - meaning one more lower low. However, support at 3920 could hold, offering good R:R opportunities - even if 4200 holds as resistance.
Strategy
Look for bullish reversals below 4000, above 3920 support
Wait for bigger pullback to the 61.8% Fib / demand zone under 3800

Will gold break the 3-decade wedge — or will repeat historyWill gold break the 3-decade wedge to 5K — or will repeat history with a deep correction?
* Gold is now testing a decades-long ascending wedge resistance, a structure that has held since the late 1980s.
- The current rally has pushed prices into a confluence of resistances — the upper wedge boundary and the upper Bollinger Band — historically a zone where major tops have formed.
Momentum indicators support this caution:
- RSI is in extreme overbought territory, trending above its long-term rising trendline.
- ADX and DI+ are reversing from elevated levels, a pattern seen during previous long-term tops in 2011 and 1987, both of which triggered multi-year declines.
* Historically, gold has corrected 30–50% after touching similar long-term resistance zones.
* If the wedge holds again, a corrective move toward $3,000 cannot be ruled out.
However, shorter timeframes continue to show strength toward the psychological level of $5,000, suggesting this rally still has momentum.
The real question is:
* Will gold break the 3-decade wedge for the first time — or repeat history with a deep correction?
* Time will tell… likely around 2029, when price meets the next major trendline test.

XAUUSD SHORT UPDATEGold has since been respecting the points and areas that l have marked out, still expecting it to sell as shown on my charts
DISCLAIMER: This is not investment advice and purely for educational purposes
WHAT ARE YOUR THOUGHTS ?

Gold at a Critical Juncture - A Bearish Correction Warning
The XAUUSD chart is currently exhibiting a potential bearish reversal pattern, identified as a Head and Shoulders top. The key levels for this pattern are as follows:
· Head (Pattern High): $4377
· Neckline: $3890
· Current Price Action: Trading around $4044, approaching the neckline from above.
A confirmed break and daily close below the $3890** neckline support would validate this pattern and open the path for a deeper correction towards the key support zone around **$3600.
Important Context:
It is crucial to note that the long-term trend on higher timeframes remains structurally bullish. The potential breakdown discussed here is primarily a warning for a deepening corrective phase on the Daily and 4-Hour charts, not necessarily a reversal of the primary long-term uptrend.
Summary:
· Scenario: Bearish correction within a broader bull trend.
· Trigger: Daily close below $3890.
· Target: $3600 (Key Support Zone).
· Invalidation: A move back above the $4377 head high.
OANDA:XAUUSD
