GOLD 1H CHART ROUTE MAP UPDATE & TRADING PLAN FOR THE WEEKHey Everyone,
Please see our updated 1h chart levels and targets for the coming week.
We are seeing price play between two weighted levels with a gap above at 4100 and a gap below at 4057. We will need to see ema5 cross and lock on either weighted level to determine the next range.
We will see levels tested side by side until one of the weighted levels break and lock to confirm direction for the next range.
We will keep the above in mind when taking buys from dips. Our updated levels and weighted levels will allow us to track the movement down and then catch bounces up.
We will continue to buy dips using our support levels taking 20 to 40 pips. As stated before each of our level structures give 20 to 40 pip bounces, which is enough for a nice entry and exit. If you back test the levels we shared every week for the past 24 months, you can see how effectively they were used to trade with or against short/mid term swings and trends.
The swing range give bigger bounces then our weighted levels that's the difference between weighted levels and swing ranges.
BULLISH TARGET
4100
EMA5 CROSS AND LOCK ABOVE 4100 WILL OPEN THE FOLLOWING BULLISH TARGETS
4140
EMA5 CROSS AND LOCK ABOVE 4140 WILL OPEN THE FOLLOWING BULLISH TARGET
4193
EMA5 CROSS AND LOCK ABOVE 4193 WILL OPEN THE FOLLOWING BULLISH TARGET
4233
EMA5 CROSS AND LOCK ABOVE 4233 WILL OPEN THE FOLLOWING BULLISH TARGET
4275
BEARISH TARGETS
4057
EMA5 CROSS AND LOCK BELOW 4057 WILL OPEN THE FOLLOWING BEARISH TARGET
4016
EMA5 CROSS AND LOCK BELOW 4016 WILL OPEN THE FOLLOWING BEARISH TARGET
3965
EMA5 CROSS AND LOCK BELOW 3965 WILL OPEN THE SWING RANGE
3923
3861
As always, we will keep you all updated with regular updates throughout the week and how we manage the active ideas and setups. Thank you all for your likes, comments and follows, we really appreciate it!
Mr Gold
GoldViewFX
Trade ideas

Gold 30-Min — Volume Sell Reversal Triggered⚡Base : Hanzo Trading Alpha Algorithm
The algorithm calculates volatility displacement vs liquidity recovery, identifying where probability meets imbalance.
It trades only where precision, volume, and manipulation intersect —only logic.
✈️ Technical Reasons
/ Direction — SHORT / Reversal 4090 Area
☄️Bearish rejection confirmed through sharp candle body.
☄️Lower-high forming beneath resistance supply region.
☄️Volume decreasing confirms exhaustion in price rally.
☄️Sellers regained imbalance with heavy top rejection.
☄️Algorithm detects fading demand and shift to control.
⚙️ Hanzo Alpha Trading Protocol
The Alpha Candle defines the day’s real control zone — the first battle of momentum.
From this origin, the Volume Window reveals where the next precision strike begins.
⚙️ Hanzo Volume Window / Map
Window tracked from 10:30 — mapping true market behavior.
POC alignment exposes institutional bias and breakout potential zones.
⚙️ Hanzo Delta Window / Pulse
Delta window monitors real buying vs. selling power behind each move.
Tracks volume aggression to expose who controls the candle — buyers or sellers.
When Delta aligns with Volume Map, momentum becomes undeniable.

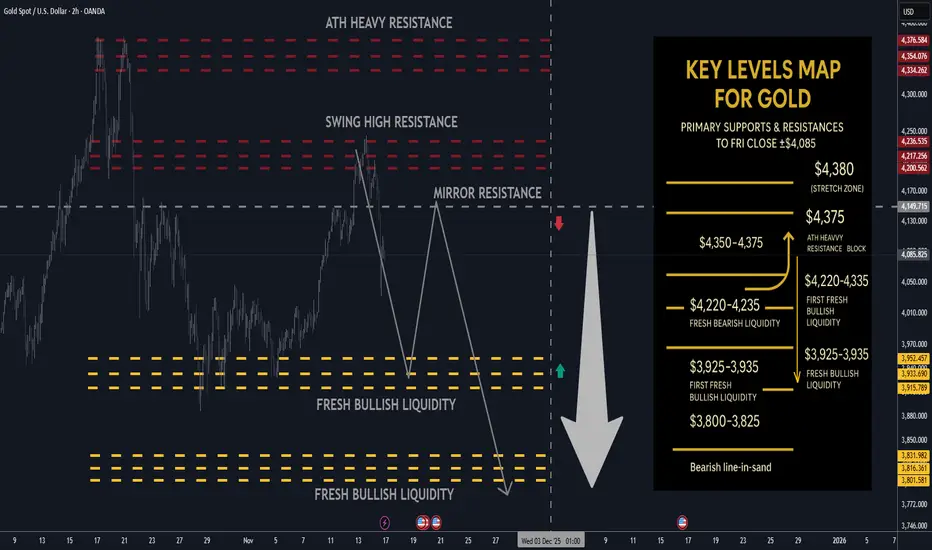
Gold next week: Key S/R Levels and Outlook for Traders🔥 GOLD WEEKLY SNAPSHOT — BY PROJECTSYNDICATE
🏆 High/Close: ~$4,244 → ~$4,085 — buyers punched through $4.20k but sellers defended the $4,220–4,250 band; weekly close is soft but still comfortably above $4k and mid-range.
📈 Trend: Bullish but in corrective / two-way mode ; treating current tape as range-trade while below the $4,350–4,375 ATH supply block.
🛡 Supports: $3,925–3,935 fresh bullish liquidity → $3,800–3,825 deeper demand pocket— key shelves where dip-buying is expected.
🚧 Resistances: $4,220–4,230 short-term fade zone → $4,350–4,375 (ATH heavy resistance block).
🧭 Bias next week: Preference to fade strength into $4,220–4,230, targeting a rotation back into $3,925–3,935. Alternative is to buy dips into $3,925–3,935 and ride the range back toward $4,220–4,230. Invalidation on sustained acceptance above $4,350–4,375; loss of $3,800–3,825 risks deeper mean reversion.
________________________________________
________________________________________
🔝 Key Resistance Zones
• $4,220–4,230 — immediate weekly ceiling; aligns with your noted resistance block, attractive area to initiate shorts on first tests.
• $4,350–4,375 — prior ATH / “heavy resistance block”; any spike here is a fade candidate unless price accepts above it on strong volume.
🛡 Support Zones
• $3,925–3,935 — fresh bullish liquidity; preferred first take-profit for shorts and primary dip-buy zone.
• $3,800–3,825 — deeper fresh liquidity; failure here would signal a more meaningful correction, not just a pullback in an uptrend.
________________________________________
⚖️ Base Case Scenario
Range/consolidation between roughly $3,800–$4,230:
• First pushes into $4,220–4,230 are sellable for rotations toward $3,925–3,935.
• As long as weekly closes keep rejecting the ATH block $4,350–4,375, bias stays “sell strength, buy clean liquidity dips.”
🚀 Breakout / Breakdown Triggers
• Bull trigger: Sustained acceptance above $4,350–4,375 multiple sessions holding above and using that band as support would shift tone back to full-on trend and reopen the path toward and beyond prior extremes (~$4,400+).
• Bear trigger: A decisive daily close below $3,800 turns the current “healthy pullback” into a deeper correction, opening room toward prior lower shelves sub-$3,750 and likely volatility expansion.
________________________________________
💡 Market Drivers to Watch
• Fed & real yields: Odds of a December cut have ramped up again; any hawkish pushback or hotter data could cap rallies near resistance.
• U.S. fiscal/political risk: Shutdown and fiscal brinkmanship are still in the background; resolution headlines could briefly pressure gold, while renewed instability supports the bid.
• Flows & positioning: ETF and central-bank demand remain supportive, but after a 60% YTD run, fast money is quick to take profits into strength.
• Cross-asset behavior: Watch that equity–gold correlation; if risk-off hits and gold still sells with stocks, dips could run further before strategic buyers step in.
________________________________________
🔓 Bull / Bear Trigger Lines
• Bullish above: $4,350–$4,375 (sustained acceptance; ATH block reclaimed as support).
• Bearish below: $3,800 (opens risk of deeper liquidation below the current liquidity shelves).
________________________________________
🧭 Strategy for this week
Primary plan – short from resistance (your core idea):
• Entry zone: Scale into shorts around $4,220–4,230 front edge of the resistance block.
• TP #1: $3,925–3,935 fresh bullish liquidity; consider closing most size here.
• Runner / extension: If momentum extends lower, watch $3,800–3,825 for final profit-taking; below here the profile shifts into deeper correction mode.
• Risk: Hard invalidation if price accepts above $4,350–4,375 daily closes holding above and successful retests.
Alternative plan – buy the dip into liquidity:
• Entry zone: Stagger bids around $3,925–3,935 and, for more aggressive positioning, into $3,800–3,825.
• Exit zone: First target back into $4,220–4,230; consider de-risking heavily as you approach that resistance band.
• Risk: Cut or reduce if price fails to hold above $3,800 on a daily closing basis or if selling accelerates on high volume through that shelf.
THE KOG REPORT - UpdateEnd of day update from us here at KOG:
Not a bad day at all on the markets with our plan working well getting the long from defence into the red box defence, completing our red box targets upside before the rejection and the opportunity to short it back into where we are now.
Now, we have support at the 4065 level and resistance at the 4095 region which is where we have place the arrows. We'll have to wait for a reaction at either level, however, we have a tiny gap downside which price may come back for and give us another undercut low over the Asian session. Due to it being an extremely successful week so far, we'll wait for the market to close and then have a look with a fresh mind tomorrow.
As always, trade safe.
KOG

Lingrid | GOLD Complex Correction Short SetupOANDA:XAUUSD is testing the 4,150 resistance zone, where price might form a potential fake break. The move stalled right at confluence between the red long-term resistance trendline and the ceiling of the range, signaling possible buyer exhaustion. Price is now slipping back beneath the broken breakout level, suggesting that momentum is shifting back in favor of sellers as intraday structure loses strength.
If bearish pressure continues, TVC:GOLD is positioned to rotate toward 4,095, with the broader correction where the next liquidity cluster sits. As long as price remains capped under 4,160, the downside scenario remains dominant, especially with markets awaiting key USD-driven macro catalysts (PPI) that could strengthen the dollar and weigh further on gold.
➡️ Primary scenario: rejection holds → drop toward 4,095.
⚠️ Risk scenario: a clean breakout above channel flips momentum and opens room toward higher levels.
If this idea resonates with you or you have your own opinion, traders, hit the comments. I’m excited to read your thoughts!

Buyers Are Back: Is Gold Ready to Break Higher?Gold is entering a promising recovery phase as macro signals are finally shifting in favor of the bulls. After three consecutive losing sessions, the market received a meaningful boost from weaker-than-expected U.S. labor data — opening up a much clearer upside opportunity for XAUUSD.
The number of Americans receiving unemployment benefits has climbed to a two-month high , with continued claims rising to 1.9 million in the week ending October 18. These figures are fueling expectations that the Fed may cut interest rates in December 2025, weakening the USD and lending strong support to the precious metal.
On the 2H chart, price is rebounding from the 4,060 support area and showing a clear return of buying momentum . XAUUSD will likely continue consolidating within the highlighted zone before targeting the 4,150 level. The rounded bottom formation underneath is also reinforcing the bullish scenario .
Overall, the most reasonable strategy is to favor buying on pullbacks toward 4,080–4,100, aiming for 4,150. A break below 4,060 would invalidate the short-term bullish outlook .

Gold Consolidation Scenario – Market & Technical OutlookGold prices slipped on Thursday, pressured by a stronger U.S. dollar and reduced expectations for a Federal Reserve rate cut in December. Markets are also cautious ahead of the delayed U.S. jobs report, adding uncertainty to near-term movements.
Fundamentally, gold is down primarily because rate-cut bets have been significantly scaled back over the past two weeks, reducing demand for non-yielding assets.
Technical Outlook
Gold is currently displaying a bearish structure, but the chart suggests a potential reversal area If bulls defend the 4060 zone, there is a chance for the price to resume upward momentum If the price fails to break above 4060 and continues showing weakness, further decline is likely.
Key Levels
Resistance Level: 4095 – 4132
Support Level: 4032 – 4000
You may find more details in the chart,
Trade wisely best of Luck Buddies.
Ps; Support with like and comments for better analysis Thanks for Supporting.

GOLD (XAU/USD): Breakout & Important Selling ZoneThe price of 📈Gold has fallen below a significant horizontal support level.
The previously violated structure and a descending trend line now form a notable supply zone.
I will consider initiating selling positions from this area, anticipating a downward movement towards the 4000-support level.

GOLD: Improved Volume Signals Potential Upside for GoldGOLD: Improved Volume Signals Potential Upside for Gold
Yesterday the volume was very low and failed to start the uptrend. Perhaps it was also in this situation because of the NFP data that came out better than expected and the US dollar showed strength again.
Gold found strong support in our old area near 4030 from where it recovered again. Currently gold reached 4078 and chances are it will rise further.
Today's volume seems to be better compared to all other days combined. The fundamental analysis did not change during all these days.
Targets remain the same:
4150
4230
With extension levels at 4290 and 4360 if momentum accelerates
You may find more details in the chart!
Thank you and Good Luck!
❤️PS: Please support with a like or comment if you find this analysis useful for your trading day❤️
XAUUSD (Gold Bearish Analysis Expected📉 XAUUSD Technical Overview
Price is moving inside a rising trendline structure, but the recent rejection from the upper zone shows weakening bullish momentum. The market has created a lower high and is now pulling back toward the trendline support.
If price breaks below this rising structure, bearish momentum may extend toward the marked Target Levels, where previous liquidity and support areas are aligned.
Structure:
• Lower high formed
• Rising trendline acting as temporary support
• Breakdown could push price toward the downside targets
Market is waiting for a clear breakout to confirm the next direction.
please kindly support with Booost and comments

XAUUSD 4H – Liquidity Map & Smart Money Outlook🌐 MARKET CONTEXT
Gold continues to trade within a bearish intraday structure, forming consistent Lower Highs → Lower Lows on the M30 timeframe. Price has been reacting strongly at Premium areas where Buy-Side Liquidity (BSL) accumulates, while showing clean rebounds at deeper Discount levels where Sell-Side Liquidity (SSL) resides.
Current Market Sentiment
USD remains steady → maintaining downward pressure on gold
Smart Money prioritizes selling at Premium and accumulating at Discount
Midweek environment → prone to liquidity sweeps before true expansion
Bias for the day:
🔻 Bearish bias, favor SELL setups at Premium zones
🔺 BUY only at deep Discount with CHoCH confirmation
📉 TECHNICAL ANALYSIS (SMC + LIQUIDITY STRUCTURE)
Market Structure
M30 trend: Bearish
Mid-range equilibrium: 4110–4175
Premium liquidity zone: 4378–4380
Deep discount zone: 3882–3884
Imbalances & Liquidity
Major bearish FVG: 4378–4380
Mid-level liquidity pocket: 4238–4240
Strong SSL levels: 3996 and 3882
🔑 KEY PRICE ZONES (Clear & Compelling Explanations)
1️⃣ 4380–4378 → Premium Liquidity Trap – MAIN SELL ZONE
This zone contains:
Buy-Side Liquidity from previous breakout attempts
An unmitigated M30 Supply Zone
A major FVG expecting full mitigation
➡️ Smart Money often drives price into this premium pocket to hunt liquidity before reversing sharply.
2️⃣ 4240–4238 → Mid-Range Liquidity Sweep – SCALP SELL ZONE
A highly reactive intraday level:
Holds clustered stoplosses from intraday traders
Sits near equilibrium → ideal area for engineered fakeouts
Often creates sharp wicks before reversing
➡️ Perfect for quick SELL scalps with minimal drawdown.
3️⃣ 3998–3996 → First Discount Reaction – SCALP BUY ZONE
This zone includes:
A clean SSL cluster just below
A sensitive micro Demand Zone
A common CHoCH reaction area on M30
➡️ Great for fast BUY scalps with tight risk.
4️⃣ 3884–3882 → Deep Discount Reversal Base – MAJOR BUY ZONE
This zone is extremely important:
Sits at the structural low on M30
Contains heavy Sell-Side Liquidity
Aligns with a higher-timeframe Order Block
➡️ If price taps here → strong reversal potential, possibly forming the weekly low.
⚙️ TRADE SETUPS (Detailed Execution Plan)
✔️ SELL GOLD – Main Position
Entry: 4380–4378
Stoploss: 4386
TP1: 4355
TP2: 4300
TP3: 4240
Logic: BSL sweep → FVG fill → strong bearish rejection expected.
✔️ SELL SCALP – Intraday Liquidity Sweep
Entry: 4240–4238
Stoploss: 4246
TP1: 4215
TP2: 4190
TP3: 4155
Logic: Sweep of mid-range liquidity → immediate downward displacement.
✔️ BUY SCALP – Discount Reaction
Entry: 3998–3996
Stoploss: 3990
TP1: 4015
TP2: 4045
Logic: SSL sweep → quick intraday rebound.
✔️ BUY GOLD – Deep Discount Reversal
Entry: 3884–3882
Stoploss: 3876
TP1: 3910
TP2: 3950
TP3: 3995
Logic: Major discount zone → high-probability reversal area.
🧠 SESSION NOTES
Avoid trading in the middle of the range
Wait for M5/M15 confirmation (CHoCH + displacement)
Do not buy at Premium zones
Do not sell at deep Discount zones
Let liquidity sweep first → then enter
🏁 CONCLUSION
Gold maintains a bearish intraday structure, favoring SELL setups at 4378–4380 and 4238–4240.
BUY opportunities appear only at strong Discount zones 3996 and 3882, where liquidity pools support bullish reactions.
Trade like Smart Money: wait for liquidity → strike with precision.

GOLD DAILY CHART ROUTE MAPHey everyone,
Please see our updated Daily chart route map with updated levels.
Price is currently playing between the longer daily chart range 4128 and 3980, with the channel half-line acting as support.
If this support holds, we should see a move toward the 4128 target. A body close or ema5 cross and lock below the half-line would open the swing range for a test and bounce. We're also watching for a break above 41238 to confirm a continuation above.
This is the beauty of our Goldturn channels, which we draw in our unique way, using averages rather than price. This enables us to identify fake-outs and breakouts clearly, as minimal noise in the way our channels are drawn.
We will use our smaller timeframe analysis on the 1H and 4H chart to buy dips from the weighted Goldturns for 30 to 40 pips clean. Ranging markets are perfectly suited for this type of trading, instead of trying to hold longer positions and getting chopped up in the swings up and down in the range.
We will keep the above in mind when taking buys from dips. Our updated levels and weighted levels will allow us to track the movement down and then catch bounces up using our smaller timeframe ideas.
Our long term bias is Bullish and therefore we look forward to drops from rejections, which allows us to continue to use our smaller timeframes to buy dips using our levels and setups.
Buying dips allows us to safely manage any swings rather then chasing the bull from the top.
Thank you all for your likes, comments and follows, we really appreciate it!
Mr Gold
GoldViewFX
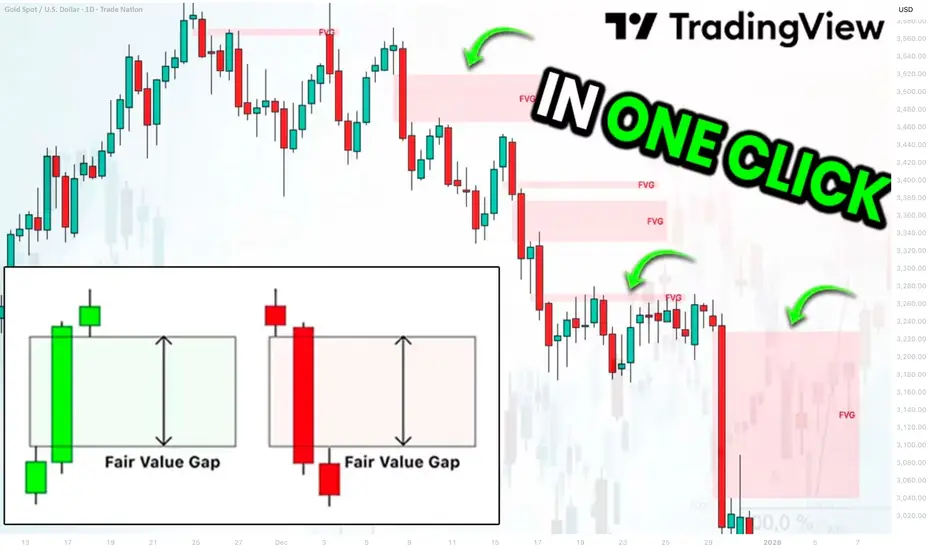
Best Free Fair Value Gap FVG Technical Indicator on TradingView
This free indicator accurately identifies Fair Value Gaps FVG on any market.
It is available on TradingView and it is very easy to set it up.
In this article, I will show you how to use this indicator and how to find a fair value gap easy in one click.
Let's start with my definition of a fair value gap because it is different from trader to trader.
FVG is a sudden, sharp price move that happens so fast that it leaves behind a price zone where very little trading actually occurred.
Because this zone saw almost no trading, it creates an imbalance .
Such a move is usually created by a large candle.
A candle with a big body and almost no wicks.
Among classic Japanese candlesticks, there is one such a candle.
It is called Marubozu.
Here are bullish and bearish structures of that candle.
A green one represents extremely strong bullish momentum. The price opened at the low of the period and closed at the high of the period. There were no pullbacks ; buyers were in complete control from the opening bell to the close.
Its bearish variation has the same logic.
The price opened at the high of the period and closed at the low of the period, with a very little trading activity within.
Our technical indicator will look for such a candle.
The indicator that we will use is called "All Candlestick Patterns".
In the settings of this indicator, we should select Marubozu White (bullish candle) and Marubozu Black (bearish candle).
After we click "OK", the indicator will immediately start working.
The indicator will show valid and significant Fair Value Gaps FVG on any time frame and any trading instrument.
Like any other indicator, it will miss some Fair Value Gaps, but while you are learning to identify them, it will help you to spot the most important ones.
❤️Please, support my work with like, thank you!❤️
I am part of Trade Nation's Influencer program and receive a monthly fee for using their TradingView charts in my analysis.
Gold 30-Min — Volume Sell Reversal Triggered⚡Base : Hanzo Trading Alpha Algorithm
The algorithm calculates volatility displacement vs liquidity recovery, identifying where probability meets imbalance.
It trades only where precision, volume, and manipulation intersect —only logic.
✈️ Technical Reasons
/ Direction — SHORT / Reversal 4045 Area
☄️Bearish rejection confirmed through sharp candle body.
☄️Lower-high forming beneath resistance supply region.
☄️Volume decreasing confirms exhaustion in price rally.
☄️Sellers regained imbalance with heavy top rejection.
☄️Algorithm detects fading demand and shift to control.
⚙️ Hanzo Alpha Trading Protocol
The Alpha Candle defines the day’s real control zone — the first battle of momentum.
From this origin, the Volume Window reveals where the next precision strike begins.
⚙️ Hanzo Volume Window / Map
Window tracked from 10:30 — mapping true market behavior.
POC alignment exposes institutional bias and breakout potential zones.
⚙️ Hanzo Delta Window / Pulse
Delta window monitors real buying vs. selling power behind each move.
Tracks volume aggression to expose who controls the candle — buyers or sellers.
When Delta aligns with Volume Map, momentum becomes undeniable.

Gold Resistance Rejection: Is the Next Leg Down Starting?Gold ( OANDA:XAUUSD ) has touched its upside targets as I expected in my previous idea .
Gold is currently trading near the Resistance zone($4,192 – $4,133) .
In terms of Elliott Wave theory, it appears that Gold is completing a Double Three Correction(WXY) .
I expect Gold to drop to at least $4,049 after breaking the Support lines .
First Target: $4,049
Second Target: $4,009
Stop Loss(SL): $4,192
Points may shift as the market evolves
Please respect each other's ideas and express them politely if you agree or disagree.
Gold Analyze (XAUUSD), 1-hour time frame.
Be sure to follow the updated ideas.
Do not forget to put a Stop loss for your positions (For every position you want to open).
Please follow your strategy; this is just my idea, and I will gladly see your ideas in this post.
Please do not forget the ✅ ' like ' ✅ button 🙏😊 & Share it with your friends; thanks, and Trade safe.

GOLD 4H CHART ROUTE MAP UPDATE & TRADING PLAN FOR THE WEEKHey Everyone,
Please see our updated 4h chart levels and targets for the coming week.
We are seeing price play between two weighted levels with a gap above at 4124 and a gap below at 4042. We will need to see ema5 cross and lock on either weighted level to determine the next range.
We will see levels tested side by side until one of the weighted levels break and lock to confirm direction for the next range.
We will keep the above in mind when taking buys from dips. Our updated levels and weighted levels will allow us to track the movement down and then catch bounces up.
We will continue to buy dips using our support levels taking 20 to 40 pips. As stated before each of our level structures give 20 to 40 pip bounces, which is enough for a nice entry and exit. If you back test the levels we shared every week for the past 24 months, you can see how effectively they were used to trade with or against short/mid term swings and trends.
The swing range give bigger bounces then our weighted levels that's the difference between weighted levels and swing ranges.
BULLISH TARGET
4124
EMA5 CROSS AND LOCK ABOVE 4124 WILL OPEN THE FOLLOWING BULLISH TARGETS
4212
EMA5 CROSS AND LOCK ABOVE 4212 WILL OPEN THE FOLLOWING BULLISH TARGET
4328
EMA5 CROSS AND LOCK ABOVE 4328 WILL OPEN THE FOLLOWING BULLISH TARGET
4422
EMA5 CROSS AND LOCK ABOVE 4422 WILL OPEN THE FOLLOWING BULLISH TARGET
4422
EMA5 CROSS AND LOCK ABOVE 4422 WILL OPEN THE FOLLOWING BULLISH TARGET
4494
BEARISH TARGETS
4042
EMA5 CROSS AND LOCK BELOW 4042WILL OPEN THE FOLLOWING BEARISH TARGET
3964
EMA5 CROSS AND LOCK BELOW 3964 WILL OPEN THE FOLLOWING BEARISH TARGET
3873
EMA5 CROSS AND LOCK BELOW 3873 WILL OPEN THE SWING RANGE
3767
3646
As always, we will keep you all updated with regular updates throughout the week and how we manage the active ideas and setups. Thank you all for your likes, comments and follows, we really appreciate it!
Mr Gold
GoldViewFX

Gold Pauses as Sellers Signal a Potential Downward Move AheadHello everyone,
Gold has just gone through a rather “heavy” session after being strongly rejected at the 4,090–4,100 USD area — a region where sellers seem ready to step in the moment price attempts to move higher. At the moment, gold has pulled back to around 4,065 USD, and the repeated appearance of small-bodied candles with long upper wicks looks like a reminder that the market is becoming tired after the previous bullish move.
External conditions are adding more pressure as well: the USD has strengthened sharply following US economic data that beat expectations, the 10-year Treasury yield remains above 4%, and equity markets continue to rally thanks to Big Tech. With capital flowing out of safe-haven assets, gold simply lacks the “immediate reason” to bounce strongly right now.
With everything that’s unfolding, I’m leaning towards a clear scenario: gold is likely to slide down toward the 4,040–4,030 USD zone to test liquidity. If this area fails to hold, a drop toward 4,000 USD becomes a very real possibility — and that’s where the market may decide whether buyers still have enough strength to return.
What about you — do you think gold can defend 4,040 and rebound, or will it need to fall all the way to 4,000 before any recovery can happen?

GOLD(xauusd): Structure Breaks Suggest Deeper Correction AheadHi!
Gold has shown clear signs of weakening after failing to sustain its push toward the recent highs. The market engulfed the last major low before the top, signaling a structural shift, and has already broken below the secondary ascending trendline. This confirms that bullish momentum is fading.
Price is currently retesting the first demand zone, but if buyers fail to hold this level, the chart suggests a potential continuation to the downside. The key level to watch is the horizontal support around $4,000. A clean break below this zone would likely open the door for a deeper move toward the major demand area highlighted around $3,560 – $3,520.
As long as Gold remains below the broken structure and fails to reclaim the upper zone, the broader bias leans bearish, with lower highs forming and liquidity sitting below.
Disclaimer: As part of ThinkMarkets’ Influencer Program, I am sponsored to share and publish their charts in my analysis.

XAUUSD - Bulls Still Stepping In at Demand… Watching the Retest!Gold remains overall bullish, holding firmly above the major support zone around $4,000–$4,050. This entire red area has been acting as a strong demand zone for weeks, with price bouncing from it multiple times, a clear sign that buyers are defending this level aggressively.
📈XAUUSD is also respecting the rising trendline , forming a clean higher-low structure. As long as Gold remains above both the trendline and the support zone, the bullish outlook stays intact. I will be looking for long setups on the next retest of this confluence area.
🏹If buyers step in again, the next move could push toward the previous highs near $4,385. But if price breaks below the support zone and the trendline, the bullish structure would weaken and open the door for a deeper correction.
For now, this zone is the key. Will Gold bounce again… or finally break through support? 🤔
⚠️ Disclaimer: This is not financial advice. Always do your own research and manage risk properly.
📚 Stick to your trading plan regarding entries, risk, and management.
Good luck! 🍀
All Strategies Are Good; If Managed Properly!
~Richard Nasr

XAUUSD Bullish Setup Toward 4100XAUUSD is showing a bullish setup after sweeping liquidity and rejecting strongly from the order block zone. Price is pushing upward toward the 4100 target, supported by previous range breakout, FVG imbalance, and clear resistance levels above. The chart signals continuation to the upside.

THE KOG REPORT - UpdateEnd of day update from us here at KOG:
After a very clean week so far, today wasn't really worth getting involved in. A lot of choppy price action and accumulation, no clear direction even though our hot spots were all hit.
We have a lower high which is concerning but there is a strong level of support here at the 4050-55 level. Tomorrow's key level of resistance stands at 4075 which needs to break, as well as the red box defence in which the price has played for most of this week. It looks like the breakout will come in the sessions ahead. For that reason, we'll wait for the break either side otherwise we'll just call it a successful week here.
Levels to watch, 4040 support on the undercut low, while 4070-75 for the spikes needs force to break open.
As always, trade safe.
KOG

Understanding Forex Money Flow: Risk-on & Risk-offWhen it comes to Forex, most traders focus on technicals, chart patterns, or indicators. But “money flow” — the force that truly moves price — is often overlooked. If you want to read the market like a pro, you must understand Risk-on and Risk-off: the two sentiment states that drive global capital.
Today, let’s break them down clearly, practically, and in a way you can apply immediately.
🔥 What Is Risk-on?
“Risk-on” appears when the market is optimistic, investors seek risk, and money flows strongly into high-return assets.
Signals of a Risk-on Environment:
Strong stock market rallies
Capital shifts into riskier assets
Bond yields rise
Positive economic news or geopolitical easing
Assets That Benefit in Forex:
AUD, NZD, CAD (commodity currencies)
GBP, EUR (when the economy is stable)
Bitcoin, oil, and equities also tend to rise
Risk-on = “The market is excited → money flows into high-yield assets”.
💥 What Is Risk-off?
“Risk-off” occurs when the market fears uncertainty, causing money to move toward safe-haven assets.
Signals of a Risk-off Environment:
Stock markets fall sharply
Money exits risky assets
Gold spikes
USD and JPY strengthen
Negative economic news, war, inflation, or political instability
Assets That Benefit in Forex:
USD, JPY, CHF
Gold (XAUUSD)
U.S. government bonds
Risk-off = “The market is scared → money runs to safety”.
❓ Why Forex Traders MUST Understand Risk-on / Risk-off
No matter what indicator you use, the market ultimately reacts to major capital flow.
Understanding these two states helps you:
Trade with market sentiment → dramatically increases win rate
Avoid entering trades against the money flow → fewer “pointless stop-loss hits”
Identify strong/weak currencies → choose high-probability setups
Many perfect technical setups fail simply because they go against global money flow.
📌 How to Apply This Immediately in Your Forex Trading
1. Check the News → Identify Sentiment
Good news? Strong GDP? Stable markets? → Risk-on
Bad news? War? Inflation? Hawkish Fed? → Risk-off
2. Compare Currency Strength
Simple formula:
Risk-on → prioritize BUY AUD, NZD, CAD
Risk-off → prioritize BUY USD, JPY, CHF
3. Follow the Trend — Avoid Fighting Money Flow
The strongest trends often come from shifts between Risk-on and Risk-off.
Examples:
Bad news → JPY strengthens → XXXJPY pairs fall hard
Risk-on returns → USD weakens → gold rises quickly
Follow the money flow, and you’re already ahead of 80% of traders.
🧠 Conclusion – If You Want to Trade Smart, Trade With the Money Flow
Risk-on and Risk-off aren’t just theory — they’re the compass that reveals market psychology, which is the foundation of every trend.
Want to trade like Smart Money?
→ Watch where the money is moving, not just where the candles are going.

XAUUSD Daily AnalysisBased on ichimoku's data XAUUSD long-term trend is still bulish.
Xauusd is in the short-term downward trend.
if it cannot break through the support level (3962) with ichimoku elements, it will change its direction to resistence levels, but if it can, it will continue to highlighted support levels which are very important for gold and you can consider it as long-term support zones.
