Will gold prices rise in a one-sided manner?
I. Fundamental Analysis
The gold market is currently in a delicate balance, caught between two major forces: monetary policy expectations and a strong US dollar.
Core Driver: Rising Fed Rate Cut Expectations
Main Logic: Recent dovish signals from several Fed officials (such as Waller and Williams), pointing to significantly lower core inflation and signs of weakness in the labor market, have openly supported a rate cut in December. This caused market bets for a December cut to surge from 40% to 72%.
Market Impact: Rate cut expectations lower US Treasury real yields and weaken the dollar's appeal, providing the most crucial upward momentum for non-yielding gold. This is the core factor currently supporting prices.
Primary Pressure: Strong US Dollar
The US Dollar Index hovering near six-month highs makes dollar-priced gold more expensive for holders of other currencies, capping the upside for gold.
Uncertainty Factors:
Key Data Pending: US Retail Sales, PPI, and Initial Jobless Claims data due this week will be key to validating the Fed's potential rate cut logic. Any strong data could weaken rate cut expectations and weigh on gold.
Geopolitical Risks: Persistent conflicts in Ukraine and the Middle East provide safe-haven demand. Continued inflows into Gold ETFs offer underlying support, limiting significant downside.
Fundamental Summary: The market is weighing "upward momentum from rate cut expectations" against "pressure from a strong dollar and data uncertainty," leading to a lack of clear directional momentum in the short term and resulting in consolidation.
II. Technical Analysis
The technical picture clearly shows the current consolidation phase and provides key entry and risk management levels.
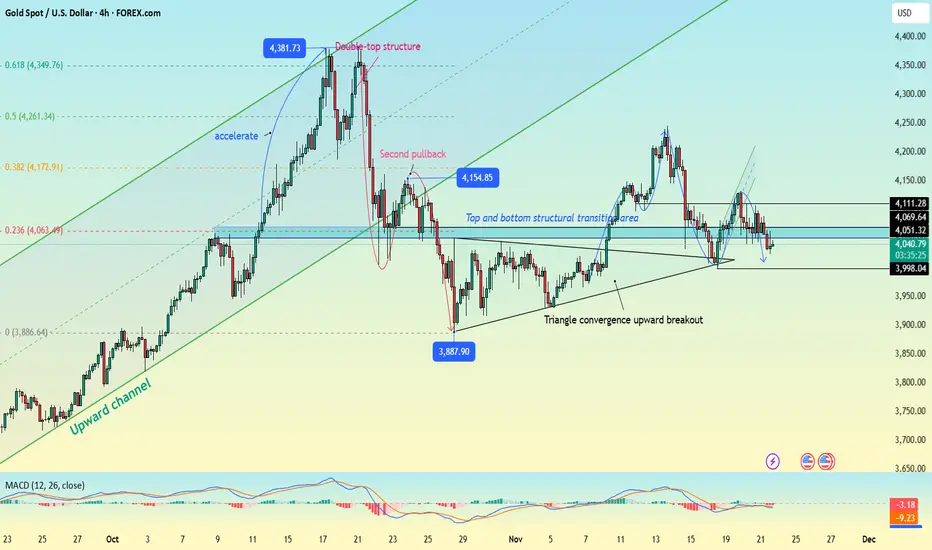
Daily Chart: Symmetrical Triangle Consolidation
Pattern: Lower highs and higher lows are forming a symmetrical triangle pattern, indicating a balance between bulls and bears and brewing a potential breakout.
Key Levels:
Core Support: $4030 (triangle lower trendline support).
Core Resistance: $4130-$4135 (triangle upper trendline and previous high resistance).
Indicator: The MACD shows a bearish crossover but with weakening momentum, indicating lackluster selling pressure and a market awaiting a new direction.
4-Hour / 1-Hour Charts: Range-Bound
Main Range: Price action is confined within a broad $4020 - $4130 range.
Short-Term Structure: The convergence and flattening of short-term moving averages and the MACD lines indicate a temporary market equilibrium, waiting for an external catalyst to break.
Technical Summary: Gold is consolidating within the $4020-$4130 range. Until this range is decisively broken, buying near support and selling near resistance is the primary strategy.
Comprehensive Trading Strategy
Core Idea: Range-bound trading, selling highs and buying lows. Look for long opportunities near the range support and short opportunities near the range resistance.
Key Resistance Zone: $4110 - $4130
Key Support Zone: $4020 - $4040
Specific Operational Plan:
Short Strategy (Sell on rally to resistance)
Ideal Entry Zone: $4120 - $4130
Stop Loss: Above $4140 (a decisive break above the range high)
Targets: First target $4070-$4060, second target $4050.
Long Strategy (Buy on dip to support)
Ideal Entry Zone: $4040 - $4050
Stop Loss: Below $4020 (a decisive break below the range low)
Targets: First target $4080-$4090, second target $4100.
Breakout Follow-up Strategy (Contingency Plan)
Upside Break Confirmation: If the price breaks and sustains above $4140, it signals a potential upward move. Consider following the breakout with long positions, targeting $4180-$4200.
Downside Break Confirmation: If the price decisively breaks below $4020, it indicates increased downside risk. Consider following the breakout with short positions, targeting $3980-$3950.
Risk Warnings and Trading Discipline
Monitor Data and Events: Closely watch the release of US economic data this week and any unexpected comments from Fed officials, as they can instantly shift market expectations and cause sharp volatility.
Strict Risk Management: Always use stop-losses and control the percentage of capital risked per trade. Avoid holding losing positions hoping for a reversal, especially in ranging markets.
Remain Flexible: If the price action shows hesitation or false breakouts near key levels, exit positions and wait for clearer signals.
Trade ideas

Gold Rebounds: 4100 Test Fails, Awaits RetryGold is in a rebound trend, attempting to break through 4100. The first breakout attempt failed, with prices pulling back to around 4090—awaiting fresh bullish momentum for another breakout
Buy 4080 - 4085
TP 4100 - 4110 -4120
Accurate signals updated daily. They serve as a reliable guide for trading issues – feel free to refer to them. Hope they help!

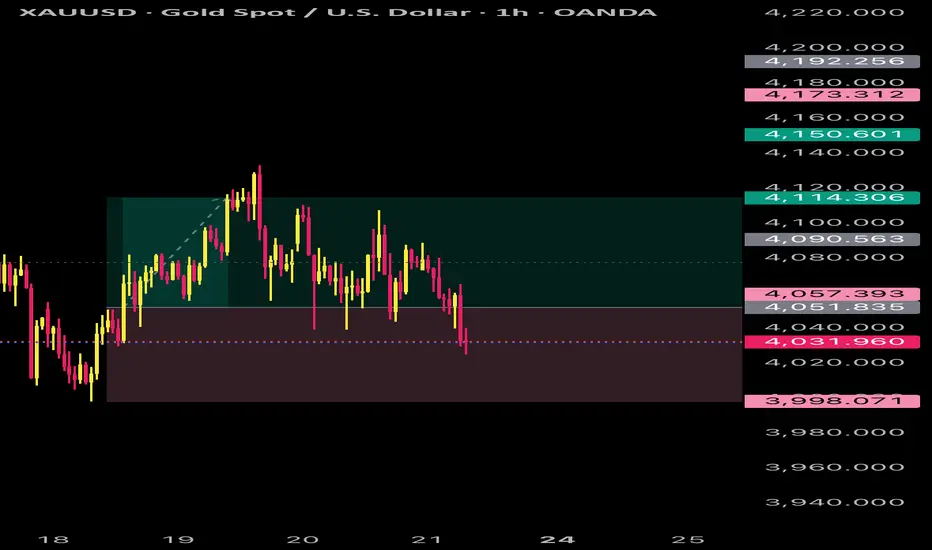
XAUUSD On the 1-hour chart, Gold is currently trading inside a tight symmetrical triangle, with price compressing between a rising trendline from the November 5th lows and a descending trendline from the November 14th highs.
Price is hovering around the $4,070 zone, which also aligns with the 50-period moving average, showing indecision but increasing pressure for a breakout.
A break and retest above the $4,085–4,095 resistance zone (highlighted in grey) may trigger a bullish momentum wave. The projected breakout target points toward the $4,180–4,220 region, based on the measured move from the previous swing.
As long as price holds above the rising trendline support, the structure remains bullish, with buyers expected to step in on any retest of support.

Still Good Long R:R's (Gold)Setup
Bullish trend / Correction
Gold still above 50 day moving average
Daily RSI stable around 50 level
Has made a 50% correction of rally since breakout at 3400
Commentary
It seems likely gold needs to first complete an ABCD correction before moving higher - meaning one more lower low. However, support at 3920 could hold, offering good R:R opportunities - even if 4200 holds as resistance.
Strategy
Look for bullish reversals below 4000, above 3920 support
Wait for bigger pullback to the 61.8% Fib / demand zone under 3800

Will gold break the 3-decade wedge — or will repeat historyWill gold break the 3-decade wedge to 5K — or will repeat history with a deep correction?
* Gold is now testing a decades-long ascending wedge resistance, a structure that has held since the late 1980s.
- The current rally has pushed prices into a confluence of resistances — the upper wedge boundary and the upper Bollinger Band — historically a zone where major tops have formed.
Momentum indicators support this caution:
- RSI is in extreme overbought territory, trending above its long-term rising trendline.
- ADX and DI+ are reversing from elevated levels, a pattern seen during previous long-term tops in 2011 and 1987, both of which triggered multi-year declines.
* Historically, gold has corrected 30–50% after touching similar long-term resistance zones.
* If the wedge holds again, a corrective move toward $3,000 cannot be ruled out.
However, shorter timeframes continue to show strength toward the psychological level of $5,000, suggesting this rally still has momentum.
The real question is:
* Will gold break the 3-decade wedge for the first time — or repeat history with a deep correction?
* Time will tell… likely around 2029, when price meets the next major trendline test.

XAUUSD SHORT UPDATEGold has since been respecting the points and areas that l have marked out, still expecting it to sell as shown on my charts
DISCLAIMER: This is not investment advice and purely for educational purposes
WHAT ARE YOUR THOUGHTS ?

Gold at a Critical Juncture - A Bearish Correction Warning
The XAUUSD chart is currently exhibiting a potential bearish reversal pattern, identified as a Head and Shoulders top. The key levels for this pattern are as follows:
· Head (Pattern High): $4377
· Neckline: $3890
· Current Price Action: Trading around $4044, approaching the neckline from above.
A confirmed break and daily close below the $3890** neckline support would validate this pattern and open the path for a deeper correction towards the key support zone around **$3600.
Important Context:
It is crucial to note that the long-term trend on higher timeframes remains structurally bullish. The potential breakdown discussed here is primarily a warning for a deepening corrective phase on the Daily and 4-Hour charts, not necessarily a reversal of the primary long-term uptrend.
Summary:
· Scenario: Bearish correction within a broader bull trend.
· Trigger: Daily close below $3890.
· Target: $3600 (Key Support Zone).
· Invalidation: A move back above the $4377 head high.
OANDA:XAUUSD


XAUUSD: We see a sell opportunity! Hello Traders,
This is the 1Y chart
We are defiantly bullish
The shorter-term chart is also bullish! However, we see some corrections and ranges lately.
For now!
I think we might have a chance to short the Gold around the zone we previously sellers were so strong.

XAUUSDbased on tecnical only the breakout and creating new low or high will have the new confirmation what gold really up to? considering as an this week gold had played side ways and din break the inside resistent and support. lets see how gold close as weekly candle.
clear draw on the chart so take a good look and understand.
what you think leave a your comment below.

Another Golden Opportunity!Gold's corrective move the past few weeks has now led to a bounce, expect some more gains in a likely ABC bounce to be followed by further correction towards $3800ish.
This wave 5 might only be wave 1 finished at $4380, a wave 2 corrective decline to be followed by a stronger wave 3...of course anything can happen, new highs in the next week or so will be very welcome.
Let's see the pattern play out before we are clearer on the outcome, expect this bounce to peter out towards $4190ish, if a resumption of the correction develops, another golden opportunity presents itself around $3800.
Whatever happens, this wave 5 will see $5000 plus and possibly $6000...remember $3000?
Appreciate a thumbs up, good trading and God Bless you all!

Gold's decline intensifies, approaching key support; a battle beGold's decline intensifies, approaching key support; a battle between bulls and bears amid internal Fed disagreements! 🦅
Market Recap: On Friday (November 21), spot gold continued its decline in European trading, currently trading around $4048 per ounce, a drop of nearly $30 on the day! Gold prices remain under pressure below $4100, mainly due to rising market expectations that the Federal Reserve will maintain a hawkish stance, suppressing the attractiveness of gold as a non-yielding asset. Although yesterday's non-farm payroll data appeared better than expected, details revealed a weak labor market, only briefly boosting gold prices. Subsequently, US stocks surged and then retreated, and Asian stock markets plummeted, dragging gold down as well. The market is currently debating whether gold will recover its valuation along with equity assets, or whether it will regain its upward momentum as a "mistakenly sold-off" safe-haven asset. The answer still requires guidance from both technical and data analysis. 📉📈
Fundamental Focus:
1️⃣ Fed Policy Divergence Emerges:
The minutes of the October FOMC meeting showed significant disagreement among members regarding whether to cut interest rates in December. Two committee members even voted against the rate cut: one advocated a 50 basis point cut, while the other advocated holding rates steady. All members reiterated their commitment to achieving the dual mandate of "full employment + 2% inflation," but expressed concern that consecutive rate cuts could push up long-term inflation expectations, negating previous anti-inflation gains. Powell had previously emphasized that a December rate cut was "not a done deal," and the policy path remained uncertain.
2️⃣ Market Sentiment and Opportunity Cost
The fluctuating expectations of a rate cut directly increase the opportunity cost of holding gold, putting downward pressure on gold prices. While increased volatility in global stock markets should theoretically boost safe-haven demand, gold is currently more driven by real interest rates and the US dollar, leading to increased short-term correlation with risk assets.
Technical Analysis
🔍 Trend Judgment: Bears Prevail, Consolidation Awaits Breakout
Gold prices began a correction from $4381, rebounding to around $4130 this week before encountering resistance again, confirming that the rebound is not a reversal.
Currently fluctuating between $4000 and $4100, but the structure is bearish. A break below $4000 would likely lead to further declines towards the $3980-$3950 and even $3915 support levels.
Key resistance lies in the $4100-$4110 area. Only a strong breakout above this range can alleviate downward pressure and test the upper edge of the triangle consolidation pattern.
🎯 Trading Strategy: Sell on rallies, be cautious about attempting to catch a rebound.
Short Positions: Sell in batches at $4070-$4075, stop loss at $8, target $4040-$4020, break below to $4000.
Long Positions: Consider a small long position at $4000-$4005, stop loss at $8, target $4030-$4050.
(Note: Specific entry points may vary depending on real-time market fluctuations. Discussions and updates are welcome!)
XAUUSD Possible Sell Setup“Price has reacted from the higher-timeframe supply and respected the descending trendline. Current structure shows confirmed bearish order-flow with BOS/ChoCH sequences. The pullback is now testing fresh supply. Below the 4080 zone, bias remains bearish, with downside targets at 4040 and 4020 demand levels.”
XAUUSD Possible Sell Setup
Entry: 4075–4080
SL: 4092
TP: 4040 / 4020
Bias: Price rejected supply and is respecting the downtrend.

BUY!BUY!BUY!Macroeconomic Policies: Rate Cut Expectations Reignite, Policy Bottom Emerges
1. Weak Employment Data Consolidates Easing Foundation
The U.S. added 119,000 nonfarm payrolls in September (vs. expected 50,000), slightly exceeding market forecasts. However, cumulative downward revisions to the previous two months’ data reached 33,000 (July revised down from 79,000 to 72,000; August revised down from 22,000 to -400), indicating a clear cooling trend in the labor market. More critically, the October nonfarm payrolls report could not be released due to the government shutdown. The Federal Reserve will only have access to this "below-trend" employment report ahead of its December FOMC meeting, significantly reducing the probability of a hawkish rate hike. The likelihood of a December rate cut has rebounded from 44% at the start of the month to 50%. Historical data shows that after consecutive downward revisions to employment data, the probability of Fed easing within three months reaches 68%, providing core policy support for gold.
--------------------------------------------------------------------------------
2. Fed Policy Pivot Is Inevitable
The Fed implemented a 25BP rate cut at its October FOMC meeting and announced the end of quantitative tightening (QT) starting December 1st. Despite Jerome Powell’s hawkish rhetoric, divisions among committee members have widened (2 votes in favor of a larger rate cut, 1 vote against the cut), signaling the start of an easing cycle. The meeting minutes explicitly mentioned "rising downside risks to employment," with the policy focus shifting from "fighting inflation" to "supporting growth." The downward channel for real interest rates has opened, benefiting gold—a non-interest-bearing asset.
--------------------------------------------------------------------------------
3. Pressure from the U.S. Dollar Index Weakens
The U.S. Dollar Index (DXY) has fluctuated between 99.5 and 100, failing to achieve an effective breakout. Technically, it exhibits a "bearish divergence" pattern (price making new highs while MACD fails to do so). As weak U.S. economic data signals spread, the DXY faces increased short-term downward pressure. A break below the 99 level will further unlock upside space for gold.
Gold trading strategy
buy:4055-4065
tp:4080-4100-4130
sl:4040

XAUUSD PROFITABLE Gold had behaved accordingly and hit take profit, next move can be to wait and relax for it to play out before executing
Monthly Gold "The end"🟡 Comprehensive Analysis of Gold (XAUUSD)
In this analysis, we can clearly see that gold is still moving within a strong bullish channel. The price is respecting the structure formed by the upper resistance line and the two support lines (0 and 0.5) below.
🔵 The previous all-time high was around 1,952, and as shown on the chart, the price has broken above that level and continued into a powerful rally, reaching a new all-time high around 4,502.
✨ After this strong upward movement, the price touched the upper boundary of the channel — a zone that typically acts as a point of rejection. The chart illustrates a potential scenario where the price may start a pullback, enter a consolidation phase, and then drop to retest one of the support lines.
✔️ In other words: Gold is currently in a sensitive area. The new all-time high may trigger a correction before the market decides its next major move. However, the overall long-term trend remains bearish.
📉 The oscillator at the bottom shows strong overbought conditions, which increases the probability of a short-term downward correction.
🔔 Summary
Overall trend: bearish
Current position: At major resistance
Most likely scenario: long-term correction toward support (at 3510)
Best opportunities: May appear at lower levels after the market cools down
The Entries:
Downtrend: Until correction could be around (4000-3510)
If the price close under 4000 that mean we are going to 3510,
if the price close above the 4000 that mean we are going to rise maybe more than ATH could be 4800 or 5000.
Have a nice trade fellas.

Gold Analysis & Trading Strategy | November 20-21✅ From the 4-hour chart, gold remains in a weak, downward-biased consolidation structure after yesterday’s failed rally.
1️⃣ Moving averages show a bearish setup
MA5 and MA10 have formed a bearish crossover and continue to slope downward, indicating that short-term bearish momentum still dominates.
MA20 (around 4082–4088) acts as strong resistance; price has repeatedly failed to break above it, showing weak rebound strength.
2️⃣ Bollinger Bands indicate weakness
The Bollinger middle band (around 4069) continues to suppress the price; the latest candles remain below it — a classic weak consolidation pattern.
The lower band (around 4014) remains the next downward target.
3️⃣ Rebound attempts fail
Multiple attempts to break above 4088–4090 failed, creating a short-term top structure.
The recent rebound also failed to break above the moving averages, showing continued lack of bullish momentum.
➡️ H4 Conclusion: The structure remains bearish. As long as price stays below 4090, the market bias remains to the downside.
✅The 1-hour chart confirms the same bearish structure:
1️⃣ Clear downward channel
After topping at 4132, gold dropped sharply to 4038, then rebounded to 4068–4070 and faced renewed selling pressure.
MA5 / MA10 / MA20 / MA60 are again aligned in a bearish formation.
2️⃣ Rebound momentum is weak
The latest rebound only reached MA10–MA20 before turning down again, showing strong selling pressure.
Key resistance remains at 4070–4085; breaking above this area is unlikely.
3️⃣ Key support at 4044–4038
This zone has shown short-term buying interest but lacks strength.
A break below this region will open the path toward 4015–4008.
➡️ H1 Conclusion: Weak short-term structure with limited rebound strength. More downside tests toward 4044–4038 remain likely.
🔴 Resistance Levels
4070–4085
4100–4110
4132
🟢 Support Levels
4044–4038
4015–4008
3997
✅ Trading Strategy Suggestions
🔰 Strategy 1: Sell the Rebound (Main Plan)
If gold rebounds to 4070–4085 and faces rejection:
➡️ Enter light short positions
SL: 4090
Targets: 4055 / 4044 / 4035
👉 This is the highest-probability strategy under current conditions.
🔰 Strategy 2: Strong Resistance Short (Aggressive)
If gold reaches 4100–4110:
➡️ Use medium position shorts
SL: 4120
Targets: 4065 / 4045
👉 Strong resistance zone; breakout probability is low.
🔰 Strategy 3: Breakout Short Below Support
If gold breaks 4044–4038:
➡️ Follow the trend with breakout shorts
Targets: 4015 / 4000
👉 Loss of this zone will open further downside.
📌 Summary
Both H4 and H1 remain in a weak bearish structure.
Rebounds lack momentum and are consistently pressured by moving averages.
4044–4038 is the key support; if broken, the downtrend will accelerate.
Recommended approach today:
Sell rebounds as the primary strategy
Buy dips only at strong support levels (around 4038)

GOLD SURGING AFTER NFPsetup took the right direction as expected,even though there was manipulation before direction on 1H candle

Gold-price currently holds a strong support level.
-we are changing direction
-bullish reversal candlestick patterns

Gold sells?Looking to short XAU, waiting for confirmation, since we have a red folder I will wait for the new to pass then potentially look for entry after the manipulation if I get H1 confirmation.
I post all my entries here, so follow and share your thoughts as well...

The down wave will continue soonI think the corrective up wave completed in 3 waves which I think was a triple zigzag. The down wave will continue soon.

XAUUSD - Time to buy gold...XAUUSD was recently in a short term downtrend for a few weeks but has now shown some clear bullish movements ahead. XAUUSD (Gold) has broken out of a downward trend channel that was acting as strong resistance, The price is very likely to head to the next strong resistance level which is marked as the take profit zone (green line). Time to buy!

XAUUSD upside target: 4145On the hourly chart, XAUUSD has formed a head and shoulders bottom pattern. Currently, the 4055-4080 demand zone is worth watching; a pullback and stabilization could present a buying opportunity, with an upside target near the 4145 resistance level.
