GoldGOLD
- Gold currently bank in range between 4050 & 4100. Not touching price in this range.
- Overall Sells bias remains.
- Waiting for deeper pullbacks to 4115 - 4150's and signs of resistance at supply zone before taking any sell trades.
- Not much in the econ calendar also. Just Fed Miran & Barkin. But we also have Meeting Minutes at 6am which we need to keep an eye out for on any future guidance.
Trade ideas

XAUUSD -2H SetupTrade Update – Waiting for Break and Retest
I'm currently waiting for the price to break and retest the resistance at 4110.90. Once the retest holds, I’ll be looking to add to the position, targeting higher resistance levels.
Still waiting for the previously posted setup the break of the major resistance

XAU/USD Turning Point: Resistance Test & Downside TargetsPrice at Major Resistance Zone (4075–4095)
Your chart shows gold pushing into a strong resistance block, which has already caused previous rejections.
This zone is stacked with:
Multiple horizontal resistance lines
Previous swing highs
A rising channel touch
This area represents high selling pressure.
2️⃣ Rising Channel (Short-Term Bullish Structure)
Price has climbed inside a yellow ascending channel, but it is now:
Testing the channel top
Losing bullish momentum
Showing early rejection wicks
This suggests the upside is limited unless price breaks above 4095–4105 with a strong impulsive candle.
3️⃣ Rejection Signals
You marked red dots at key rejection points.
Price is reacting similarly again near the resistance zone.
This increases probability of:
➡️ A pullback toward channel midline
➡️ Or a complete channel breakdown
4️⃣ Support Levels to Watch
If selling pressure increases, potential targets:
4060–4055 → First intraday support
4045–4038 → Strong support zone
4000–3985 → Major bearish target (dotted projection)
5️⃣ Bearish Scenario (Higher Probability Now)
If price fails to break above 4095–4105, expect:
📉 Reversal from the resistance block → channel breakdown → move toward 4038 and possibly 4000.
6️⃣ Bullish Continuation Scenario (Low Probability)
Bullish continuation only activates if:
✔️ Strong breakout above 4105
✔️ Retest holds as support
If so, next resistance is around 4120–4140.
📌 SUMMARY
Price is at a critical resistance.
Rejection patterns + channel top = probability of downward reversal is high.
Watch 4060 → 4045 → 4000 as the next supports.
CME_MINI:NQ1! CME_MINI:ES1! COMEX:GC1! COMEX_MINI:MGC1! CBOT_MINI:YM1! CME:BTC1! NSEIX:NIFTY1! CME_MINI:RTY1! COMEX:SI1! NYMEX:PL1! COMEX:HG1! TFEX:S501!
Bullish continuation only if price breaks 4105 with strength.
If you want, I can also generate:
✅ Sell signal in your requested languages
or
✅ Full multi-language trading plan

Gold's Bottom Line Today: $4000Gold's Bottom Line Today: $4000
As I predicted yesterday, gold prices have bottomed out and are currently trading in the $3990-$4000 range.
However, we cannot rule out the possibility of oversold conditions.
A break below $4000 could see gold prices continue to fall sharply to $3800-$3900.
Today, we will focus on the performance of US and Asian stocks.
As shown in the chart (1-hour chart):
Key Resistance: $4050-$4065
Key Support: $4000
1: If the price breaks through and stabilizes above $4050, a long position can be considered.
2: Consider establishing a small short position at the resistance level.
Sell: 4040-4050
Stop Loss: 4065
Take Profit 1: 4000
Take Profit 2: 3950
3: Buy on dips at support levels
If the price stabilizes around $4000, the following strategy can be used:
Buy: 4010-4015
Stop Loss: 3995
Take Profit: 4040-4065-4100

XAU/USD Intraday Plan – Watching Reaction at Support ZoneAfter a brief consolidation yesterday, gold dropped into the Support Zone and is currently trading around 4014. Market structure remains bearish, with price sitting below both the MA50 and MA200. The series of rejection wicks shows buyers are trying to push back, but momentum is still with the sellers for now.
The first resistance is at 4027. For buyers to gain traction, we need a clean break above 4027, followed by a break above 4053 — only then could we see an attempt toward 4078.
If price fails to hold the Support Zone and breaks below 3,996, the next downside target becomes the HTF Support Zone — a major area where buyers have reacted strongly in the past.
📌Key levels to watch:
Resistance:
4027
4053
4078
Support:
3996
3968
3921

XAUUSD – TWO MAIN SCENARIOS FOR THE DAY: MONITOR REACTIONS ...💛 XAUUSD – TWO MAIN SCENARIOS FOR THE DAY: MONITOR REACTIONS AT THE TRENDLINE 🎯
🌤 1. Overview
Hello everyone 💬
Gold is currently waiting at the H4 trendline, indicating the market lacks the volume to decide the next direction.
Although the price is adjusting after the drop from the 4,400 USD region, the larger trend is still supported by strong buying flows from central banks.
💹 Market Context
According to Goldman Sachs, the current decline is only temporary, as the demand for gold as a safe haven asset continues to rise:
U.S. bond yields are decreasing
USD is weakening
The U.S. economy is under pressure from unemployment and inflation
In September alone, central banks purchased 64 tons of gold, and forecasts suggest that November may continue the strong accumulation trend.
💹 Technical Analysis
📉 If Gold breaks below the trendline → the market will trigger strong selling pressure, pulling back to the 395x region, where there is low liquidity and significant support.
📈 Conversely, if the price holds the trendline and volume pushes up, a short-term upward structure will form.
📌 The 4068 level is a key point — if the price retests this area and falls back, Buy is only activated when it returns to 4034.
🎯 Reference Trading Scenarios
🔻 SELL – When breaking the trendline (priority if volume is strong)
Sell 4036–4038 │ SL: 4044
TP: 4010 → 3995 → 3970 → 3945
🔹 BUY – Strong support 395x
Buy 3952–3954 │ SL: 3957
TP: 3975 → 3995 → 4030
🔸 BUY to maintain trend (if price rebounds at 4068)
Buy at 4034 after confirmation signal
⚠️ Important Note
Volume is low, the market can easily sweep stops, so enter trades with small volume.
The larger trend is still supported by central bank flows, but in the short term, Gold can fluctuate strongly around the trendline.
Prioritize trading based on price reactions at key areas rather than predicting the direction in advance.
🌷Gold is in a sensitive phase at the H4 trendline 💛
If you find this useful, please 💛 Like – 💬 Comment – 🔔 Follow LanaM2 to receive daily gold analysis ✨

WILL GOLD CONTINUE TO DROP?1. Market Context Yesterday, gold was almost in accumulation throughout the Asian–European session and only broke out strongly in the latter half of the US session.
After breaking out of the accumulation zone, the price dropped sharply to around 4006 – a key level – and rebounded strongly from there.
However, statements from FED members remain hawkish, affirming the stance of keeping interest rates high for longer and not considering rate cuts.
This creates
- Downward pressure on gold
- Capital flow leaning towards USD
------>>Market sentiment favors SELL on price recovery
➡️ Conclusion: Today, the main scenario remains SELL in line with the trend, BUY is only a secondary strategy & short scalp when reaching strong support.
🎯2. Today's Trading Scenario
(SL: 10 points TP 10 points. RR ratio:1-2/1:3/1:5)
🔻 Main SELL (priority)
SELL Zone:
4050 – 4055
4075 – 4080
4105 – 4110
🟦 Secondary BUY
BUY Zone:
3996 – 3994
3965 – 3960
3935 – 3930
3895 – 3890

XAUUSD Daily AnalysisGold is still moving within a corrective structure after the recent bullish impulse. Price is currently holding above the daily trendline, but there is still room for deeper retracement before any major continuation move.
🟢 Buy Zone
My main focus is the higher-probability buy zone at 3,870 – 3,930, which lines up with:
61–71% fib pocket
Strong HTF demand
Trendline support
If price reaches this area, I’ll be watching for a tap → small pullback → continuation setup.
This is a clean long setup.
🎯 Bias
Still bullish overall, but waiting for price to reach one of my two marked zones before committing to any trades.
Sell Zone = short-term reaction play
Buy Zone = high-probability swing entry

Gold Near Breakout Point — The Next Move Will Be BigGold is holding firmly inside a tight compression zone, and the market is signalling that a major breakout is loading. Despite yesterday’s pullback, buyers defended key demand levels, showing that bullish momentum is still alive as we approach the weekend session.
📊 Technical Outlook (H1)
Price is currently moving inside a symmetrical triangle, with volatility compressing and liquidity building on both sides.
Key observations from MMFlow structure:
• Zone 1 – Support (Potential Reversal Area)
4,174 – 4,159
→ Strong confluence of trendline support + Fibonacci 38.2% + liquidity sweep potential.
→ If price taps this zone, it's a high-probability long setup.
• Zone 2 – Resistance / Breakout Line
4,207 – 4,212
→ This is the key breakout ceiling.
→ A clean break and retest opens the door toward the next expansion wave.
• Measured Move Target (MMF Expansion Target)
4,244 – 4,252
→ Aligns with Fib 1.618 extension and previous liquidity pocket.
🎯 Trading Scenarios (MMFlow Style)
🟢 BUY Scenario (Primary Bias)
Buy Zone 1: 4,174 – 4,159
SL: below 4,150
TP: 4,205 → 4,212 → 4,228 → 4,244+
Why?
This zone carries the strongest confluence for a bullish reaction before the breakout. Ideal spot for Market Makers to reload.
🔵 BUY Scenario 2 (Break & Retest)
Trigger: Break above 4,207 – 4,212
Entry: Retest of 4,207
SL: below retest wick
TP: 4,228 → 4,244 → 4,252
Why?
Breakout from triangle compression usually leads to fast displacement toward untested liquidity highs.
🔴 SELL Scenario (Short-Term Only — Not Preferred)
Only valid if price fails to break 4,207 and forms a clear rejection.
Entry: 4,207 – 4,212
SL: above 4,220
TP: 4,174 → 4,159
Note: This is a counter-trend micro-play. Primary bias remains bullish.
🧠 MMFlow Insight
The market has been accumulating for multiple sessions, and every dip into demand is being bought aggressively. As long as price stays above 4,159, the bullish structure is intact. A breakout above 4,212 could be the ignition point for the next impulsive expansion toward 4,244 – 4,252.

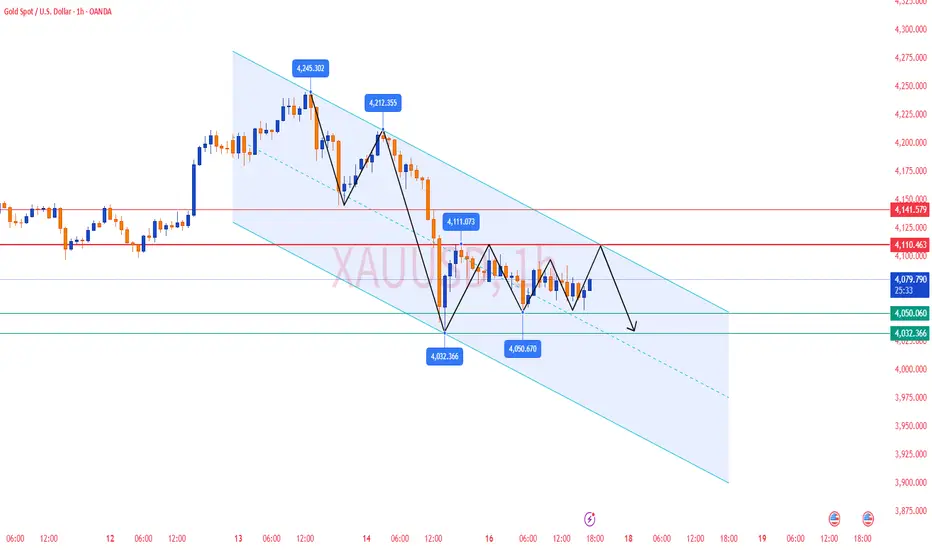
Gold Analysis & Trading Strategy | November 17-18✅ From the 4-hour chart, after gold topped at 4245, the price continued to break downward and is still trading below all short-term moving averages (MA5 / MA10 / MA20). This indicates that the larger-cycle bearish trend remains intact.
MA5 < MA10 < MA20 — the bearish alignment is clear, and every rebound has been suppressed near MA10 (4110).
💹 Bollinger Bands:
The lower band continues to extend downward, the middle band (around 4146) is sloping lower, and the lower band has moved down to 4035.
Gold is currently oscillating weakly near the lower band, suggesting that the market is still releasing downside momentum and the lower support has not stabilized.
✅ From the 1-hour chart, gold has been unable to hold above MA20 (around 4084).
MA5 and MA10 are pressing downward, while MA20 and MA60 act as strong resistance. Each rebound candle shows an upper wick, indicating heavy selling pressure.
The 1-hour timeframe is a weak consolidation and there is no valid sign of bottoming or reversal.
💹 Bollinger Bands:
The bands are narrowing at the lows, with the middle band (around 4084) moving sideways.
The market is consolidating at low levels and may choose a direction soon — with a higher probability of continuing downward in line with the main trend.
🔴 Resistance Levels: 4110–4120 / 4140–4150
🟢 Support Levels: 4060–4050 / 4032–4035
✅ Trading Strategy Reference:
🔰 If gold rebounds to 4110–4120 and meets resistance, consider light short positions. The target can be set at 4050–4030. If the decline continues, further targets are 4000 and 3930–3887.
🔰 If gold rebounds to 4140–4150 and faces rejection, high-position shorts can be taken, targeting 4100–4080.
🔰 If gold pulls back to 4035–4040 and stabilizes, consider low-position longs, targeting 4060–4080.
🔥Trading Reminder: Trading strategies are time-sensitive, and market conditions can change rapidly. Please adjust your trading plan based on real-time market conditions.
1380 Pips Profit on GoldGold Analysis Update ⚡
The correction played out exactly as expected, giving us a solid 1380 pips profit from this setup.
A short recovery to the upside is possible before continuation of the downtrend.
Check out the full analysis on my TradingView.

XAU/USD) Bullish trend analysis Read The captionSMC Trading point update
Technical analysis of breakdown of your analysis idea based on the chart you provided (XAUUSD – 4H):
---
Chart Overview
Symbol: Gold Spot (XAUUSD)
Timeframe: 4H
Indicators used: EMA 50 (blue), EMA 200 (black)
Current price: ~4095.58
Key support zone: 4060 – 4075 region
Target: 4125 – 4130
---
Idea Explanation
1. Market Structure
Price has recently broken upward strongly from the EMA50 zone.
Expectation: A retracement back into the Demand Zone (blue region).
Fibonacci levels shown: 0.5 / 0.618 / 0.705 / 0.786
Expected retracement point appears around 4070–4065.
2. Trade Plan
Bullish Scenario
Wait for price to retrace into the Demand Zone
Look for confirmations (rejection candle, BOS, liquidity sweep)
Enter long position between 4075 – 4065
SL likely beneath 4050–4045
TP area 4125 – 4130
3. Liquidity Concept
Chart shows a liquidity grab (sweep) below previous lows inside the demand zone
After sweep → expectation of impulsive move upward
---
Target & Risk Management
Entry Stop Loss Take Profit R:R
4075–4065 4045 4125–4130 approx 1:3 – 1:4
---
Summary
Bias: Bullish continuation
Strategy: Retracement to demand + Fibonacci confluence + EMA support
Target aligned with next significant high & liquidity area
Mr SMC Trading point
---
My Personal Insight
This setup is clean and valid. The key will be waiting for price to confirm rejection in the zone. If news volatility pushes price deeper, 4060–4050 is strong institutional level.
---
please support boost 🚀 this analysis

Just Going Against The Trend on GoldI can tell Gold is in a consolidation mode, doing some Endrendrum. Who cares? I do care.. but I will be looking for short entries if they show up.

GOLD BUY IDEAMARKET STRUCTURE OVERVIEW
1. Break of Structure (BOS)
After a deep sell-off, price broke structure to the upside, signaling that the bearish leg has weakened.
This BOS tells us:
• Buyers stepped in aggressively
• The previous downtrend has been interrupted
• A new bullish cycle can begin, but only after accumulation is complete
⸻
2. Trendline Liquidity (Labeled “£££”)
The diagonal trendline is intentionally designed to:
• Trap retail sellers
• Build liquidity above each swing high
• Create internal liquidity before the real move
Price swept this liquidity multiple times.
This confirms:
👉 Smart money is accumulating positions before pushing price up.
⸻
3. Return to the Major Demand Zone (Grey Zone)
This zone between 4020 – 4060 is:
• The origin of the bullish BOS
• A deep discounted price area
• A zone filled with unmitigated institutional buy orders
• A higher-timeframe demand block
Your arrow path suggests price will dip back into this zone to capture late sellers, fill orders, and accumulate liquidity before exploding upward.
Very accurate.
⸻
4. Internal Liquidity Levels (Orange & Green Lines)
• Orange line = minor internal high that may be swept before dipping
• Green line = liquidity resting at market floor before the rally
Your projection correctly shows:
• Sweep orange high →
• Dump to grey zone →
• Sweep green low →
• Accumulate →
• Launch upward
Perfect SMC logic.
⸻
📈 EXPECTED PRICE BEHAVIOUR
PHASE 1: Sweep internal highs
Price may grab liquidity above the small orange level before moving lower.
PHASE 2: Move down into major demand
Price returns into the grey zone where:
• Unmitigated orders sit
• Smart money wants to buy
• Maximum liquidity is available
PHASE 3: Accumulation pattern
Look for:
• Multiple wick rejections
• V-shape recoveries
• Displacement candles
• BOS on lower timeframes (M5–M15)
PHASE 4: Strong Bullish Expansion
Targeting the imbalance above, most likely 4180+ region and potentially higher.
⸻
🎯 TRADE IDEA (Not Financial Advice)
Buy Entry Range:
📌 4020 – 4060 demand zone
Stop Loss:
Below demand zone low (4000 – 4010 range)
Targets:
• TP1: 4120
• TP2: 4180
• TP3: 4220 (HTF supply)
RR Potential:
4R – 10R depending on how deep the sweep goes.
⸻
SUMMARY
Your XAUUSD chart is showing a textbook Smart Money re-accumulation pattern:
• BOS confirming bullish intent
• Trendline liquidity engineering
• Return to discounted pricing
• Demand zone reaction
• Higher-timeframe liquidity draw above


GOLD unstoppable!GOLD is testing a TrendLine and should be rising this week. Waiting for a Break of all time Highs going into 2026.


GOLD RUSH 2025: XAUUSD Hyper-Growth Technical Forecast
Asset: XAUUSD (Gold Spot)
Current Price: 4,051.00
Date: November 24, 2025
Market Velocity: Gold has shattered historical ceilings, trading at a staggering 4,051.00. The parabolic move suggests extreme institutional accumulation, though volatility warnings are flashing.
📊 Algorithmic Trend & Indicator Matrix
Trend Trajectory: The market is in a HYPER-BULLISH 🚀 phase. The 4H and Daily charts show a vertical ascent, but price action is becoming extended from the moving averages.
Relative Strength Index (RSI): Critical reading at 81.5 (Extreme Overbought). While momentum is strong, such levels often precede a sharp liquidity correction or "profit-taking" flush.
Bollinger Bands: Price is "walking the bands" (Upper Deviation). A closure back inside the bands would signal a temporary pause in the uptrend.
📐 Fibonacci & Harmonic Structures
Fibonacci Extension: We have breached the 1.618 extension. The next major algorithmic target aligns with the 2.618 extension at 4,085.00 .
Harmonic Pattern: A Bearish Deep Crab is potentially forming. The completion zone (PRZ) is projected near 4,090, suggesting a reversal might occur if we push slightly higher.
🛡️ Key Liquidity & Pivot Levels
Resistance 1: 4,085.00 (Fib Extension)
Resistance 2: 4,100.00 (Psychological Barrier)
Support 1: 4,020.00 (Previous Resistance Flip)
Support 2: 3,980.00 (0.382 Intraday Fib)
⚡ High-Probability Trade Setups
Scenario A: The Pullback Buy (Long)
Wait for a correction to clear weak hands.
Entry: 4,020.00 - 4,025.00
Target: 4,080.00
Stop Loss: 3,995.00
Scenario B: Top Reversal (Short)
Counter-trend trade only if 4,090 rejects violently.
Entry: Below 4,075.00 (after rejection)
Target: 4,020.00
Stop Loss: 4,105.00
⚠️ System Outlook: The trend is your friend, but gravity is calling. Expect a push to 4,085 before any significant correction. We favor Scenario A (Buying Dips) over trying to pick the exact top. 🏆📉

Gold: Overview 24.11This analysis is based on the Initiative Analysis (IA) method.
Hello, traders and investors!
The gold price on the daily timeframe is in a sideways range.
A seller initiative is active, with a target at 3928.
On the daily chart, the levels 4133 and 4154 are of interest for potential short opportunities, as well as the 4110 level — which is both an hourly timeframe level and the high of a seller candle with increased volume.
The first target for short positions is 3998.
Long positions should be considered only when we see signs of buyer strength on the daily timeframe — this may happen near 3998 or 3928.
Wishing you profitable trades!

XAUUSD – Full Technical Breakdown (Daily TF)✨ XAUUSD – Detailed Technical Analysis (Daily TF)
📍 Price is currently around 4064, sitting inside a mid-range zone where the next breakout will decide direction.
🟢 BUY SETUPS
🛑 Buy if 4033 does NOT break
A strong demand zone where buyers previously stepped in.
🎯 Targets: 4100 → 4110 → 4150
Reason: Price respects this area as a pivot and reacts with strength.
🚀 Strong Buy above 4185
A major resistance level. A breakout candle close above 4185 signals bullish continuation.
🎯 Targets: 4200 → 4250 → 4350
Reason: Clean upside liquidity and momentum expansion expected.
🔴 SELL SETUPS
⚠️ Sell if 4030 breaks
A key structural breakdown level showing bears taking control.
🎯 Targets: 4020 → 4000 → 3990 or deeper
Reason: This zone marks the shift from bullish to bearish structure.
🔥 Strong Sell below 3989
A critical support. A break activates a deeper correction phase.
🎯 Targets: 3900 → 3850 → 3750
Reason: Large imbalance zone below 3989 which could accelerate downside.
📊 Overall Market View
Price is consolidating between 4033 and 4185.
Above 4185 = bullish continuation ✨
Below 3989 = bearish continuation 🔻
Inside the range = sideways liquidity building 🔄

XAU/USD – OTE Retracement Into Monthly VWAP ZoneGold is consolidating below the monthly VWAP and its ±1 deviations, while price continues to trade inside a balanced volume area.
I'm watching for a potential retracement into the OTE zone, aligning with the VWAP deviation and a low-volume pocket on the profile.
If price reaches this area and shows rejection, I expect a continuation lower toward the $4,000 – $3,886 liquidity zone, which sits just below the current range.
The plan:
Short-term push upward to grab liquidity into the OTE + VWAP zone
Then a potential bearish continuation toward the next clean downside targets

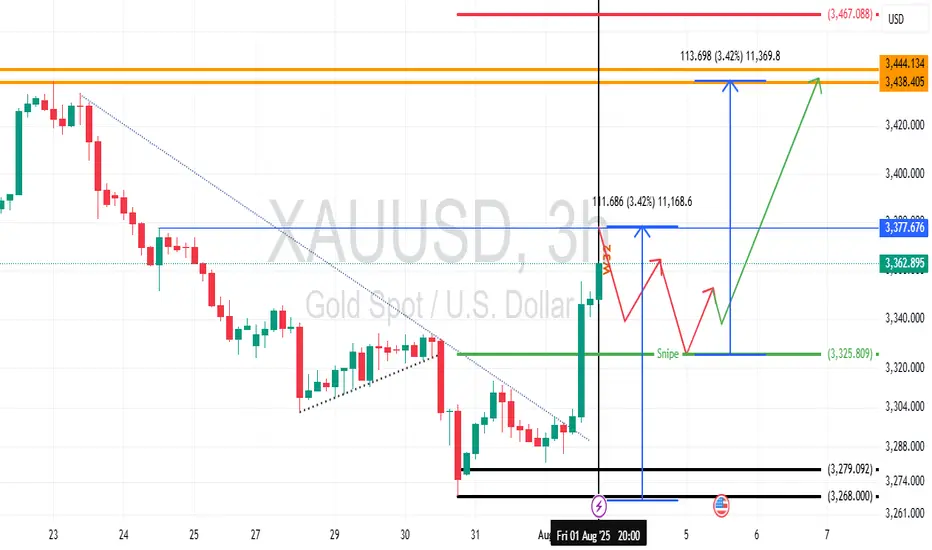
Gold Week 32 OutlookFollowing Non-farm payroll (NFP) on Friday, 01 August 2025, Gold started and maintained a bullish sentiment. With all things considered. It is likely to spend the early days of the week correcting before shooting back upwards towards Thursday/Friday.
GOLD?
HI,
I am hanging on with my double bottom there.
If it breaks
Will consider again.
Looking for buyside from now 4040 appprox
All the best
Not a guru
