XAUUSD | Prices Await Catalyst from NFPGold Price Technical Analysis (XAU/USD) 🛠️
Gold is currently trending downward (depreciating), but is expected to find strong support near key levels.
1. Bearish Scenario ⬇️
Initial Key Support: Any further decline is likely to find decent support near the 200-period Exponential Moving Average (EMA), currently pegged around $4,018.
Psychological Critical Point: The weekly low, just below the psychological $4,000 mark.
Downside Target: A break below $4,000 could accelerate Gold's decline towards:
- Support at $3,931.
- Retesting the late-October low around $3,886.
2. Bullish Scenario ⬆️
Immediate Hurdle: The Asian session high around $4,110 could act as initial resistance.
Upside Trigger: Continued buying beyond the overnight high, around $4,120, will be seen as a new trigger for bullish traders.
Upside Target: A confirmed uptrend will lift Gold prices towards the next relevant hurdle near the $4,152-$4,155 region.
Ultimate Goal: A further move above will pave the way for a recapture of the $4,200 round figure.
Trade ideas

Brian here with the gold outlook for November 20th Good morning everyone, Brian here with the gold outlook for November 20th. The ABC correction phase of gold is nearly complete, and the market is preparing to enter a new wave phase amidst a flurry of USD data today.
Fundamental Analysis
Today's focus remains on the US labor data: NFP (or revisions), Unemployment Rate, and Initial Jobless Claims.
If the data shows a cooling labor market, expectations for the Fed to soon pivot to a rate-cutting cycle will rise, weakening real yields, putting pressure on the USD, and supporting gold prices.
Conversely, "too good" data will strengthen the dollar, allowing for a short-term repricing move, potentially dragging gold down to lower liquidity zones before recovering.
US session liquidity may be thin before the news release, making it prone to spikes due to algorithms and large flows simultaneously adjusting positions.
Overall, the macro backdrop still favors "buying the dip" for gold, but you must accept strong volatility around news time.
Technical Analysis
On the chart, gold has completed an ABC corrective wave within a descending channel, part of a larger uptrend.
The current descending channel only serves as a corrective leg after the previous upward wave; prices are trading above the "mean" area of the bullish structure, indicating the larger market structure remains bullish.
Below is the liquidity zone / demand zone 4013–4015, coinciding with the previous low and the lower channel boundary – if there's another stop-hunt to this area, it is still considered an opportunity to join the upward move, as long as 4008 is not breached.
Above, the 4086–4100 cluster is the decision zone: breaking and holding above here will confirm exiting the corrective channel, triggering an impulsive leg towards resistances 4132–4146 and further to 4187.
In summary, the main bias remains bullish, prioritizing buy strategies at support zones or after breakout confirmation.
Key Price Levels
Resistance: 4086 – 4100 – 4110 – 4132 – 4146
Support: 4040 – 4030 – 4015
Trading Scenarios
Buy Scenario 1 – Continuation Breakout
Entry: 4086
SL: 4078
TP: 4100 – 4120 – 4140
Prioritize when price breaks up and retests 4086–4100 as a new support zone, confirming exit from the descending channel.
Buy Scenario 2 – Deep Liquidity Sweep
Entry: 4015–4013
SL: 4008
TP: 4030 – 4045 – 4070
Watch for strong price reactions at the demand zone, with pin bars or engulfing candles signaling order flow returning to buyers.
Sell Scenario – Sell Reaction at Strong Resistance
Entry: 4144–4146
SL: 4151
TP: 4132 – 4120 – 4100
Short-term sell strategy, leveraging the high supply zone if price rises straight up without sufficient accumulation.
The medium-term upside target if the bullish wave develops as expected remains the 4187 area.
What do you think of this scenario? Remember to follow Brian for daily gold insights and comment your views below to join the discussion.

XAUUSD COMPLETING WAVE 4according to plan, unfold into zigzag correction 12345 - abc - 12345
downward could be an impulse 12345. reentry at wave 2 whan abc completed.

GOLD HIGH PROBABILITY BUY SOON!!!🚨 XAUUSD HIGH PROBABILITY BUY SETUP 🚨
* Here We Can See Clearly The Next Potential Moves For GOLD Coming Hours.
* Keep Your Eyes Close On Your Trading Positions.
* Happy PIP Hunting Traders.
FXKILLA.

XAU-USDThe hourly timeframe has reacted again to the resistance level at 4100 📊
The scenario on the hourly timeframe here is either a breakout of the mentioned resistance to enter a bullish phase ✌️🔼
Or it has to break the trendline downward to come back to the bottom of the large range box 🚨🔽

gold on sideways until breakout#XAUUSD price today is total sideways, but we monitor those price if decline continues. 4046-4040 shows entry on sell, 2 times breakout above 4055.5 on bullish
4046-4040 on sell limit, target 4026-3995, SL 4055.5.
Below 4026 on H4 need reverse back unless the H1 closes below there before selling can continues. The 4055.5 is a strong range which needs 2 times breakout before buying.

Gold: Bullish Momentum Pauses Before the Next Move Gold: Bullish Momentum Pauses Before the Next Move
Gold kicked off the week with an aggressive rally, recovering nearly 50% of the previous drop from 4380 to 3880 in just 24 hours.
Price is now testing a key resistance area around 4130–4150, where we’re seeing a short-term pause in momentum. This could signal that Gold is gearing up for the next impulsive leg to the upside.
However, caution is advised — this pause might develop into a deeper or longer correction before the next move higher. Despite that, the broader trend remains bullish, with no clear signs of reversal for now.
📈 Key Targets:
4190
4230
4360
You may find more details in the chart!
Thank you and Good Luck!
❤️PS: Please support with a like or comment if you find this analysis useful for your trading day❤️

Gold Triangle Breakout Setup Toward 4100 ZoneGold is consolidating inside a symmetrical triangle after breaking below the mid-range zone. A potential bullish breakout could push the price toward the 4100 resistance zone, while the lower support zone remains a key level to watch.
1380 Pips Profit on GoldGold Analysis Update ⚡
The correction played out exactly as expected, giving us a solid 1380 pips profit from this setup.
A short recovery to the upside is possible before continuation of the downtrend.
Check out the full analysis on my TradingView.

XAUUSD -2H SETUP My previous position closed at break-even, so I’m looking to re-enter. I will place a new entry at the current price level, with the stop-loss positioned above the recent swing high. My target remains the next major support zones below. I will monitor price action for confirmation as price continues to move away from the ascending trendline.

GOLD H1 – Gold Reacts to Mixed U.S. Inflation Data🟡 XAUUSD – Intraday Smart Money Plan | by Ryan_TitanTrader (14/11)
📈 Market Context
Gold continues to trade within a balanced range as investors digest the latest U.S. inflation data. The CPI report showed cooling price pressures, while producer prices (PPI) are due soon — both shaping market sentiment toward the Fed’s December rate outlook.
• Softer inflation supports a bullish bias if gold holds the discount zone.
• Renewed USD strength could trigger short setups from premium liquidity zones.
Institutional flows suggest engineered liquidity hunts before a decisive move resumes.
🔎 Technical Analysis (1H / SMC Structure)
• Structure: Gold remains in a short-term bullish correction after a strong sell-off, with recent ChoCH signaling a possible re-accumulation phase.
• Premium Zone: 4300–4298 aligns with a previous unmitigated supply and internal liquidity — ideal for sell-side reactions.
• Discount Zone: 4144–4142 overlaps with the last bullish OB and EMA100 area — a potential demand zone for continuation.
• Liquidity: Resting buy-side liquidity sits above 4300, while inducement below 4140 could lure early longs before true accumulation.
🔴 Sell Setup (Premium Reaction Zone)
• Entry: 4,300 – 4,298
• Stop-Loss: 4,310
• Take-Profit Targets:
→ 4,178 (previous BOS zone)
→ 4,144 (discount retest)
→ 4,110 (deep liquidity pocket)
📌 Valid only after a liquidity sweep and bearish BOS confirmation on M5–M15.
🟢 Buy Setup (Discount Reaction Zone)
• Entry: 4,144 – 4,142
• Stop-Loss: 4,135
• Take-Profit Targets:
→ 4,185 (minor structure high)
→ 4,210 (liquidity void fill)
→ 4,300 (final premium reaction zone)
📌 Valid if price reclaims structure with bullish BOS confirmation.
⚠️ Risk Management Notes
• Stay patient until U.S. PPI data confirms direction.
• Avoid trades between 4175–4250 (low R/R consolidation area).
• Scale out partials near liquidity pools and trail stops after confirmation.
• Maintain disciplined risk exposure under 2%.
Summary
Gold is in an engineered equilibrium phase — liquidity pools are forming at both extremes.
• Sell zone: 4300–4298 (premium reaction zone)
• Buy zone: 4144–4142 (discount accumulation zone)
Expect manipulation around mid-range levels before a clean directional move unfolds.
📍Follow @Ryan_TitanTrader for more Smart Money updates ⚡

GOLD Will Go Lower From Resistance! Sell!
Here is our detailed technical review for GOLD.
Time Frame: 4h
Current Trend: Bearish
Sentiment: Overbought (based on 7-period RSI)
Forecast: Bearish
The market is on a crucial zone of supply 4,085.57.
The above-mentioned technicals clearly indicate the dominance of sellers on the market. I recommend shorting the instrument, aiming at 3,997.50 level.
P.S
The term oversold refers to a condition where an asset has traded lower in price and has the potential for a price bounce.
Overbought refers to market scenarios where the instrument is traded considerably higher than its fair value. Overvaluation is caused by market sentiments when there is positive news.
Like and subscribe and comment my ideas if you enjoy them!

The 3 Pillars of Dow Theory – Break One and the Trend FailsMost traders hear about Dow Theory but don’t truly understand that:
A trend only truly exists when all three pillars agree.
Break just one pillar, and the “trend” you see on the chart may be nothing more than an illusion.
Here are the three “holy pillars” that determine every trend:
1. First Pillar: Price Trend – Price Action as the Foundation
Dow made it very clear:
“The market discounts everything.”
Meaning every piece of news, expectation, fear, and sentiment is already reflected in price action.
To identify the trend:
Uptrend when: Higher Highs – Higher Lows (HH–HL)
Downtrend when: Lower Highs – Lower Lows (LH–LL)
If there’s no HH–HL or LH–LL?
→ No trend exists.
→ Any buy/sell decision is basically guessing.
2. Second Pillar: Volume – The Confirmation of a “Real” Trend
A rising trend with weak volume → fake rally, pushed by “echoes,” not real money.
A falling trend with exhausted volume → high risk of an aggressive reversal.
Volume is the fingerprint of real capital flow.
Strong uptrend → volume must rise
Strong downtrend → volume must expand
Weak trend → volume gradually decreases → early reversal warning
If price moves one way but volume moves another → One of them is lying. And price usually ends up turning around.
3. Third Pillar: Inter-Market Confirmation – “No Market Moves Alone”
This is the part most traders ignore.
Dow believed:
A trend is only valid when confirmed from multiple perspectives.
In Dow’s era, this meant:
– Transportation Index
– Industrial Index
Today, we interpret it more broadly:
BTC rising? → Midcap altcoins or on-chain metrics must confirm.
SP500 rising? → Nasdaq or the Dow Jones should move in the same direction.
XAUUSD rising? → DXY or yields must show weakness.
If one index rises while its “siblings” stay flat or move opposite →The trend is unreliable.
WHY ALL 3 PILLARS MUST ALIGN
Think of a trend as a house:
- Price Action → the foundation
- Volume → the steel structure
- Cross-index confirmation → the supporting walls
Missing 1 element → the house stands, but very weakly.
Missing 2 → it collapses for sure.
Have all 3 → the trend becomes strong, durable, and hard to break.

Gold Near Breakout Point — The Next Move Will Be BigGold is holding firmly inside a tight compression zone, and the market is signalling that a major breakout is loading. Despite yesterday’s pullback, buyers defended key demand levels, showing that bullish momentum is still alive as we approach the weekend session.
📊 Technical Outlook (H1)
Price is currently moving inside a symmetrical triangle, with volatility compressing and liquidity building on both sides.
Key observations from MMFlow structure:
• Zone 1 – Support (Potential Reversal Area)
4,174 – 4,159
→ Strong confluence of trendline support + Fibonacci 38.2% + liquidity sweep potential.
→ If price taps this zone, it's a high-probability long setup.
• Zone 2 – Resistance / Breakout Line
4,207 – 4,212
→ This is the key breakout ceiling.
→ A clean break and retest opens the door toward the next expansion wave.
• Measured Move Target (MMF Expansion Target)
4,244 – 4,252
→ Aligns with Fib 1.618 extension and previous liquidity pocket.
🎯 Trading Scenarios (MMFlow Style)
🟢 BUY Scenario (Primary Bias)
Buy Zone 1: 4,174 – 4,159
SL: below 4,150
TP: 4,205 → 4,212 → 4,228 → 4,244+
Why?
This zone carries the strongest confluence for a bullish reaction before the breakout. Ideal spot for Market Makers to reload.
🔵 BUY Scenario 2 (Break & Retest)
Trigger: Break above 4,207 – 4,212
Entry: Retest of 4,207
SL: below retest wick
TP: 4,228 → 4,244 → 4,252
Why?
Breakout from triangle compression usually leads to fast displacement toward untested liquidity highs.
🔴 SELL Scenario (Short-Term Only — Not Preferred)
Only valid if price fails to break 4,207 and forms a clear rejection.
Entry: 4,207 – 4,212
SL: above 4,220
TP: 4,174 → 4,159
Note: This is a counter-trend micro-play. Primary bias remains bullish.
🧠 MMFlow Insight
The market has been accumulating for multiple sessions, and every dip into demand is being bought aggressively. As long as price stays above 4,159, the bullish structure is intact. A breakout above 4,212 could be the ignition point for the next impulsive expansion toward 4,244 – 4,252.

Gold is expected to rise and then fall in the short term.After opening today, gold was pressured down by the 4110 area, finding support at around 4050 and rebounding. The 1-hour and 4-hour charts show severe oversold conditions, indicating a clear short-term stabilization. Therefore, overall, while maintaining a bearish outlook for gold, a short-term rebound is likely, with a high probability of further declines.
Key resistance remains at the 4110 area, followed by the 4140-50 area. A sustained bearish stance is warranted; an unexpected upward breakout could extend the rebound, but a decline is still expected. Key support during the European session is at the 4050 area, with the 4030-40 area being a short-term key level. A break below this level would likely lead to further declines towards the 3980-3950 and 3915 areas.
GOLD will rise after worries about financials reportsGold experienced two consecutive bearish sessions primarily due to the resolution of the government shutdown. This week, the main focus shifts to the upcoming financial reports and the extent to which the shutdown has affected the broader economy. Questions continue to arise regarding the previous month’s data and the possibility that some of those reports may never be released. A gap in financial reporting is never favorable, especially when paired with uncertainties surrounding this week’s releases—particularly those scheduled for Thursday.
From a technical perspective, GOLD has reached a strong support zone and shown a clear rejection. A retest of this rejection is expected before price advances toward the target zone, supported by the fundamental uncertainties anticipated in the coming days.

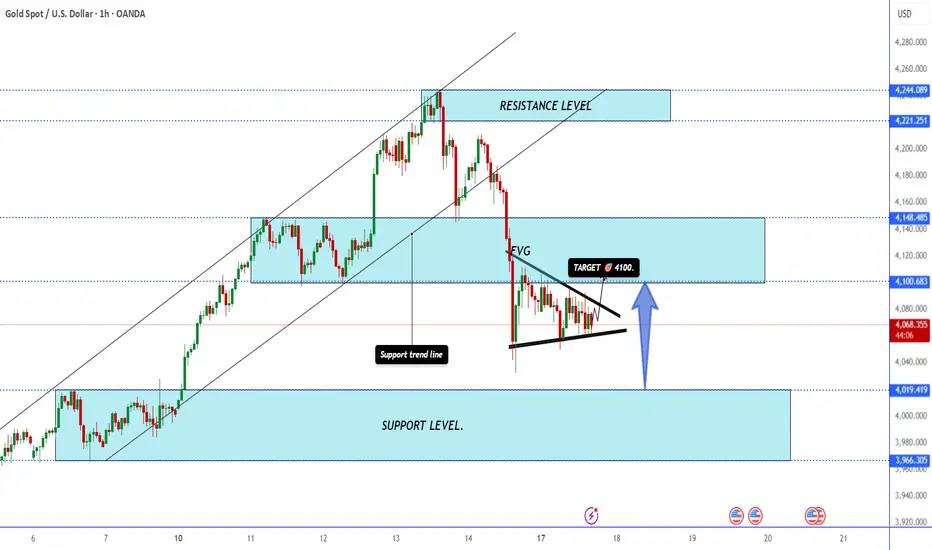
XAUUSD Retests Resistance — Pullback Toward $4,060 SupportHello traders! Let’s take a look at XAUUSD (Gold). After a prolonged bullish movement within a well-defined ascending channel, price reached a significant Resistance Level near $4,200, where sellers stepped in to regain control. This resistance coincides with the upper boundary of a descending resistance line, confirming its importance as a reaction area. Following this rejection, Gold experienced a sharp correction, forming a Range structure near the top before breaking below it — marking a shift in short-term sentiment. The breakout from this range confirmed the beginning of a downward phase, where price continued to move inside a new descending pattern. Currently, XAUUSD is testing the resistance line once again after a breakout retest from below. This area aligns with a former pivot zone where several reversals occurred in the past. The overall structure suggests that buyers are losing momentum, while sellers are preparing to defend this key zone. As long as price remains below the $4,160–$4,200 resistance, a corrective pullback toward the $4,060 Support Level (TP1) looks likely. This area also aligns with the ascending support line, which may act as the next major decision point. A clean break below $4,060 could extend the decline toward the $3,950–$3,970 zone, while a confirmed breakout above $4,200 would invalidate the short scenario and potentially trigger another bullish continuation phase. Please share this idea with your friends and click Boost 🚀

A GOLDEN STORM IS COMING!Hello my dear trader friends,
I’m back with the continuation of the XAU/USD analysis.
In the previous analysis, I mentioned that gold had reached a resistance zone and we expected a price correction. Gold reacted beautifully to the zone and entered a correction phase. Now we must see whether this correction will continue or not.
Next week, the U.S. government shutdown will end, and we also have the Federal Reserve meeting and the PMI report. So a stormy week is ahead of us — get ready for a volatile ride.
Our profit from this analysis: 1000 pips
Follow me to hear and see the rest of gold’s story.

GOLD H1 – Gold Awaits U.S. PPI Data for Directional Clarity🟡 XAUUSD – Intraday Smart Money Plan | by Ryan_TitanTrader (13/11)
📈 Market Context
Gold is consolidating after a strong impulsive leg, with intraday traders now focused on the upcoming U.S. Producer Price Index (PPI) release — a key inflation metric that often shapes Fed expectations.
• A hot PPI reading could strengthen the USD and trigger a sell-off from premium levels.
• A softer print may weaken the dollar, encouraging another liquidity grab above 4250.
Institutional order flow shows potential for engineered liquidity sweeps around both extremes before the next directional push.
🔎 Technical Analysis (1H / SMC Structure)
• Structure: Still bullish overall, but showing early distribution near the 4250 handle.
• Premium Zone: 4255–4253 aligns with an unmitigated supply and prior buy-side liquidity pool — a prime short setup if price reacts after a liquidity sweep.
• Discount Zone: 4168–4166 sits within the recent FVG and above EMA100 — a valid area for re-accumulation and continuation if price corrects deeper.
• Liquidity: Equal highs at 4255 and lows near 4156 signal potential stop-hunt traps before a decisive move.
🔴 Sell Setup (Premium Reaction Zone)
• Entry: 4,255 – 4,253
• Stop-Loss: 4,265
• Take-Profit Targets:
→ 4,182 (previous BOS zone)
→ 4,148 (mid-range equilibrium)
→ 4,110 (discount reaction zone)
📌 Valid only if price sweeps buy-side liquidity and confirms bearish BOS on M5–M15.
🟢 Buy Setup (Discount Reaction Zone)
• Entry: 4,166 – 4,168
• Stop-Loss: 4,156
• Take-Profit Targets:
→ 4,210 (short-term liquidity pocket)
→ 4,248 (imbalance fill zone)
→ 4,255 (final liquidity target)
📌 Valid only if price mitigates the FVG and reclaims structure with bullish BOS confirmation.
⚠️ Risk Management Notes
• Wait for PPI volatility before entering trades.
• Avoid trading mid-range (4180–4210) – low R/R zone.
• Scale out partials near liquidity points and trail stops post-confirmation.
• Maintain disciplined risk: 1–2% max per setup.
Summary
Gold is in pre-news equilibrium, with both buy- and sell-side liquidity pools clearly defined:
• Sell zone: 4255–4253 (premium reaction area)
• Buy zone: 4168–4166 (discount re-entry area)
Expect engineered liquidity grabs before a decisive move — patience and structure confirmation remain key.
📍Follow @Ryan_TitanTrader for real-time Smart Money updates ⚡

GOLD at Cut n Reverse Area? What's next??#GOLD... market just reached at today ultimate region.
That is around 4042-43 to 4050-52
Keep close and only slbuy above that region.
NOTE: we will go for cut n reverse below that region on confirmation .
Good luck
Trade wisely

Gold is heading to the supportGold had retraced from the local peak having been pushed down by the jittering markets across the board. The next possible support is located at around $4000 area - between 20 and 50 moving averages. Volume has been growing for GC futures, according to the CMEgroup’s statistics, so either bearish and bullish pullbacks might be volatile.
Absence of macro economic drives amid government shutdown creates uncertainty about inflation and other economic metrics in the US, so the asset is expected to trade technically staying within a trading range.
Don't forget - this is just the idea, always do your own research and never forget to manage your risk!

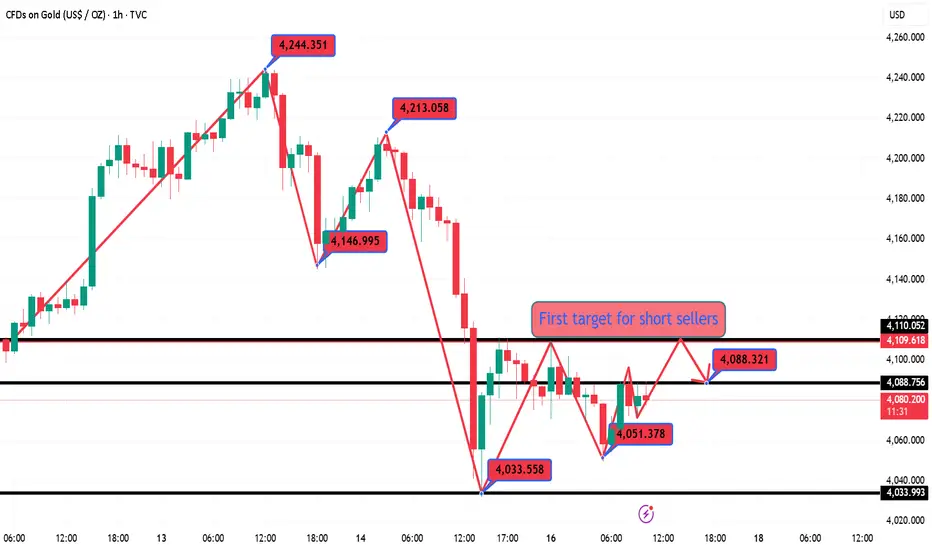
GOLD – Bearish Continuation SetupAfter our first successful sell, Gold is now repeating the exact same price action, forming another clear selloff structure from the upper trendline. The market rejected the resistance perfectly and is continuing lower, just as expected.
Our next target sits $270 below the current price, giving this setup massive potential.
The risk-to-reward ratio is outstanding, making this one of the cleanest opportunities on Gold lately.

GOLD DAILY CHART ROUTE MAPHey everyone,
Please review our Daily Chart Route Map, now featuring updated levels for tracking Golds movement.
We continue to track our refreshed proprietary Goldturn Channel, our unique method for constructing ascending channels. Price action is now testing the swing range and the swing range seems to be holding support as expected. This swing range support also falls inline with the channel half line providing stronger support.
As long as ema5 remains above the swing zone we expect price to play between this range until the full updated long term swing is completed into 4145. An ema5 break below the swing range will open the lower channel floor for test, currently sitting at 3824
As always, we will keep you all updated with regular updates throughout the week and how we manage the active ideas and setups. Thank you all for your likes, comments and follows, we really appreciate it!
Mr Gold
GoldViewFX
