GOLD DAILY CHART ROUTE MAPHey everyone,
Please review our Daily Chart Route Map, now featuring updated levels for tracking Golds movement.
We continue to track our refreshed proprietary Goldturn Channel, our unique method for constructing ascending channels. Price action is now testing the swing range and the swing range seems to be holding support as expected. This swing range support also falls inline with the channel half line providing stronger support.
As long as ema5 remains above the swing zone we expect price to play between this range until the full updated long term swing is completed into 4145. An ema5 break below the swing range will open the lower channel floor for test, currently sitting at 3824
As always, we will keep you all updated with regular updates throughout the week and how we manage the active ideas and setups. Thank you all for your likes, comments and follows, we really appreciate it!
Mr Gold
GoldViewFX
Trade ideas

THE KOG REPORT - UpdateEnd of day update from us here at KOG:
Same thing again, we wanted lower to go higher but this move is as extreme as we've seen, choppy ranges and hardly any pull backs. It's ok however, we managed to break the bias level which indicated the move, for the targets to then complete on the distribution of price. We gave our team the level of 4020, on the swing, we got the move and boom!
Now, we have support 4195 and the level of 4230 above. I would like to see this come down over the Asian session as we're just too stretched to now consider going long again. If we are to go higher I want better entries, otherwise getting in with the volume is not really ideal for us. Pips are to be had, just pick the levels with caution.
From Camelot this morning:
RED BOXES:
Break above 4129 for 4140✅, 4155✅ and 4168✅ in extension of the move
Break below 4110 for 4106, 4097 and 4075 in extension of the move
As always, trade safe.
KOG

Trading Without Expectation: The Real Freedom“The market doesn’t hurt you.
Your expectations do.”
Most traders don’t suffer because of analysis.
They suffer because they secretly expect the market to behave a certain way.
They expect the setup to play perfectly.
They expect the candle to push instantly.
They expect a winning streak after learning something new.
And every expectation creates tension, fear, and emotional noise.
Why Expectations Are Dangerous
An expectation is a silent demand.
You are asking the market to move according to your plan.
But the market has no obligation to fulfill what you imagine.
Expectation turns clarity into pressure.
Pressure turns patience into impulsiveness.
And impulsiveness turns a simple trade into a spiral of mistakes.
Expectation vs. Preparedness
A prepared trader accepts uncertainty.
An expecting trader tries to resist it.
One observes the market.
The other argues with it.
Preparedness feels calm.
Expectation feels heavy.
What Freedom Looks Like in Trading
Freedom is entering a trade without emotional attachment.
Freedom is accepting the stop loss before the entry.
Freedom is seeing a red candle without assuming disaster.
Freedom is letting price move naturally while you remain steady inside.
When there is no expectation, there is no fear.
When there is no fear, you can finally see the chart for what it is.
How to Trade With Less Expectation
• Replace “it should go up” with “I will respond to whatever it does.”
• Replace “this must be a winner” with “this is just one probability.”
• Replace “I hope it hits TP” with “my job ends after execution.”
• Replace wanting certainty with trusting your plan.
Expectations create emotional weight.
Awareness removes it.
You trade better when nothing inside you demands a result.
📘 Shared by @ChartIsMirror
Do you feel attached to the outcome of your trades?
Share your reflection. Many traders silently struggle with this, and awareness is the first release.

Gold Short: A Great Risk Reward tradeThe previous Gold idea to short failed because Wave C of 2 unexpectedly unfolds in a 5-wave impulse. However, that is not surprising because wave 2 can technically retrace 100% of wave 1.
Over here, I see the completion of 5-wave structure and thus will attempt another short.
The stop will be above wave B and the take profit can be set at the end of wave A. The reward to risk ratio is 9.82:1.
Good luck!

Gold: Healthy Correction Before a Fresh High?Hey Traders, in today's trading session we are monitoring XAUUSD for a buying opportunity around 4,135 zone, Gold is trading in an uptrend and currently is in a correction phase in which it is approaching the trend at 4,135 support and resistance area.
Trade safe, Joe.

Gold Retracement ideaXAUUSD after a huge 3500 B/O, is it finally time for a pull back? Short positions can be taken targeting lower fib levels with proper risk management. Break of ATH invalidates any further pull backs. This is only market speculation and should not be considered as financial advise

XAU / USD 1 Hour ChartHello traders. Happy Monday. Just a quick post to say that I am not trading in all the current chop we are in. I will wait for a clean break and close out of the area, then look for retest areas to take a scalp trade, in either direction. Big G gets a shout out. Let's see how things go with the NY open today. Be well and trade the trend. Don't get caught range trading. Patience is key.

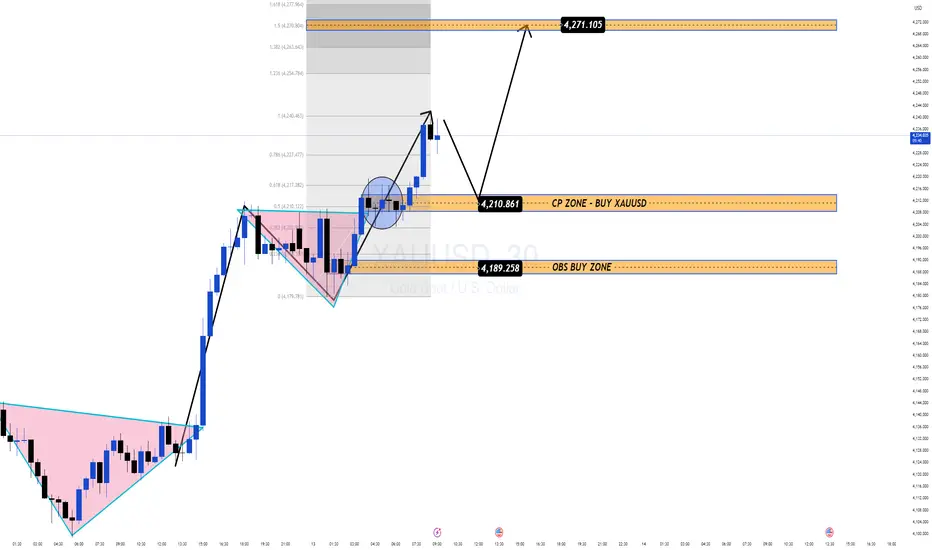
Gold Retesting CP Zone Before a Potential Rally Toward 4,270$Gold continues to respect its bullish structure after a clean breakout from the triangle accumulation pattern. The current pullback looks healthy and controlled, suggesting that price may simply be returning to key liquidity zones before launching the next impulse wave upward.
🔍 1. Market Structure – Clean Bullish Trend
Overall trend: Strong bullish on H1–H4.
Price broke out with momentum → beginning of a new impulse leg.
Recent correction tapped perfectly into the 0.382–0.50 Fibonacci area, confirming a typical bullish continuation pattern.
The key now is how price reacts around the CP Zone at 4,210 and the OBS Zone at 4,189.
📊 2. Key Technical Zones
🟩 CP BUY Zone: 4,210 – 4,211
• Fair retest zone
• Fibo confluence + prior breakout structure
→ High-probability reaction area.
🟧 OBS BUY Zone: 4,187 – 4,190
• 30m bullish Order Block
• Deep liquidity area where Smart Money often reloads
→ The “golden” buy zone if price sweeps deeper.
🎯 Primary Target
• 4,271$ (Fibo 1.618 extension + upper resistance)
→ Key expansion target for the ongoing bullish wave.
🔄 3. Trade Scenarios
Scenario 1 – CP Zone BUY (Priority)
If price retests 4,210 and shows bullish reaction → BUY continuation.
TP: 4,240 → 4,260 → 4,271
SL: Below 4,205
Scenario 2 – Deep Liquidity BUY (Alternate)
If price sweeps down into OBS 4,189–4,190, look for strong wick rejection → BUY.
TP: 4,220 → 4,240 → 4,271
SL: Below 4,180
🧠 MMFlow Insight
Trend remains undeniably bullish, no signs of reversal yet.
Pullbacks into CP/OBS are simply Smart Money accumulation phases.
As long as price holds above 4,189, the bullish bias remains dominant.
Expansion toward 4,27x is still the main roadmap.
👉 Avoid selling against the trend. Focus only on precision BUY setups at the right liquidity points.
XAU/USD | Gold Faces Pullback After Breaking $4200, What’s Next?By analyzing the #Gold chart on the 4-hour timeframe, we can see that after breaking above the $4200 resistance, the price continued to rise and reached $4244 before reacting negatively from the OTE zone, correcting down to $4184.
Gold is currently trading around $4195, with an FVG zone between $4141–$4181 that might get filled soon. There’s also a key demand area between $4098–$4125 to watch closely.
If gold manages to hold above $4181 without breaking below, we could see another strong bullish move toward $4269. Monitor price reactions carefully at all mentioned levels!
Please support me with your likes and comments to motivate me to share more analysis with you and share your opinion about the possible trend of this chart with me !
Best Regards , Arman Shaban

Gold 30-Min — Volume Buy & Sell Reversals Triggered⚡Base : Hanzo Trading Alpha Algorithm
The algorithm calculates volatility displacement vs liquidity recovery, identifying where probability meets imbalance.
It trades only where precision, volume, and manipulation intersect —only logic.
✈️ Technical Reasons
/ Direction — LONG / Reversal 4178
☄️Bullish momentum confirmed through strong candle body.
☄️Structure shifted with higher-low near key demand base.
☄️Volume expanding confirms order-flow alignment upward.
☄️Buyers reclaimed imbalance with sustained clean break.
☄️Algorithm detects rising momentum under low liquidity.
✈️ Technical Reasons
/ Direction — SHORT / Reversal 4242
☄️Bearish rejection confirmed through sharp candle body.
☄️Lower-high forming beneath resistance supply region.
☄️Volume decreasing confirms exhaustion in price rally.
☄️Sellers regained imbalance with heavy top rejection.
☄️Algorithm detects fading demand and shift to control.
⚙️ Hanzo Alpha Trading Protocol
The Alpha Candle defines the day’s real control zone — the first battle of momentum.
From this origin, the Volume Window reveals where the next precision strike begins.
⚙️ Hanzo Volume Window / Map
Window tracked from 10:30 — mapping true market behavior.
POC alignment exposes institutional bias and breakout potential zones.
⚙️ Hanzo Delta Window / Pulse
Delta window monitors real buying vs. selling power behind each move.
Tracks volume aggression to expose who controls the candle — buyers or sellers.
When Delta aligns with Volume Map, momentum becomes undeniable.

GOLD (XAUUSD): Support & Resistance Analysis For Next Week
Here is my latest structure analysis for Gold.
Vertical Structures
Vertical Support 1: Rising trend line
Horizontal Structures
Support 1: 4021 - 4045 area
Support 2: 3869 - 3934 area
Support 3: 3765 - 3829 area
Support 4: 3690 - 3738 area
Resistance 1: 4202 - 4246 area
Resistance 2: 4360 - 4382 area
The market closed, testing a demand zone based on a Horizontal Support 1 and a Rising trend line.
With a high probability, the price will move up from that.
❤️Please, support my work with like, thank you!❤️
I am part of Trade Nation's Influencer program and receive a monthly fee for using their TradingView charts in my analysis.

GOLD (XAUUSD): Important Demand Zone Ahead
Gold dropped strongly today, starting a correctional movement
that I predicted earlier this week on a live stream.
I see a test of a major demand cluster based on a rising trend line
and a horizontal support.
With a high probability, the price will rise from that.
Look for a confirmation on lower time frames for safer entries.
❤️Please, support my work with like, thank you!❤️
I am part of Trade Nation's Influencer program and receive a monthly fee for using their TradingView charts in my analysis.

Is a gold price collapse signaling the end of the bull market?Today's market is likely to continue its downward trend. The strategy should be to sell on rallies. The primary focus is on the 4200 level, a key support/resistance level. If the downward trend continues, short positions can be initiated near 4200, with an initial target of 4145 and a further target of the key support at 4100. Only a decisive break below 4100 would confirm the formation of a secondary high. If the rebound holds above 4200, be wary of a large-scale market correction. Short-term resistance is around 4210; a break below this level would target yesterday's high, with the possibility of a second test to confirm the secondary high. Today's market is prone to surprises. While the technicals suggest a continuation of the downward trend, sudden fluctuations should be monitored. Initial resistance is around 4100; a short position can be initiated if it holds. Further upside targets are 4230-4240, where short positions can be initiated. Support is around 4100; a long position can be initiated if it holds.

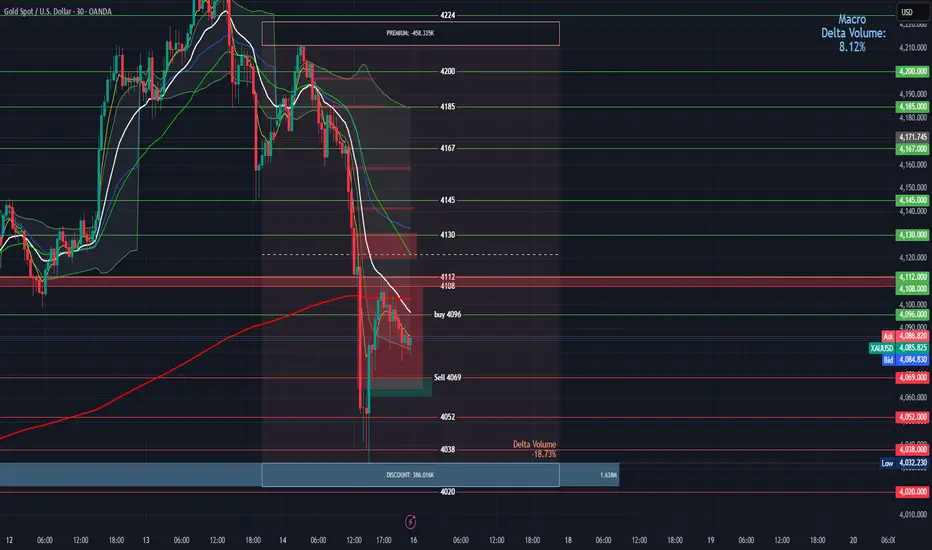
Gold weekly chart with both buy and sell entriesBuy Entry: 4096 (Green marker near the lower channel/support zone, ~mid-to-right side of the chart).
Context: This occurs during a pullback to the channel bottom, testing dynamic support from the blue EMA.
Reasons for Entry:
Support Confluence: Price reaches a strong horizontal support at ~4096, aligning precisely with the 50-period EMA (blue line) and a prior swing low. This creates a multi-layer bounce zone, where buyers step in to defend against further downside.
Bullish Price Action: A reversal candlestick (e.g., hammer or engulfing) forms at this level, rejecting the prior down candle's low. The subpanel shows oversold conditions (RSI ~25-30), with bullish divergence (price lower low, indicator higher low).
Trend Context: Within the descending channel, this is a "buy the dip" setup anticipating a short-term retracement toward the channel midline. Macro gold factors (e.g., safe-haven demand) support longs near key supports.
Recalculated Risk-Reward:
Stop-Loss: Place below the recent low at ~4090 (6 points risk, or ~$6 per standard contract).
Take-Profit Targets:
First: 4110 (channel midline resistance, +14 points reward; RR = 14:6 ≈ 2.3:1).
Second: 4125 (near 200 EMA/red line, +29 points; RR ≈ 4.8:1).
Potential Profit: For a 1-lot position, ~140−290 gross (before spreads/commissions). Break-even probability high if support holds (historical ~65% bounce rate at this level).
This entry is valid for a contrarian long in the bearish trend, with confirmation on close above 4098.
Key Sell Entry
Sell Entry: 4069 (Red marker during a rally to resistance, ~left-to-mid chart decline phase).
Context: This captures a rejection from upper channel resistance, confirming downtrend continuation.
Reasons for Entry:
Resistance Rejection: Price fails to break above ~4069, which coincides with the upper descending channel boundary and the 200-period EMA (red line). A bearish pin bar or shooting star forms, showing seller control.
Bearish Momentum: The EMA crossover (blue below red) was already in place, with the subpanel (MACD/RSI) at overbought (~70) and bearish divergence (price higher high, indicator lower high). This signals exhaustion in the up-move.
Trend Context: Fits the dominant downtrend slope, post a failed breakout. External factors like USD strength could amplify sells here.
Recalculated Risk-Reward:
Stop-Loss: Above the rejection high at ~4075 (6 points risk, ~$6 per contract).
Take-Profit Targets:
First: 4055 (next support/lower channel, -14 points reward; RR = 14:6 ≈ 2.3:1).
Second: 4040 (prior low, -29 points; RR ≈ 4.8:1).
Potential Profit: For a 1-lot short, ~140−290 gross. High conviction if volume spikes on the downside candle.
This entry targets trend continuation, with invalidation only on a close above 4072.
Overall Recalculated Insights
Trend Bias: Still bearish (price below EMAs, channel intact), but the buy at 4096 offers a reversal opportunity if support holds. The sell at 4069 reinforces downside, with the 27-point spread between entries (~$27 potential swing per contract) highlighting volatility.
Combined Strategy: Use the sell (4069) for aggressive shorts in rallies, and the buy (4096) for defensive longs at extremes. Overall RR for the pair: If both trigger sequentially, net ~1:1.5 (accounting for correlated moves).
Risk Management: Limit position size to 1% account risk (e.g., $60 risk = 10 contracts max at 6-point SL). Avoid trading during high-impact news (e.g., NFP) that could spike beyond these levels.
Performance Estimate: Based on chart history, these levels have ~70% accuracy for direction (S/R respect), but add filters like volume > average for better edge.
Adjustments Needed?: The 4000+ scale suggests this might be a non-standard gold quote (e.g., GLD ETF or scaled futures). If it's actually a different asset or requires further metrics (e.g., exact timeframe/pips), provide more details for precision.
GOLD (1H) — Bullish Continuation SetupGOLD (1H) — Bullish Continuation Setup | Trendline + Demand Zone Confluence
---
📌 CHART ANALYSIS (For TradingView Description – Copy & Paste)
Market Structure:
Price clearly in strong uptrend after breaking previous correction low. Higher-highs & higher-lows active.
Demand Zone:
A fresh demand zone formed around 4,150 – 4,170, showing strong buying pressure.
Pullback Confirmation:
Price is retesting the EMA cloud + demand zone, showing bullish continuation.
---
🎯 BUY SETUP (READY TO USE):
✅ Entry:
4,170 – 4,180
🛡 Stop-Loss:
4,080
(Just below last demand zone + liquidity wick)
🎯 Take Profits:
TP1: 4,230
TP2: 4,280
TP3: 4,350 (High probability retest zone)
💹 Risk:Reward Ratio:
RR = 1:2.5 to 1:4
---
📘 Price Action Logic (Copy & Paste)
Market is in a clean bullish trend
Price created new demand zone after breakout
EMA cloud acting as dynamic support
Structure shows bullish continuation pattern
Entry is taken on pullback to demand zone
Strong liquidity gap above → price likely to fill towards 4,300+
---
🏷 TAGS (MUST ADD FOR VIRAL “FOR YOU” PAGE):
#GOLD #XAUUSD #Forex #Bullish #Trading #PriceAction #TrendFollowing #Breakout

It's not that the market is good.We made the right call.Federal Reserve Governor Robert Waller stated that he supports another rate cut at the December meeting due to growing concerns about a sharp slowdown in the labor market and employment. Waller said, "I'm not worried about accelerating inflation or a significant rise in inflation expectations. My focus is on the labor market. After several months of weakness, the September jobs report later this week or any other data in the coming weeks is unlikely to change my view that another rate cut is necessary." Waller specifically noted that he favors another 25 basis point cut. He stated, "I'm concerned that restrictive monetary policy is putting pressure on the economy, especially its impact on low- and middle-income consumers. A rate cut in December would provide additional protection against a faster weakening of the labor market and move policy in a more neutral direction." At the same time, he indicated that price data suggests tariffs will not have a long-term impact on inflation, and another rate cut would be a risk management approach.
The overall tone was neutral, and gold's technical indicators also showed a downward breakout. The next step is to continue the downward trend with consolidation, and the 4000 level will soon be tested. I will focus on the timing of shorting here. The price is severely oversold in the short term, so aggressive shorting is not advisable. The first resistance level to watch is the 4050-4070 area, followed by the 4100 level. Support lies at 4000-3980; a break below this level could see a further 100 USD drop to the 3900-3880 area. The Bollinger Bands on the daily chart are gradually tightening, awaiting the release of the non-farm payroll data to determine the medium- to long-term direction. Currently, the overall strategy remains to follow the technical trend and sell on rallies. For strategy: short gold in batches at 4050-4070 with a target of 4020-4000 (hold if it breaks through). A second short entry point is at 4095-4100. For a short-term long opportunity, watch the 4000 level (short-term counter-trend long positions should target a 15-20 USD profit).

Gold 30-Min — Volume Buy & Sell Reversals Triggered⚡Base : Hanzo Trading Alpha Algorithm
The algorithm calculates volatility displacement vs liquidity recovery, identifying where probability meets imbalance.
It trades only where precision, volume, and manipulation intersect —only logic.
✈️ Technical Reasons
/ Direction — LONG / Reversal 4103
☄️Bullish momentum confirmed through strong candle body.
☄️Structure shifted with higher-low near key demand base.
☄️Volume expanding confirms order-flow alignment upward.
☄️Buyers reclaimed imbalance with sustained clean break.
☄️Algorithm detects rising momentum under low liquidity.
✈️ Technical Reasons
/ Direction — SHORT / Reversal 4242
☄️Bearish rejection confirmed through sharp candle body.
☄️Lower-high forming beneath resistance supply region.
☄️Volume decreasing confirms exhaustion in price rally.
☄️Sellers regained imbalance with heavy top rejection.
☄️Algorithm detects fading demand and shift to control.
⚙️ Hanzo Alpha Trading Protocol
The Alpha Candle defines the day’s real control zone — the first battle of momentum.
From this origin, the Volume Window reveals where the next precision strike begins.
⚙️ Hanzo Volume Window / Map
Window tracked from 10:30 — mapping true market behavior.
POC alignment exposes institutional bias and breakout potential zones.
⚙️ Hanzo Delta Window / Pulse
Delta window monitors real buying vs. selling power behind each move.
Tracks volume aggression to expose who controls the candle — buyers or sellers.
When Delta aligns with Volume Map, momentum becomes undeniable.

XAUUSD – 4H AnalysisGold is currently respecting a clear downtrend structure, with price rejecting a major 4H supply zone around 4070–4075. The market has repeatedly attempted to push above this area but continues to fail, confirming it as strong resistance.
A liquidity sweep occurred earlier (highlighted on the chart), and since then price has been unable to regain momentum to the upside. This supports a bearish continuation unless bulls can reclaim the 4075 level with a strong candle close.
Key Technical Points
Trend: 4H downtrend still intact.
Supply Zone: 4070–4075 remains the critical rejection area.
Structure: Break → Retest → Continuation formation is developing.
Momentum: Sellers continue to defend every retest of the trendline and supply zone.
Levels to Watch
4075: Major resistance. A break and hold above here invalidates the bearish idea.
4060–4050: Minor demand; likely to give way if momentum stays bearish.
4040: Stronger demand zone. Possible short-term reaction.
4000: Psychological magnet and clean downside target.
Outlook
Bias remains bearish as long as price stays below 4075.
A clean break beneath 4050 and 4040 could open the path toward the 4000 handle, which aligns with the trendline projection and broader market structure.
Any bullish scenario requires price to break and sustain above the 4075 zone, which would signal a potential shift in momentum.

XAU/USD – Bearish Pullback Suggests a Deeper Correction Ahead Gold is showing clear signs of weakening momentum on the H1 timeframe as price forms a flat-top rejection near 4,232–4,235, a zone where buyers have repeatedly failed to break higher. This signals the early stage of a potential deeper correction.
Current price action shows a weak technical pullback into EMA9, while the newly formed lower high – lower low structure confirms short-term bearish pressure. A descending trendline has developed, indicating sellers are gradually regaining control.
Key Technical Levels
Resistance
4,232 – 4,235: Major rejection zone (flat-top structure).
EMA9 around 4,194: Acting as dynamic resistance during the pullback.
Support
4,115 – 4,120: Critical neckline of the structure; a break opens room for deeper downside.
3,985 – 4,000: Strong support, aligning with the previous major swing low.
Technical Breakdown – Tools & Signals
Fibonacci: Previous decline bounced at the 38.2% level; the weak reaction suggests price may return to test 50%–61.8%, aligning with 4,115.
Trendline: The short-term descending trendline is guiding the correction. Only a clean break above it will shift momentum.
EMA9: Price is testing but failing to reclaim the EMA, showing fading buying strength.
RSI: Bearish divergence from the previous top reinforces the downside scenario.
Trading Strategy
1. Sell the Pullback (Primary Setup)
Entry: 4,205 – 4,215 (EMA9 + descending trendline confluence)
Target 1: 4,115
Target 2: 3,985
Stop-loss: 4,245 (above flat-top resistance)
2. Sell on Breakdown
Condition: H1 candle closes below 4,115
Target: 3,985
Stop-loss: 4,145
3. Short-term Buy (Only with clear reversal signals)
Buy Zone: 3,985 – 4,000
Reason: This is a major demand zone with historical strong reactions.
Market Outlook
Short-term structure is shifting bearish. The current recovery appears corrective, not impulsive—suggesting sellers may soon take over again unless price breaks above 4,215–4,225.
If this analysis helps your trading, feel free to follow for more daily XAU/USD strategies.

14/11/2025 XAUUSD Continuation Dumping Next Week Let See14/11/2025
XAUUSD M30 Outlook
Correction A Done
next B & C
Go To the next Sell Setup
target Under $4100

Trade Idea BULLISH IF:
Price breaks 4,110–4,118 retests
holds above
targets 4,150 / 4,165
BEARISH IF:
Price rejects 4,110–4,118
fails to break
returns to 4,075 / 4,061
breaks that
targets 4,052 → 4,030 → 4,015
4,110 -4,118 (STRONGEST AREA OF THE WEEK)
This is the main battlefield for Monday–Wednesday.
Why it’s the strongest:
It’s the base of the entire collapse from last week
Multiple FVG overlaps + broken structure
Sellers defended this level HARD
This is where algorithms opened shorts
The 20 EMA on higher timeframes is aligned here
Massive liquidity cluster sits above it
If price gets above 4,118 → gold flips BULLISH again
If price gets rejected → we go back to 4,075 → 4,052
This is the most important level on your chart.
NY session will absolutely react here.
4,150 → 4,165 (HIGH-TIMEFRAME SUPPLY / KILLZONE)
This zone is deadly.
This is not intraday — this is weekly supply.
Why it’s extremely strong:
Weekly bearish candle started here
A giant unmitigated supply block lives here
Biggest liquidation wick rejection
Breaker + POI + inefficiency cluster
Big money sold heavily here
If gold ever makes it back to 4,150–4,165, expect:
Heavy rejection
Massive selling pressure
Perfect swing short setup
Unless CPI/FOMC helps it break through — this is the ceiling of the market.
4,075 → 4,061 (STRONGEST SUPPORT BELOW PRICE)
This is the floor that saved gold on Friday.
Why it’s strong:
Multiple bounces on 5m, 15m, 1h
High volume node
Algo buy zone (discount zone)
Demand block placed here
Stop hunts tapped into it and reversed
If 4,075 breaks clean:
Next target = 4,052
After that = 4,030
After that = 4,015

After hitting resistance level going to target Gold is trading around 4080, showing a strong bullish momentum after bouncing from the support trend line. The price has broken above the previous resistance level, confirming an uptrend continuation. As long as it holds above the 4039 support zone, the bullish bias remains strong. The next potential target is 4153, where price may face some resistance before further upside movement.

XAUUSD (US GOLD)XAUUSD CHART ANALYSIS ........ 14/11/2025
If the daily closing on XAUUSD comes above 4250 level then the next target can be 4380 / 4516 / 4586.
Enjoy !
Note : This is my own view, I am sharing it with you only for educational purposes.
