GOLD (XAUUSD): Support & Resistance Analysis For Next Week
Here is my latest structure analysis for Gold.
Vertical Structures
Vertical Support 1: Rising trend line
Horizontal Structures
Support 1: 4021 - 4045 area
Support 2: 3869 - 3934 area
Support 3: 3765 - 3829 area
Support 4: 3690 - 3738 area
Resistance 1: 4202 - 4246 area
Resistance 2: 4360 - 4382 area
The market closed, testing a demand zone based on a Horizontal Support 1 and a Rising trend line.
With a high probability, the price will move up from that.
❤️Please, support my work with like, thank you!❤️
I am part of Trade Nation's Influencer program and receive a monthly fee for using their TradingView charts in my analysis.
Trade ideas

XAU/USD – Bearish Pullback Suggests a Deeper Correction Ahead Gold is showing clear signs of weakening momentum on the H1 timeframe as price forms a flat-top rejection near 4,232–4,235, a zone where buyers have repeatedly failed to break higher. This signals the early stage of a potential deeper correction.
Current price action shows a weak technical pullback into EMA9, while the newly formed lower high – lower low structure confirms short-term bearish pressure. A descending trendline has developed, indicating sellers are gradually regaining control.
Key Technical Levels
Resistance
4,232 – 4,235: Major rejection zone (flat-top structure).
EMA9 around 4,194: Acting as dynamic resistance during the pullback.
Support
4,115 – 4,120: Critical neckline of the structure; a break opens room for deeper downside.
3,985 – 4,000: Strong support, aligning with the previous major swing low.
Technical Breakdown – Tools & Signals
Fibonacci: Previous decline bounced at the 38.2% level; the weak reaction suggests price may return to test 50%–61.8%, aligning with 4,115.
Trendline: The short-term descending trendline is guiding the correction. Only a clean break above it will shift momentum.
EMA9: Price is testing but failing to reclaim the EMA, showing fading buying strength.
RSI: Bearish divergence from the previous top reinforces the downside scenario.
Trading Strategy
1. Sell the Pullback (Primary Setup)
Entry: 4,205 – 4,215 (EMA9 + descending trendline confluence)
Target 1: 4,115
Target 2: 3,985
Stop-loss: 4,245 (above flat-top resistance)
2. Sell on Breakdown
Condition: H1 candle closes below 4,115
Target: 3,985
Stop-loss: 4,145
3. Short-term Buy (Only with clear reversal signals)
Buy Zone: 3,985 – 4,000
Reason: This is a major demand zone with historical strong reactions.
Market Outlook
Short-term structure is shifting bearish. The current recovery appears corrective, not impulsive—suggesting sellers may soon take over again unless price breaks above 4,215–4,225.
If this analysis helps your trading, feel free to follow for more daily XAU/USD strategies.

GOLD H1 – Gold Awaits U.S. PPI Data for Directional Clarity🟡 XAUUSD – Intraday Smart Money Plan | by Ryan_TitanTrader (13/11)
📈 Market Context
Gold is consolidating after a strong impulsive leg, with intraday traders now focused on the upcoming U.S. Producer Price Index (PPI) release — a key inflation metric that often shapes Fed expectations.
• A hot PPI reading could strengthen the USD and trigger a sell-off from premium levels.
• A softer print may weaken the dollar, encouraging another liquidity grab above 4250.
Institutional order flow shows potential for engineered liquidity sweeps around both extremes before the next directional push.
🔎 Technical Analysis (1H / SMC Structure)
• Structure: Still bullish overall, but showing early distribution near the 4250 handle.
• Premium Zone: 4255–4253 aligns with an unmitigated supply and prior buy-side liquidity pool — a prime short setup if price reacts after a liquidity sweep.
• Discount Zone: 4168–4166 sits within the recent FVG and above EMA100 — a valid area for re-accumulation and continuation if price corrects deeper.
• Liquidity: Equal highs at 4255 and lows near 4156 signal potential stop-hunt traps before a decisive move.
🔴 Sell Setup (Premium Reaction Zone)
• Entry: 4,255 – 4,253
• Stop-Loss: 4,265
• Take-Profit Targets:
→ 4,182 (previous BOS zone)
→ 4,148 (mid-range equilibrium)
→ 4,110 (discount reaction zone)
📌 Valid only if price sweeps buy-side liquidity and confirms bearish BOS on M5–M15.
🟢 Buy Setup (Discount Reaction Zone)
• Entry: 4,166 – 4,168
• Stop-Loss: 4,156
• Take-Profit Targets:
→ 4,210 (short-term liquidity pocket)
→ 4,248 (imbalance fill zone)
→ 4,255 (final liquidity target)
📌 Valid only if price mitigates the FVG and reclaims structure with bullish BOS confirmation.
⚠️ Risk Management Notes
• Wait for PPI volatility before entering trades.
• Avoid trading mid-range (4180–4210) – low R/R zone.
• Scale out partials near liquidity points and trail stops post-confirmation.
• Maintain disciplined risk: 1–2% max per setup.
Summary
Gold is in pre-news equilibrium, with both buy- and sell-side liquidity pools clearly defined:
• Sell zone: 4255–4253 (premium reaction area)
• Buy zone: 4168–4166 (discount re-entry area)
Expect engineered liquidity grabs before a decisive move — patience and structure confirmation remain key.
📍Follow @Ryan_TitanTrader for real-time Smart Money updates ⚡

14/11/2025 XAUUSD Continuation Dumping Next Week Let See14/11/2025
XAUUSD M30 Outlook
Correction A Done
next B & C
Go To the next Sell Setup
target Under $4100

XAUUSD LongBuy @ 3980
TP 4036
I'm not a story teller, neither i trade on news.
The only story what u should be reading is the chart itself

XAUUSD – 4H AnalysisGold is currently respecting a clear downtrend structure, with price rejecting a major 4H supply zone around 4070–4075. The market has repeatedly attempted to push above this area but continues to fail, confirming it as strong resistance.
A liquidity sweep occurred earlier (highlighted on the chart), and since then price has been unable to regain momentum to the upside. This supports a bearish continuation unless bulls can reclaim the 4075 level with a strong candle close.
Key Technical Points
Trend: 4H downtrend still intact.
Supply Zone: 4070–4075 remains the critical rejection area.
Structure: Break → Retest → Continuation formation is developing.
Momentum: Sellers continue to defend every retest of the trendline and supply zone.
Levels to Watch
4075: Major resistance. A break and hold above here invalidates the bearish idea.
4060–4050: Minor demand; likely to give way if momentum stays bearish.
4040: Stronger demand zone. Possible short-term reaction.
4000: Psychological magnet and clean downside target.
Outlook
Bias remains bearish as long as price stays below 4075.
A clean break beneath 4050 and 4040 could open the path toward the 4000 handle, which aligns with the trendline projection and broader market structure.
Any bullish scenario requires price to break and sustain above the 4075 zone, which would signal a potential shift in momentum.

Trade Idea BULLISH IF:
Price breaks 4,110–4,118 retests
holds above
targets 4,150 / 4,165
BEARISH IF:
Price rejects 4,110–4,118
fails to break
returns to 4,075 / 4,061
breaks that
targets 4,052 → 4,030 → 4,015
4,110 -4,118 (STRONGEST AREA OF THE WEEK)
This is the main battlefield for Monday–Wednesday.
Why it’s the strongest:
It’s the base of the entire collapse from last week
Multiple FVG overlaps + broken structure
Sellers defended this level HARD
This is where algorithms opened shorts
The 20 EMA on higher timeframes is aligned here
Massive liquidity cluster sits above it
If price gets above 4,118 → gold flips BULLISH again
If price gets rejected → we go back to 4,075 → 4,052
This is the most important level on your chart.
NY session will absolutely react here.
4,150 → 4,165 (HIGH-TIMEFRAME SUPPLY / KILLZONE)
This zone is deadly.
This is not intraday — this is weekly supply.
Why it’s extremely strong:
Weekly bearish candle started here
A giant unmitigated supply block lives here
Biggest liquidation wick rejection
Breaker + POI + inefficiency cluster
Big money sold heavily here
If gold ever makes it back to 4,150–4,165, expect:
Heavy rejection
Massive selling pressure
Perfect swing short setup
Unless CPI/FOMC helps it break through — this is the ceiling of the market.
4,075 → 4,061 (STRONGEST SUPPORT BELOW PRICE)
This is the floor that saved gold on Friday.
Why it’s strong:
Multiple bounces on 5m, 15m, 1h
High volume node
Algo buy zone (discount zone)
Demand block placed here
Stop hunts tapped into it and reversed
If 4,075 breaks clean:
Next target = 4,052
After that = 4,030
After that = 4,015

XAUUSD: Market Analysis and Strategy for November 17thGold Technical Analysis:
Daily Resistance: 4250, Support: 4000
4-Hour Resistance: 4145, Support: 4030
1-Hour Resistance: 4110, Support: 4050
The technical picture is largely in line with recent analysis expectations. The weekly chart shows a pullback after a rally, making short-term bullishness somewhat difficult. The daily candlestick pattern's "rounded bottom" support remains intact, and the Bollinger Bands are narrowing. Historically, the risk of a further decline after a technical correction remains relatively high. Those who have been following my recent articles know the important level of 4030. Investors need to be cautious around 4030; a break below this level could lead to a short-term move towards 3930. If the price rebounds and recovers 4130/4160 in the short term, a bullish outlook is warranted, with the 4220/4250 area as a potential resistance level.
Based on the 1-hour chart, gold is currently in a short-term tug-of-war between bulls and bears, with overall market sentiment remaining weak. Watch for support momentum from the MACD/KDJ indicators.
NY Market Trading Strategy:
BUY: 4050 near
BUY: 4040 near
SELL: 4106~4110
More Analysis →

XAUUSD (US GOLD)XAUUSD CHART ANALYSIS ........ 14/11/2025
If the daily closing on XAUUSD comes above 4250 level then the next target can be 4380 / 4516 / 4586.
Enjoy !
Note : This is my own view, I am sharing it with you only for educational purposes.

Gold: 4000 Support TestGold extended yesterday’s correction today, showing a significant decline amid oscillatory pressure, with some support found near the $4,000 mark. After surging to a high of $4,101.76 yesterday, gold plunged sharply, and this downward correction has continued to gather momentum on the 18th.
Previously, a head-and-shoulders top pattern formed on the 4-hour chart of gold, indicating an inherent technical correction demand. Furthermore, the pullback from yesterday’s high created a clear short-term bearish pressure signal, and today’s decline represents a further digestion of these negative technical cues.
Currently, the market is in the phase of testing support near $4,000.If this level is breached, it may trigger a further pullback to the short-term buffer support at $3,980, with the key strong support at $3,950 requiring close attention.
If gold can stabilize above $4,000, it will most likely enter a range-bound consolidation phase.
The primary resistance above lies at $4,100, a critical pressure level amid the recent correction. A breakout above this level will require a significant increase in trading volume, making it quite challenging in the short term.
Sell 4060 - 4050
SL 4070
TP 4000 - 3990 - 3980
Buy 4000 - 4010
SL 3990
TP 4040 - 4050 - 4060

XAUUSD started bull move on ending shutdown!with US G.shutdown ending GOLD dropped to weekly support int his long term uptrending market structure, with multiple liquidity sweep on this support, XAUUSD gain new momentum for new higher high?
As currently weekly price action is just potential beginnign of a new impulse after back to 3 weeks of pullback giving GOLD a very high probability of continue to rise up to current weekly high.
Running GOLD buy up 400 pip looking at closing 820 pip or beyond!

minor retracement inside the channel.Price is steadily moving within a clean bullish channel after sweeping earlier lows. The market is now reaching for buy-side liquidity resting inside the supply zone around 4211. Expecting a controlled pullback before the final expansion into the target zone.

GOLD ( XAUUSD ) Buying Trade idea From the Support LevelHello Traders
In This Chart GOLD HOURLY Forex Forecast By FOREX PLANET
today Gold analysis 👆
🟢This Chart includes_ (GOLD market update)
🟢What is The Next Opportunity on GOLD Market
🟢how to Enter to the Valid Entry With Assurance Profit
This CHART is For Trader's that Want to Improve Their Technical Analysis Skills and Their Trading By Understanding How To Analyze The Market Using Multiple Timeframes and Understanding The Bigger Picture on the Charts

XAUUSD AB=CDHello traders, hope you’re doing well this trading week and that you’re all catching some nice pips from the markets. Today I’m looking at Gold (XAUUSD, 1H) and we’ve got a clean bearish AB=CD symmetry setup on the chart, offering a potential short opportunity.
Price has completed the AB=CD leg into the PCZ, with point D landing right around the 0.786–1.000 AB zone (≈ 4,241–4,280). This is my Potential Completion Zone (PCZ) where I’m watching for signs of exhaustion and rejection.
Key Levels
PCZ (short idea zone): 4,241 – 4,280
TP1: 4,199 – 4,188 (first reaction target)
TP2: 4,174 – 4,156 (127–161.8% extension zone)
Invalidation: Clean break and hold above 4,280
Trading Plan
If I get bearish confirmation (wick rejections, bearish candle close, or breakdown from local structure), I’ll look for shorts from the PCZ, targeting TP1 first and then TP2 if momentum continues. A sustained move above 4,280 cancels the bearish idea and suggests standing aside or reassessing for a bullish continuation.
Manage risk carefully, keep size controlled, and let the AB=CD symmetry do the heavy lifting.

Gold 30-Min — Volume Buy & Sell Reversals Triggered⚡Base : Hanzo Trading Alpha Algorithm
The algorithm calculates volatility displacement vs liquidity recovery, identifying where probability meets imbalance.
It trades only where precision, volume, and manipulation intersect —only logic.
✈️ Technical Reasons
/ Direction — LONG / Reversal 4110 Area
☄️Bullish momentum confirmed through strong candle body.
☄️Structure shifted with higher-low near key demand base.
☄️Volume expanding confirms order-flow alignment upward.
☄️Buyers reclaimed imbalance with sustained clean break.
☄️Algorithm detects rising momentum under low liquidity.
✈️ Technical Reasons
/ Direction — SHORT / Reversal 4170 Area
☄️Bearish rejection confirmed through sharp candle body.
☄️Lower-high forming beneath resistance supply region.
☄️Volume decreasing confirms exhaustion in price rally.
☄️Sellers regained imbalance with heavy top rejection.
☄️Algorithm detects fading demand and shift to control.
⚙️ Hanzo Alpha Trading Protocol
The Alpha Candle defines the day’s real control zone — the first battle of momentum.
From this origin, the Volume Window reveals where the next precision strike begins.
⚙️ Hanzo Volume Window / Map
Window tracked from 10:30 — mapping true market behavior.
POC alignment exposes institutional bias and breakout potential zones.
⚙️ Hanzo Delta Window / Pulse
Delta window monitors real buying vs. selling power behind each move.
Tracks volume aggression to expose who controls the candle — buyers or sellers.
When Delta aligns with Volume Map, momentum becomes undeniable.

GOLD HTF — Is the Buying Climax reach and the BIG short coming??After a +53% yearly gain and a 10% September candle, we might finally be seeing the start of a two-month distribution phase, smart money taking profit before the end of the year and preparing for re-accumulation lower for next year.
Wyckoff View (Daily):
Possible Buying Climax (BC) followed by Automatic Reaction (AR) and Secondary Test (ST).
If confirmed, the markdown could target the $3,440 zone, where major resistance from earlier structure awaits a retest.
Until proven otherwise, the macro trend is still bullish, but momentum exhaustion and vertical price action often precede deeper retracements.
Trading Plan:
Stay small, stay precise. Scalping on M1–M5 to extract 50–100 pips per day is the play while the big money decides the next leg.
We don’t predict, we react.
Trade like the Casino, not the hopeful gambler.
Touch grass, protect peace, stay grateful.
Be safe, and God bless you all.

XAUUSD 4HGold is currently moving within a descending channel. Based on the current structure, a further decline toward the channel floor is expected. If the price reacts positively from the bottom, a bullish move at least toward the channel ceiling is likely. In case the price breaks above the channel and exits it, the next target will be the highlighted zone on the chart.

After hitting resistance level going to target Gold is trading around 4080, showing a strong bullish momentum after bouncing from the support trend line. The price has broken above the previous resistance level, confirming an uptrend continuation. As long as it holds above the 4039 support zone, the bullish bias remains strong. The next potential target is 4153, where price may face some resistance before further upside movement.

How to properly seize gold trading opportunities?Gold Technical Analysis: Reviewing yesterday's gold price performance, it showed a clear downward trend overall. Specifically, the gold price moved downwards along the five-day moving average. This trend often suggests a short-term weak market from a technical analysis perspective. During the US session, the gold price experienced a significant decline, which undoubtedly exacerbated the tense atmosphere in the market.
From the daily chart analysis, gold closed yesterday with a medium-sized bearish candlestick with upper and lower shadows. This candlestick pattern contains a wealth of market information. The presence of the upper and lower shadows indicates that both the bulls and bears exerted their strength briefly during the struggle, but ultimately the bears prevailed, pushing the price lower and closing with a bearish candlestick. This forms a "three-day losing streak" pattern on the daily chart, indicating a short-term weak trend. From a trend perspective, the bearish pattern in the gold market remains unchanged.
Based on the above technical analysis and market trends, we can make a reasonable prediction for the future price movement of gold. We expect the price to further test the support level of the daily chart's lower trendline. Therefore, our trading strategy for today remains unchanged: shorting on rallies. Specifically, we will focus on the 10-day moving average as our entry point for shorting. On the downside, we will first look at yesterday's low. If the price breaks below yesterday's low, we can expect it to fall further. Taking into account various factors, we have identified the following specific resistance and support levels. The resistance levels are 4050-4070 and 4100, respectively. These levels have historically exerted downward pressure on prices and are key resistance areas that we need to pay close attention to during trading. The support levels are 4005-3980 and 3930, respectively. These levels are crucial points where prices may find support and rebound. Regarding trading recommendations, we suggest entering short positions in the 4050-4070 range. It is important to note that the market is fraught with uncertainty and risk, and the above trading strategy is for reference only. When making investment decisions, investors should fully consider their own risk tolerance and investment goals, and make decisions prudently. We hope every investor can have good luck in the market and achieve their investment goals. In summary, today's gold trading strategy is to primarily sell on rallies and secondarily buy on dips. The key resistance level to watch in the short term is 4050-4070, and the key support level is 4005-3980. Please keep up with the pace.

Gold price corrected below 4100 according to the trendline✍️ NOVA hello everyone, Let's comment on gold price next week from 11/17/2025 - 11/21/2025
⭐️GOLDEN INFORMATION:
Gold (XAU/USD) slid nearly 2% on Friday but rebounded after hitting a daily low of $4,032, as rising expectations of a Fed pause followed hawkish remarks from policymakers. Despite the intraday recovery, the metal remains under $4,100, down 1.72%
⭐️Personal comments NOVA:
Gold price has a big correction below 4100, still maintained in the uptrend line H3, H4. Accumulating and recovering
🔥 Technically:
Based on the resistance and support areas of the gold price according to the H4 frame, NOVA identifies the important key areas as follows:
Resistance: $4149, $4247
Support: $4015, $3925
🔥 NOTE:
Note: Nova wishes traders to manage their capital well
- take the number of lots that match your capital
- Takeprofit equal to 4-6% of capital account
- Stoplose equal to 2-3% of capital account
- The winner is the one who sticks with the market the longest

GOLD Overall Structure (1D Timeframe)✅ 1. Overall Structure (1D Timeframe)
• A descending corrective channel (yellow lines)
• Major rejection at the channel top
• Price making lower highs (LH) → still bearish structure
• Price currently sitting below the mid-range of the channel
This means:
👉 Gold is still in a corrective downtrend, not bullish yet.
👉 High probability the market wants to fill lower OBs before any breakout.
________________________________________
✅ 2. Key Areas I Highlighted
🔷 1D TF FVG (4,107–4,150) – Major Resistance
• This zone is extremely important.
• Price has failed here multiple times already.
• As long as price is below this → bearish pressure continues.
This is the “breaker” level for bulls.
________________________________________
🔴 1D OB Zones Below (Demand Areas)
I mapped the OB zones correctly:
1️⃣ OB: 3,990 – 3,950
• First liquidity target
• Already almost tapped/mitigated
• Still valid for another reaction
2️⃣ OB: 3,929 – 3,885
• Stronger demand
• Highly likely to get tapped if the rejection continues
• My trendline bottom also aligns here → confluence
3️⃣ OB: 3,800 – 3,700
• If price breaks deeper into channel
• This is the next liquidity layer
These OBs line up perfectly with my descending channel.
________________________________________
Extreme Liquidity Below
I noted:
• 3100
• 3000
• 2600
These are macro liquidity harvest levels, NOT near-term.
Price falls here only if:
• Channel breaks down
• Major macro bearish shift occurs
→ Not likely in the next few weeks unless massive catalyst.
________________________________________
✅ 3. Updated Structural Reading (Using New Drawing)
A. Price recently failed to break the upper channel
This supports more downside.
B. I drew an ABC correction
The new chart also still shows:
• A → B → C decline likely forming
• Potential completion at the lower trendline
This supports a drop before any rally.
C. My white projection (V-shape recovery)
This large bullish projection is valid ONLY if:
• Price touches lower OB
➡️ 3,929 – 3,885
• And then breaks back above
➡️ 4,150
Only then the big bullish run can start.
________________________________________
📉 4. Most Likely Path (Updated With New Chart)
Based on my new structure:
Primary Scenario (70% probability)
Price drops to the lower OB:
→ 3,929 – 3,885
Possibly even wick into:
→ 3,800 – 3,700
Then:
Strong bounce → retest 1D FVG (4,107–4,150)
If rejection again → continuation inside channel.
________________________________________
Bullish Scenario (30% probability)
For my yellow arrow to be valid:
1. Price must touch the lower OB
2. Then form a strong reversal
3. Then break upward out of the descending channel
4. Then close above 4,150
5. Target becomes: 4,380 → 4,800
This matches my yellow long-term projection.
________________________________________
🎯 5. Key Levels to Watch (Updated)
Immediate Support
Level Significance
3,990 Weak OB – might not hold
3,950 First real support
3,929 – 3,885 🔥 Strong OB + channel bottom confluence
Immediate Resistance
Level Significance
4,107–4,150 🔷 Strong 1D FVG (must break for bulls)
4,200 Channel breakout level
4,380 First macro target
________________________________________
⭐ 6. Simple Final Summary (Very Clear)
My new chart indicates:
✔️ Market still bearish inside descending channel
✔️ Price likely drops to 3,929–3,885 OB
✔️ This is the best zone for bullish reversal
✔️ Bulls must break 4,150 to confirm trend change
✔️ If breakout happens → target 4,380–4,800
✔️ If OB fails → deeper channel drop to 3,700 OB
I drew the structure correctly. The analysis fully matches my levels.

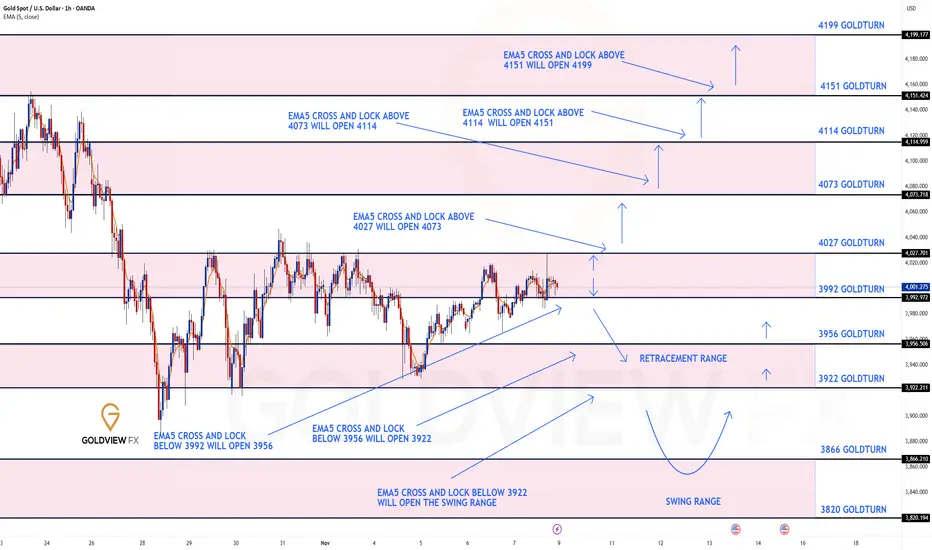
GOLD 1H CHART ROUTE MAP UPDATE & TRADING PLAN FOR THE WEEKHey Everyone,
Please see our updated 1h chart levels and targets for the coming week.
We are seeing price play between two weighted levels with a gap above at 4027 and a gap below at 3992. We will need to see ema5 cross and lock on either weighted level to determine the next range.
We will see levels tested side by side until one of the weighted levels break and lock to confirm direction for the next range.
We will keep the above in mind when taking buys from dips. Our updated levels and weighted levels will allow us to track the movement down and then catch bounces up.
We will continue to buy dips using our support levels taking 20 to 40 pips. As stated before each of our level structures give 20 to 40 pip bounces, which is enough for a nice entry and exit. If you back test the levels we shared every week for the past 24 months, you can see how effectively they were used to trade with or against short/mid term swings and trends.
The swing range give bigger bounces then our weighted levels that's the difference between weighted levels and swing ranges.
BULLISH TARGET
4027
EMA5 CROSS AND LOCK ABOVE 4027 WILL OPEN THE FOLLOWING BULLISH TARGETS
4073
EMA5 CROSS AND LOCK ABOVE 4073 WILL OPEN THE FOLLOWING BULLISH TARGET
4114
EMA5 CROSS AND LOCK ABOVE 4114 WILL OPEN THE FOLLOWING BULLISH TARGET
4151
EMA5 CROSS AND LOCK ABOVE 4151 WILL OPEN THE FOLLOWING BULLISH TARGET
4199
BEARISH TARGETS
3992
EMA5 CROSS AND LOCK BELOW 3992 WILL OPEN THE FOLLOWING BEARISH TARGET
3956
EMA5 CROSS AND LOCK BELOW 3956 WILL OPEN THE FOLLOWING BEARISH TARGET
3922
EMA5 CROSS AND LOCK BELOW 3922 WILL OPEN THE SWING RANGE
3866
3820
As always, we will keep you all updated with regular updates throughout the week and how we manage the active ideas and setups. Thank you all for your likes, comments and follows, we really appreciate it!
Mr Gold
GoldViewFX
XAUUSD: Trend in 30-Min timeframeThe color levels are very accurate levels of support and resistance in different time frames, and we have to wait for their reaction in these areas.
You should be noted, that we have two trend (green & purple)
So, Please pay special attention to the very accurate trend, colored levels, accurate channel and you must know that SETUP is very very sensitive.
Be careful
BEST
MT
