XAUUSD (Gold) – 1H Chart AnalysisSetup Type: Long Position
Entry: Around 4,062
Stop Loss: 4,026
Target: 4,246
Analysis:
Gold experienced a sharp decline but has now tapped into an intraday demand zone near 4,060. Price is showing early signs of a bullish reaction, suggesting a potential retracement or continuation toward the previous high zone around 4,240–4,250. If buyers maintain control above 4,060, upside movement remains likely.
Bias: Bullish above 4,060
Invalidation: Break and close below 4,026
#XAUUSD #Gold #GoldAnalysis #TechnicalAnalysis #PriceAction #TradingView #LongSetup #Forex #Commodities #MarketAnalysis
Trade ideas

Gold Moves Exactly as PlannedHey traders!
In my previous analysis, I mentioned that I expected a price correction — and gold perfectly followed the plan, dropping from 4150 to 4096, giving us a great profit!
As anticipated, the bullish move has now started, aiming for the target shown on the chart.
Follow me for more updates and fresh analyses! 🚀💰

GOLD XAUUSD TRADE SUMMERY FOR TODAYthe market structure never lies, every reaction is detailed and well calibrated, during newyork session we found support at 4038-4040 zone after the impact as a result of the retest of the neckline of the daily double top price action, double top is clearly a bearish price action and it never fails once's the neckline is broken ,expect a retest.
gold is still bullish and can swing at anytime.
GOODLUCK

XAUUSD: Trend in 30-Min timeframeThe color levels are very accurate levels of support and resistance in different time frames, and we have to wait for their reaction in these areas.
You should be noted, that we have two trend (green & purple)
So, Please pay special attention to the very accurate trend, colored levels, accurate channel and you must know that SETUP is very very sensitive.
Be careful
BEST
MT

GOLD HTF — Is the Buying Climax reach and the BIG short coming??After a +53% yearly gain and a 10% September candle, we might finally be seeing the start of a two-month distribution phase, smart money taking profit before the end of the year and preparing for re-accumulation lower for next year.
Wyckoff View (Daily):
Possible Buying Climax (BC) followed by Automatic Reaction (AR) and Secondary Test (ST).
If confirmed, the markdown could target the $3,440 zone, where major resistance from earlier structure awaits a retest.
Until proven otherwise, the macro trend is still bullish, but momentum exhaustion and vertical price action often precede deeper retracements.
Trading Plan:
Stay small, stay precise. Scalping on M1–M5 to extract 50–100 pips per day is the play while the big money decides the next leg.
We don’t predict, we react.
Trade like the Casino, not the hopeful gambler.
Touch grass, protect peace, stay grateful.
Be safe, and God bless you all.

Gold Weakens: Failed High, Support at RiskThe chart shows that gold is losing bullish momentum after failing to push toward a new Higher High (HH) and instead forming a Lower High (LH), signaling early weakness on the buyer side. The strong rejection at the LH triggered significant selling pressure, driving price back down toward a key support zone. This HH → LH structure suggests the market is shifting toward a potential downtrend, increasing the likelihood of a support break. From a fundamental perspective, the bearish bias is supported by expectations of higher-for-longer Fed interest rates, a strengthening U.S. dollar, and a risk-on environment that reduces demand for safe-haven assets like gold. Together, these technical and fundamental factors create a strong probability of deeper downside if the current support level is broken with a valid move.

GOLD Best Places To Buy And Sell Cleared , 500 Pips Waiting !Here is m y opinion on GOLD On 15 Mins T.F , We have a Huge movement To Upside since Last 2 weeks , and we have a range now for 2 days started between 4100.00 to 4148.00 so we can buy and sell Gold This Week from 2 areas , 4100.00 will be the best place for Buy and 4148.00 will be the best place for Sell , now the price very near buy area so we can wait the price to retest the support area and then enter a buy trade and targeting 4148.00 and when the price touch it and give us a good bearish P.A , we can enter a sell trade and targeting 4100.00 , It`s All Depend On Price action . I`m Sure that the main direction now is buy so i`m interesting to buy gold from 4100.00 but the best place for me will be 4060.00 cuz the price didn`t retest it until now . if we have a daily closure below our support then this idea will not be valid anymore .
Entry Reasons :
1- Highest Level The Price Touch It
2- Broken Res
3- New Support Created .
4- Clear Price Action .
5- Clear Support & Res .
6- Price Range Cleared .

GOLD Breakout Done , Long Setup Valid To Get 300 Pips !Here is My 15 Min Gold Chart , and here is my opinion , the price going up very hard without any correction so we should move with it and we have a 4H Candle closure above our Res 4130.00 And Perfect Breakout and this give us a very good confirmation , so we have a good confirmation now to can buy after the price go back to retest the broken area 4130.00 One more time and we have already a great touch that take all stop losses before going up so i think the second touch will be better and will give us a good chance to enter with good stop loss , and we can be targeting 100 to 300 pips . if we have a daily closure below this area this mean this idea will not be valid anymore .
Reasons To Enter :
1- Perfect Touch For The Area .
2- Clear Bullish Price Action .
3- Bigger T.F Giving Good Bullish P.A .
4- The Price Take The Last High .
5- Perfect 4H Closure .

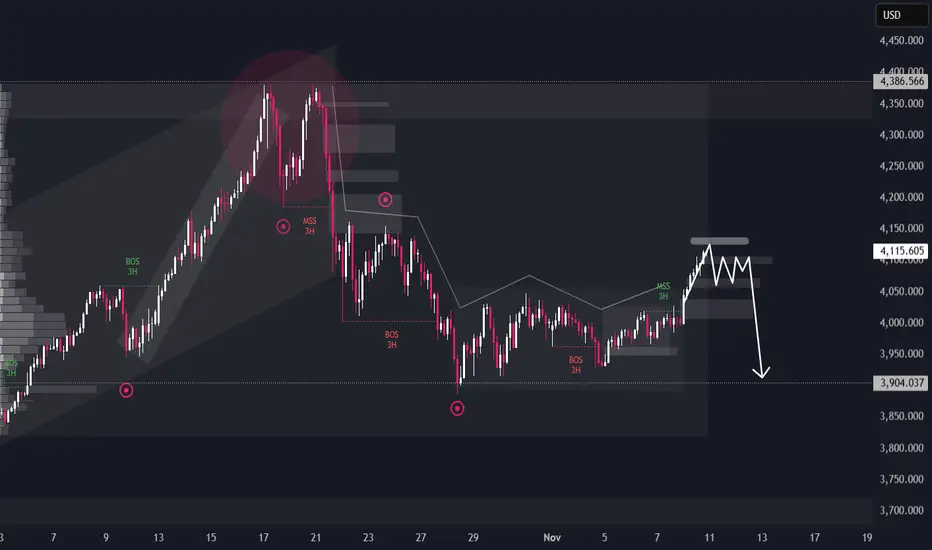
Gold trend analysis!Gold is showing signs of exhaustion after the recent corrective bounce. The 3H market structure highlights a clear distribution pattern, as price continues to reject from the 4,135–4,250 supply zone. Repeated Break of Structure (BOS) signals that bearish momentum remains dominant.
Institutional activity suggests that liquidity is being built above local highs, preparing for another downside leg. The current market sentiment stays bearish as long as price trades below the key premium area. A confirmed rejection from this zone could trigger a decline toward the 3,904 liquidity pool.
Only a breakout and hold above 4,250 would invalidate this scenario and shift bias back to bullish accumulation.
Gold Trade Plan 06/11/2025 ( Buy Deep)dear Trader,
The price is above the 20 moving average, and the 4020–4030 zone will be a very important area for gold buyers. I expect the price to break this zone soon, with the first target at 4070 and the second at 4130. As long as the price remains stable above 4000, these targets will be achievable.
Regards,
Alireza!

Gold Under Pressure: Key Resistance Holds, More Downside LikelyGold is moving inside a descending channel showing clear bearish pressure. Price is struggling to hold above 4050-70 and repeated rejections from the upper trendline confirm sellers are still in control. A clean break below 4025 can open the way toward the deeper liquidity zones around 4010 and 3975. As long as price stays below the falling trendline the bias remains bearish and any small pullback toward 4075-90 will likely act as a selling opportunity. Only a strong breakout above 4100-20 would shift momentum back to buyers.
✅ Bias: Sell below 4060-85 resistance
Sell Zone : 4075–4090
Stop Loss : Above 4120
Take Profit : 4025 - 4010 - 3975
Note
Please risk management in trading is a Key so use your money accordingly. If you like the idea then please like and boost. Thank you and Good Luck!

Gold 30-Min — Volume Buy Reversal Triggered⚡Base : Hanzo Trading Alpha Algorithm
The algorithm calculates volatility displacement vs liquidity recovery, identifying where probability meets imbalance.
It trades only where precision, volume, and manipulation intersect —only logic.
✈️ Technical Reasons
/ Direction — LONG / Reversal 4113
☄️Bullish momentum confirmed through strong candle body.
☄️Structure shifted with higher-low near key demand base.
☄️Volume expanding confirms order-flow alignment upward.
☄️Buyers reclaimed imbalance with sustained clean break.
☄️Algorithm detects rising momentum under low liquidity.
⚙️ Hanzo Alpha Trading Protocol
The Alpha Candle defines the day’s real control zone — the first battle of momentum.
From this origin, the Volume Window reveals where the next precision strike begins.
⚙️ Hanzo Volume Window / Map
Window tracked from 10:30 — mapping true market behavior.
POC alignment exposes institutional bias and breakout potential zones.
⚙️ Hanzo Delta Window / Pulse
Delta window monitors real buying vs. selling power behind each move.
Tracks volume aggression to expose who controls the candle — buyers or sellers.
When Delta aligns with Volume Map, momentum becomes undeniable.

XAUUSD TIME TO BUYGold Bullish sentiment
- Fibonacci Retracement Respect:
- Price retraced from the ATH (All-Time High) and found support near the 0.5 Fibonacci level (4,064.42).
- It nearly touched the 0.618 level (4,022.27) but closed above the 0.5, indicating buyers stepped in before deeper retracement occurred.
- This behavior often signals a potential continuation of the uptrend.
- FLIP ZONE Support:
- The highlighted FLIP ZONE marks a previous resistance turned support.
- Price reacting positively in this zone reinforces bullish sentiment—this is where buyers historically defend the level.
- Volume Confirmation:
- Volume spikes near the retracement low suggest accumulation, not distribution.
- Rising volume on upward candles implies strong buying interest.
- RSI Momentum:
- The RSI (Relative Strength Index) at the bottom shows a rebound from oversold or mid-range levels, which typically precedes upward movement.
- No bearish divergence is visible, supporting the bullish case.
- "Reacted on the previous neck":
- This likely refers to a neckline of a prior breakout pattern (e.g., inverse head and shoulders or double bottom).
- Price revisiting and bouncing from this neckline is a classic bullish retest.
Buyers now coming in.
- Price respected key Fibonacci support levels.
- Closed above the 0.5 retracement, showing strength.
- FLIP ZONE held as support.
- Volume and RSI confirm bullish momentum.
- Previous breakout level acted as support again.

XAUUSD: Buyers Defend $4,040 — Targeting $4,140 ResistanceHello everyone, here is my breakdown of the current Gold setup.
Market Analysis
XAUUSD has recently confirmed a bullish structure after bouncing strongly from the $4,000–$4,040 Support Zone, an area that coincides with the ascending Trend Line visible on the chart.
This level has repeatedly acted as a Buyer Zone, where multiple fake breakouts occurred — signaling liquidity sweeps and failure of sellers to maintain downward momentum. Each test of this support has been followed by a sharp bullish reaction, confirming strong demand and accumulation activity in this zone.
Currently, Gold is showing a controlled recovery phase, moving above the $4,040 Support and gradually approaching the $4,120–$4,160 Resistance Zone, which also aligns with the Trend Line extension and previous consolidation area. This zone represents the next critical reaction level for price. A confirmed breakout above it could open the way toward further continuation, while a rejection may lead to a corrective pullback back toward the $4,040 support. The recent price behavior — including several fake breakouts followed by strong recoveries — suggests that large buyers remain active, defending the bullish structure. As long as price holds above $4,040, the overall sentiment stays constructive and favors a gradual continuation toward the upper resistance levels.
My Scenario & Strategy
As long as XAUUSD remains above the $4,000–$4,040 Support Zone, the bullish bias remains valid.The next upside objective is located around $4,140–$4,160, where sellers may reappear based on past reactions. I expect the market to potentially form a small pullback before resuming its move higher. A sustained breakout and close above $4,160 would confirm a continuation toward $4,200 and possibly higher in the medium term.
However, if Gold breaks below $4,000, this bullish setup becomes invalid, and the price may return toward deeper support levels near $3,960–$3,940 before any new buying interest develops.For now, the structure supports buying pullbacks while the price stays above key support.
That's the setup I'm tracking. Thank you for your attention, and always manage your risk.

Another drop for goldHi traders,
Last week gold went up again and after it reached the bearish Daily FVG, it dropped again.
I think (grey) wave X is now finished.
So next week we could see a small correction up and another downmove to finish the bigger correction down.
After that it could go up again.
Let's see what price does and react.
Trade idea: Wait for a small correction up on a lower timeframe and a change in orderflow to bearish to trade short term shorts.
This shared post is only my point of view on what could be the next move in this pair based on my technical analysis.
But I react and trade on what I see in the chart, not what I've predicted or expect.
Don't be emotional, just trade your plan!
Eduwave

XAUUSD_5M_BuyShort-term gold analysis The market can enter an upward correction by completing five down waves The most important number for the up wave is $4,100 and only by maintaining this number can the market become bullish.

Symmetrical Triangle formationNice bounce off that 3900 support. If it holds above 4140, we could be heading back up to test 4200. Let's see if the bulls can push it.
Gold Intraday Trading Plan 11/17/2025As mentioned in my weekly post, today is very critical in determining the direction for this week. If 4050 is held, I will buy toward 4150. If 4050 is broken, I will wait for today's close and not trade for today.

Xauusd SignalXauusd Now Below Supply Zone We Have Best And Strong Selling Opportunity if you Can Take Risk
Sell Xauusd At 4126 To 4162
Take Profit Around 4025 To 3930
Depending On Your Equity How You Can Take Risk
Note It's Not Financial Advice Keep Buy Sell Your Own Research
Stay Alert For More Updates

GOLD DAILY TRADING 11/17: BUY TODAY🦁 THE GOLDEN ARENA – NOV 17, 2025
“Rebound or Trap? Let the Orderflow Decide.”
A visually striking TradingView plan – part narrative, part tactical map. This is not just a bias, it’s a battlefield strategy.
🧭 MARKET CONTEXT SNAPSHOT
Price currently consolidating around 4076 – 4084, after clean breaks of structure (BOS) and a deep retracement.
Significant supply zones confirmed at 4157 – 4180, where POC clusters, FVG imbalances, and volume absorptions align.
Orderflow on M5–M30 shows fading buy pressure and aggressive sells into lower highs.
🎯 CORE STRATEGIES FOR TODAY
🔺 Scenario 1: Breakout Trap SELL (High Conviction)
Target Zone 4178 – 4180 (Main Supply)
Stop Loss (SL) 4185
Take Profit 1 (TP1) 4155 (Low volume node)
Take Profit 2 (TP2) 4100 (Local support)
Take Profit 3 (TP3) 4040 (Structural SSL level)
🔍 Why this setup?
Clear liquidity pool above 4178 being targeted.
Volume tapering off into the move → classic reversal signal.
Footprint shows absorption candles at key supply.
🪙 Scenario 2: FVG Scalping SELL (Secondary)
Entry Zone 4157 – 4158
SL 4163
TP 4100 – 4105
✅ Perfect for short-term scalpers looking to ride the intraday rejection from the imbalance zone.
🟢 Bullish Reversal INVALIDATION (Failsafe Plan)
Trigger Break and hold above 4185
Entry Breakout Buy above 4190
SL 4175
TP 4220
Only flip bullish if aggressive buyers step in + strong delta + profile breakout.
🧱 KEY PRICE ZONES TO MONITOR
Level Description
4185 Stopline – invalidates Sell
4178 – 4180 Main SELL Zone (POC + FVG)
4157 – 4158 Minor FVG Scalping Area
4100 Micro support + Bull trap
4040 SSL – liquidity target
📊 VOLUME & ORDERFLOW INSIGHT
M5–M30 Footprints:
Massive seller imbalances from 4175+
Footprint at 4084 shows buyer exhaustion
Volume Profile:
High-volume node at 4178 acting as strong resistance
Low-volume gap below 4155 → fast price travel zone
Delta:
Negative delta buildup confirming sell bias
💡 EXECUTION CHECKLIST
✅ Wait for entry trigger at marked zones – don’t pre-empt.
🚫 Avoid FOMO buy into supply unless 4185 is cleanly broken.
🔔 Set alerts at 4157 and 4180 for rejection signs.
🧠 TRADING MANTRA OF THE DAY
"The chart speaks in structure,
The volume whispers the truth,
But the orderflow shouts the conviction."
📌 Bias: SELL on retracements toward supply → hold for 4100–4040
📌 Watchlist: Footprint aggression, absorption blocks, spoof traps

XAUUSD (GOLD) - 4H - Weekly Analysis (10-Nov - 14-Nov-25)Market Structure
Price is currently consolidating sideways after a strong drop.
The consolidation range is $3,960 – $4,045.
Stochastic is turning down from overbought, meaning bullish momentum is weakening.
Until price breaks above $4,060, rallies are retracements, not a trend reversal.
So the smart move:
→ Sell the rally, don’t buy the top.
Key Levels This Week
Zone / Price Range / Action
Sell Zone (Primary) / $4,035 – $4,060 / Best area to SELL
Sell Zone (Secondary) / $4,090 – $4,120 / If price spikes / liquidity grab
Support / TP1 / $3,970 – $3,975 / First profit zone
Support / TP2 / $3,925 – $3,940 / Main target
Major Demand / $3,880 – $3,900 / Extended target / potential bounce zone
✅ Primary Trade Setup — High Probability SELL
SELL LIMIT: $4,035 – $4,060
STOP LOSS: $4,090
TAKE PROFIT 1: $3,975
TAKE PROFIT 2: $3,935
TAKE PROFIT 3 (Extended): $3,900
Why this works:
This zone is previous support → now resistance.
Gold consistently rejects near round number clusters ($4,000 / $4,050 / $4,100).
Stochastic already indicates buyers are slowing.
🟡 Secondary Setup — Sell the Liquidity Grab (If price pushes higher)
SELL LIMIT: $4,090 – $4,120
STOP LOSS: $4,155
TAKE PROFIT: $4,035 → $3,975 → $3,935
This is the fake-out trap where smart money enters short.
📌 When to Avoid Trading
If price stays between $3,985 – $4,020, NO ENTRY.
This is the choppy noise zone → low win rate.
We only trade:
At strong resistance
Or at strong support
Not in the middle.
🎯 Expected Price Behavior Next Week
Early week → retest of $4,035–$4,060 area
Mid–late week → move down toward $3,970 → $3,940
This aligns with:
Profit-taking before US CPI/FOMC events
Lower safe-haven demand as volatility stabilizes short-term
🏁 Quick Trade Summary (Copy This)
Entry: 4,035 – 4,060
SL: 4,090
TP1: 3,975
TP2: 3,935
TP3: 3,900
Backup SELL (Liquidity Grab)
Entry: 4,090 – 4,120
SL: 4,155
TP: 4,035 → 3,975 → 3,935

XAUUSD DROPS BELOW $4,100 WHAT NEXT?XAUUSD price dropped below the $4,100 level on Friday’s trading session. This sparks reactions from traders. Are we going to see further selling pressure or it’s just a mere drop in price? From my own point of view, I expect more drop in price. I anticipate more bearish price action to develop away from this market. I’m selling short on Gold.

Is Gold Attempting to go back to Previous ATH?Hey Traders, in today's trading session we are monitoring XAUUSD for a buying opportunity around 4,220 zone, Gold is trading in an uptrend and currently is in a correction phase in which it is approaching the trend at 4,220 support and resistance area.
Trade safe, Joe.
