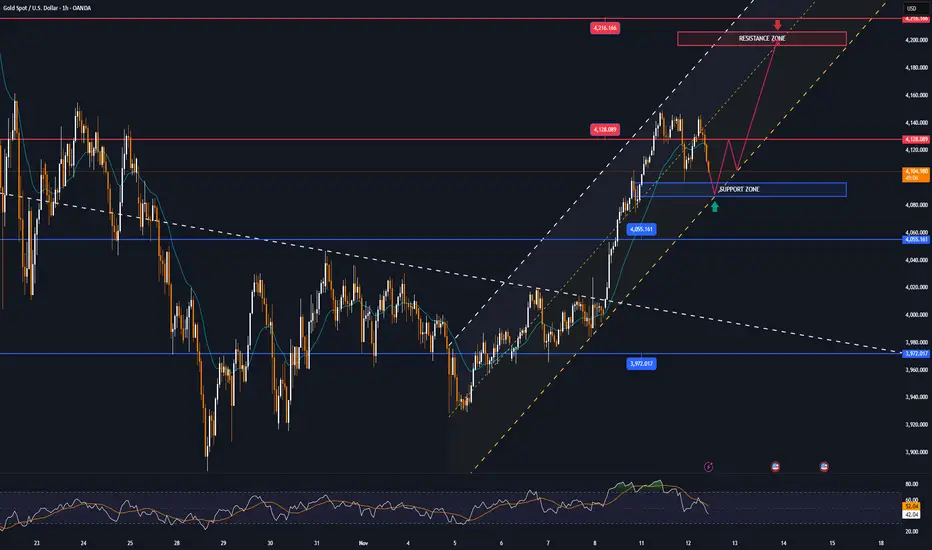
XAU/USD: Bullish Climb to 4225?FX:XAUUSD is positioning for a bullish climb on the 1-hour chart , with price respecting an upward trendline as dynamic support, bouncing from a key support zone that could fuel an upside extension toward multiple resistance levels if buyers sustain momentum. This setup offers a strategic entry amid recent volatility, with potential for breakout if volume picks up.
Entry between 4075-4105 (entry possible at current levels with strict risk management). Targets at 4180 (first) and 4225 (second), yielding a risk-reward ratio greater than 1:3 overall .Set a stop loss on a close below 4063 to limit downside exposure. 🌟 Monitor for confirmation via a strong bullish candle above entry with increasing volume, leveraging gold's safe-haven status.
Fundamentally , today's US economic data, including MBA Mortgage Applications at 13:00 UTC and Fed's Waller speech at 16:00 UTC, could sway USD strength and thus gold prices—hawkish Fed tones might cap upside, while softer data supports bulls. Recent analysis notes gold slipping below $4140 on a double top, signaling short-term pullbacks but with rebound potential testing pivotal resistance. 💡
📝 Trade Setup:
🎯 Entry Zone: 4075 – 4105 (entry possible at current levels with strict risk management)
💰 Targets:
1️⃣ 4180 – initial resistance zone
2️⃣ 4225 – secondary target / take-profit zone
❌ Stop Loss: Close below 4063
📈 Risk-to-Reward: Greater than 1:3 overall, depending on execution and scale-out strategy
What's your take on this gold move? Comment below!💡
Trade ideas

XAU (GOLD) DECODED TECHNICAL ANALYSISGold is currently in the final stage of its grand quarterly pattern. This pattern can only be considered restored if gold moves above $4,381, as highlighted in my previous post.
A major decline is expected. While multiple supports exist above, the minimum correction required for this pattern ranges from $1,282.4 up to $990.
Technical reasoning
Gold is in the last quarterly pattern but still within the second last yearly pattern
This year, only one valid yearly support has matured at $1,282.4, while the $2,625 support has not yet matured.
Therefore, for the current yearly pattern, only reliable support starts at $1,282.4
If gold were not in its second last yearly pattern, the current quarterly pattern could potentially test its lowest support at $35
Historical context:
For comparison, the Dow Jones Industrial Average (DJI) has been in its final grand yearly cycle last pattern since 1974, demonstrating how long these yearly patterns can last.
The forming of a yearly last pattern with correcting typically takes 4 to 9 years.
This message is for educational purposes only.
Always DYOR.

XAUUSD Analysis – Major Buy Zone Reached!Gold (XAUUSD) has finally tapped into the key demand zone between $4,000 – $4,020, a level that previously acted as a strong reaction point.
This zone has now been respected again with a clean liquidity grab below recent lows.
🔍 Market Breakdown
Price has been in a steady decline after rejecting the supply zone around $4,130 – $4,150 (highlighted red).
Today, we saw a sharp wick down into the green demand zone, showing buyer presence and absorption of sell-side liquidity.
FOMC and USD news lined up ahead increases volatility, but also increases the probability of a strong reversal from this zone.
📌 My Bias
I’m expecting: 1️⃣ A small corrective dip or retest back into the green zone
2️⃣ A strong bullish rally targeting the supply zone above
3️⃣ Final target around $4,130 – $4,150 if momentum holds
🎯 Buy Targets
Entry Zone: 4000 – 4020
TP1: 4075
TP2: 4130 (Main Target)
TP3: 4150 (Extended)
SL: Below 3985
⚠️ Why This Setup Makes Sense
Price swept liquidity beneath the previous lows
Buyers responded strongly from the demand zone
USD weakness expected around major news events
Clean imbalance above waiting to be filled
Strong bullish structure still intact on higher timeframes
💬 Engagement Question
Do you think Gold will respect this demand zone and push upward, or will news drag it lower?
Drop your opinion in the comments!👇🔥
If you want me to break down the next move after the news release, just comment “Update” and I’ll post a follow-up. 📈💬

XAUUSD (Gold/USD) Buy Signal – 4H Timeframe
Entry: 4,130
Stop Loss: 4,110
Take Profit: 4,170
Risk–Reward Ratio: 1 : 2
Price is currently retesting the 4,125–4,165 resistance zone after a strong bullish run, showing signs of continuation. A confirmed breakout and close above 4,130 indicate strong buying momentum toward 4,170.
The RSI is around 58–60, suggesting mild bullish strength and room for further upside before becoming overbought. The volume shows rising green bars, confirming that buyers are stepping in and defending the 4,110–4,120 support area.
This setup signals a potential continuation of the bullish trend. Traders can enter at 4,130, place a stop loss at 4,110 to protect against false breakouts, and aim for a take profit at 4,170. If buying pressure increases with RSI climbing above 60 and volume expanding further, the next possible target could be 4,190 with a trailing stop to secure profits.

Gold Moves Exactly as PlannedHey traders!
In my previous analysis, I mentioned that I expected a price correction — and gold perfectly followed the plan, dropping from 4150 to 4096, giving us a great profit!
As anticipated, the bullish move has now started, aiming for the target shown on the chart.
Follow me for more updates and fresh analyses! 🚀💰

$Gold Technical Analysis October 2025 📊 #GOLDUSD Update
🔑 Key Zones
PRZ: $4,371 (Gold stopped nicely at $4,381!)
Local Support Zone: $4,180–$4,050
Holding this range can send Gold soaring again toward:
➡️ $4,500 → $4,750 → $5,200
If these supports are lost, → next downside zones are:
➡️ $3,950 → $3,850 → $3,750
📅 Timeframe & View
Short-term:
Gold trading between $4,180–$4,050 — key range before the next big leg.
Long-term:
ATH projection levels:
💎 $5,300 → $5,700 → $7,300 → $7,700
These correspond with critical years for the global cycle:
2025 (Oct–Nov) performance
2027
2031
2033
Every pullback in this decade-long uptrend remains a buy opportunity.
⚖️ Gold or BTC?
For the short term, my focus shifts to BTC.
But once that phase completes, I’ll move back to Gold for the long wave.
💰 Long-Term Holders
For those holding gold long-term (1 year+):
Any pullback below $3750 remains a strong buy zone for adding.
✅ Quick Recap
📍 PRZ hit: $4,371–$4,381
🛡 Support: $4,180–$4,050
🚀 Upside Targets: $4,500–$4,750–$5,200
⚠️ Downside Risk: $3,950–$3,850–$3,750
🧭 Cycle Years: 2025, 2027, 2031, 2033
💰 Focus: Short-term BTC → Long-term Gold
🧭 Personal Trading Note
I only trade Gold in the real market, and use the demo setup here purely for tracking and study.
⚓ Renzo Tip
“When the tide turns, the wise trader doesn’t fight it — he rides one wave, then waits for the next.”
🤲 Prayer
May Allah bless us with patience in the long waves, wisdom in every entry,
and reward us with clarity in both gold and time.

Gold Under Pressure: Key Resistance Holds, More Downside LikelyGold is moving inside a descending channel showing clear bearish pressure. Price is struggling to hold above 4050-70 and repeated rejections from the upper trendline confirm sellers are still in control. A clean break below 4025 can open the way toward the deeper liquidity zones around 4010 and 3975. As long as price stays below the falling trendline the bias remains bearish and any small pullback toward 4075-90 will likely act as a selling opportunity. Only a strong breakout above 4100-20 would shift momentum back to buyers.
✅ Bias: Sell below 4060-85 resistance
Sell Zone : 4075–4090
Stop Loss : Above 4120
Take Profit : 4025 - 4010 - 3975
Note
Please risk management in trading is a Key so use your money accordingly. If you like the idea then please like and boost. Thank you and Good Luck!

GOLD SENDS CLEAR BEARISH SIGNALS|SHORT
GOLD SIGNAL
Trade Direction: short
Entry Level: 4,168.46
Target Level: 4,053.04
Stop Loss: 4,244.92
RISK PROFILE
Risk level: medium
Suggested risk: 1%
Timeframe: 9h
Disclosure: I am part of Trade Nation's Influencer program and receive a monthly fee for using their TradingView charts in my analysis.
✅LIKE AND COMMENT MY IDEAS✅

Gold 30-Min — Volume Buy & Sell Reversals Triggered⚡Base : Hanzo Trading Alpha Algorithm
The algorithm calculates volatility displacement vs liquidity recovery, identifying where probability meets imbalance.
It trades only where precision, volume, and manipulation intersect —only logic.
✈️ Technical Reasons
/ Direction — LONG / Reversal 4103
☄️Bullish momentum confirmed through strong candle body.
☄️Structure shifted with higher-low near key demand base.
☄️Volume expanding confirms order-flow alignment upward.
☄️Buyers reclaimed imbalance with sustained clean break.
☄️Algorithm detects rising momentum under low liquidity.
✈️ Technical Reasons
/ Direction — SHORT / Reversal 4242
☄️Bearish rejection confirmed through sharp candle body.
☄️Lower-high forming beneath resistance supply region.
☄️Volume decreasing confirms exhaustion in price rally.
☄️Sellers regained imbalance with heavy top rejection.
☄️Algorithm detects fading demand and shift to control.
⚙️ Hanzo Alpha Trading Protocol
The Alpha Candle defines the day’s real control zone — the first battle of momentum.
From this origin, the Volume Window reveals where the next precision strike begins.
⚙️ Hanzo Volume Window / Map
Window tracked from 10:30 — mapping true market behavior.
POC alignment exposes institutional bias and breakout potential zones.
⚙️ Hanzo Delta Window / Pulse
Delta window monitors real buying vs. selling power behind each move.
Tracks volume aggression to expose who controls the candle — buyers or sellers.
When Delta aligns with Volume Map, momentum becomes undeniable.

What will the gold price be next week 11-21/2025?📊 Support – Resistance – Fibonacci Analysis
1. Trend Overview
Price has broken below the ascending channel, signaling a shift into a corrective downtrend phase.
2. Key Resistance Zone
4,155 – 4,170
Confluence of Fibonacci retracement 0.5 – 0.618
Overlaps with a supply zone + EMA20
→ Strong resistance, high probability of selling pressure.
This is also the expected pullback/retest area before the next bearish leg.
3. Key Support Levels
Support 1 – 4,108
Fibonacci extension 1.0
Horizontal support
→ Likely to generate a short-term reaction.
Support 2 – 3,950 (Fibo 2.618)
Major downside target if the structure fully breaks
→ Primary bearish target for a deeper continuation.
4. Price Scenario
Price may pull back toward 4,155 – 4,170, then:
→ Resume the downtrend, targeting 4,108.
A clean break below 4,108 opens the path toward 3,950 (Fibo 2.618).
BUY GOLD : 3950 - 3947
Stoploss : 3937
Take Profit : 100-300-500pips
SELL GOLD : 4250 - 4253
Stoploss : 4263
Take Profit : 100-300-500pips

Is Gold Attempting to go back to Previous ATH?Hey Traders, in today's trading session we are monitoring XAUUSD for a buying opportunity around 4,220 zone, Gold is trading in an uptrend and currently is in a correction phase in which it is approaching the trend at 4,220 support and resistance area.
Trade safe, Joe.

Gold 30-Min — Volume Buy Reversal Triggered⚡Base : Hanzo Trading Alpha Algorithm
The algorithm calculates volatility displacement vs liquidity recovery, identifying where probability meets imbalance.
It trades only where precision, volume, and manipulation intersect —only logic.
✈️ Technical Reasons
/ Direction — LONG / Reversal 4113
☄️Bullish momentum confirmed through strong candle body.
☄️Structure shifted with higher-low near key demand base.
☄️Volume expanding confirms order-flow alignment upward.
☄️Buyers reclaimed imbalance with sustained clean break.
☄️Algorithm detects rising momentum under low liquidity.
⚙️ Hanzo Alpha Trading Protocol
The Alpha Candle defines the day’s real control zone — the first battle of momentum.
From this origin, the Volume Window reveals where the next precision strike begins.
⚙️ Hanzo Volume Window / Map
Window tracked from 10:30 — mapping true market behavior.
POC alignment exposes institutional bias and breakout potential zones.
⚙️ Hanzo Delta Window / Pulse
Delta window monitors real buying vs. selling power behind each move.
Tracks volume aggression to expose who controls the candle — buyers or sellers.
When Delta aligns with Volume Map, momentum becomes undeniable.

XAUUSD_3M_BuyGold Analysis
Long-term Time Frame
The formation of a cup pattern in two stages, the first stage reaching the target and the second stage for the long term can still have the ability to form upward waves

XAU/USD Market Outlook — Bullish Move From 4,058.36 ZoneGold has retraced into a major demand zone around 4,058.36, where price has shown the first signs of bullish reaction after clearing liquidity below previous lows. This zone aligns with a prior accumulation block and serves as the origin of the last major bullish swing.
As long as price holds above this level, I expect a bullish continuation toward the upper liquidity region, with targets around 4,244.86, and ultimately the major high at 4,381.73.
My stop loss is positioned at 3,887.60, below the deeper demand zone and previous structural low, ensuring safety from intraday volatility while maintaining the bullish structure.

GOLD Best Places To Buy And Sell Cleared , 500 Pips Waiting !Here is m y opinion on GOLD On 15 Mins T.F , We have a Huge movement To Upside since Last 2 weeks , and we have a range now for 2 days started between 4100.00 to 4148.00 so we can buy and sell Gold This Week from 2 areas , 4100.00 will be the best place for Buy and 4148.00 will be the best place for Sell , now the price very near buy area so we can wait the price to retest the support area and then enter a buy trade and targeting 4148.00 and when the price touch it and give us a good bearish P.A , we can enter a sell trade and targeting 4100.00 , It`s All Depend On Price action . I`m Sure that the main direction now is buy so i`m interesting to buy gold from 4100.00 but the best place for me will be 4060.00 cuz the price didn`t retest it until now . if we have a daily closure below our support then this idea will not be valid anymore .
Entry Reasons :
1- Highest Level The Price Touch It
2- Broken Res
3- New Support Created .
4- Clear Price Action .
5- Clear Support & Res .
6- Price Range Cleared .

GOLD Breakout Done , Long Setup Valid To Get 300 Pips !Here is My 15 Min Gold Chart , and here is my opinion , the price going up very hard without any correction so we should move with it and we have a 4H Candle closure above our Res 4130.00 And Perfect Breakout and this give us a very good confirmation , so we have a good confirmation now to can buy after the price go back to retest the broken area 4130.00 One more time and we have already a great touch that take all stop losses before going up so i think the second touch will be better and will give us a good chance to enter with good stop loss , and we can be targeting 100 to 300 pips . if we have a daily closure below this area this mean this idea will not be valid anymore .
Reasons To Enter :
1- Perfect Touch For The Area .
2- Clear Bullish Price Action .
3- Bigger T.F Giving Good Bullish P.A .
4- The Price Take The Last High .
5- Perfect 4H Closure .

Gold Rise Dream Shattered
news:
On Monday (November 17), spot gold rose and then fell back. It briefly broke through the $4,100 mark in early trading and rose moderately to $4,105 per ounce during the Asian session. It then fluctuated and weakened, falling back below $4,100 and touching a low of $4,050. It maintained a defensive posture for the third consecutive day on Monday.
The highly anticipated October US non-farm payrolls report will be released on Thursday, followed by the FOMC minutes on Wednesday. These will play a crucial role in influencing short-term dollar price dynamics and providing some meaningful impetus to precious metals.
Friday's preliminary manufacturing PMI figures for Europe and the US, along with the revised University of Michigan Consumer Sentiment Index, could amplify market volatility, especially if they indicate persistent inflation or weak consumption. Additionally, Friday will see the release of monthly US state employment and unemployment data for October 2025, which investors should also pay close attention to.
Technical Analysis:
The weakness below the 200-period SMA on the 4-hour chart may find some support near Friday's low of around $4,030. Following that is the psychological level of $4,000; a decisive break below this level could allow gold prices to accelerate their decline towards the $3,930 support level, then the $3,900 level, and finally the late October low of around $3,885.
There are many negative signals on the 1-hour chart. The price is clearly constrained by the Bollinger Middle Band (4100). The RSI is converging at the 50 level and showing a downward trend. The MACD has entered the oversold zone, but there is still no clear indication of a rebound.
Signal:
Buy:4115-4110 SL:4125 TP:4030-4050


XAU/USD | Double Bottom → Breakout Retest → Clear Path for Bulls🧭 Market Overview
Gold has transitioned beautifully from a bearish liquidation phase into a clean bullish breakout structure.
This chart walks through each stage of the cycle — Accumulation → Breakout → Retest → Expansion — all clearly mapped for educational insight.
After sellers exhausted around $3,940–$3,960, Gold printed a textbook Double Bottom reversal.
Once price broke and closed above the neckline at $4,120, the structure flipped bullish — and now we’re in the Breakout Retesting phase.
🧩 Step-by-Step Breakdown of Chart Markings
🔶 1️⃣ “Clear Path for Bulls” – Liquidity Void Zone
The “Clear Path for Bulls” zone highlights a previous inefficient drop — an area with minimal resistance.
When price re-enters this void, momentum often accelerates, creating strong bullish continuation.
This is why above $4,120, price faces little friction until the next supply zone.
🟩 2️⃣ “Double Bottom” – Structure Base
Formed near $3,940–$3,960, this marks the liquidity sweep and accumulation base.
The second bottom confirms buyer presence and sets the neckline at $4,120.
That neckline is now acting as support, exactly where price is retesting today.
Below it? Only a liquidity pocket — thin structure, fast moves.
⚙️ 3️⃣ “Breakout Retesting” – Confirmation Phase
The “Breakout Retesting” zone illustrates a healthy technical pullback.
This retest confirms structure integrity, shakes out weak hands, and attracts institutional liquidity.
As long as $4,100–$4,120 holds, bulls maintain full control.
🔴 4️⃣ “Invalidation Point” – Structural Risk Line
The red-labeled “Invalidation Point” defines where the bullish thesis fails: a 4H close below $4,080.
This is the cutoff level protecting traders from a failed breakout.
The red projection (−4.11%, −168 pts) visualizes the probable liquidity sweep back toward $3,940.
🟢 5️⃣ “215.25 (5.20%) → 21,525” – Bullish Projection
This is the measured-move projection from the Double Bottom’s height.
It targets a 5.20% upside move into $4,360–$4,380, which aligns with the next liquidity/supply zone.
Simple, technical, and logical — structure-based profit zone.
⚫ 6️⃣ “−168.31 (−4.11%)” – Bearish Counterpath
A failed retest would likely send price down into the liquidity pocket again.
This highlights the importance of invalidation — clear risk awareness before execution.
Great visual lesson on maintaining reward-to-risk balance.
🟩 Bullish Case
✅ Hold above $4,120 confirms breakout integrity
🎯 Target 1 → $4,280
🎯 Target 2 → $4,360–$4,380
⚡ “Clear Path for Bulls” offers minimal resistance
🟥 Bearish Case
⚠️ Close below $4,080 invalidates breakout
📉 Expect liquidity grab toward $3,940–$3,960
💧 Reaccumulation likely before next attempt higher
🧠 Educational Insights
Structure builds sentiment — price respects zones, not opinions.
Breakout Retests validate structure; they’re not reversals.
Invalidation Points = professional discipline.
Measured Moves project liquidity targets, not guarantees.
Liquidity Voids show potential acceleration zones — trade them with structure.
💬 Trade Summary
Bias Above / Below Targets Risk Structure
🟩 Bullish Above $4,120 $4,280 → $4,380 Below $4,080 Double Bottom + Retest
🟥 Bearish Below $4,080 $3,940 Invalidation Liquidity Sweep Setup
🧩 Final Thoughts
Gold is now retesting its breakout structure — a key moment for confirmation.
Holding $4,120 keeps bulls in command toward $4,380, while losing it could trigger a −4% liquidity sweep before the next buildup.
This move is a clean visual example of:
Liquidity → Structure → Confirmation → Expansion
Stay patient, stay structured, and trade confirmations — not assumptions. 📚✨
📢 Community Discussion
What’s your bias on Gold here?
🟩 Holding above $4,120 for the bullish continuation, or 🟥 expecting a retest failure toward $3,940?
Share your thoughts 👇

Gold Technical Rebound to FVG, Prioritise WATCHING FOR SELL at 4📊 Market Structure
Gold has completed a strong decline from the peak of 4.21x, leaving consecutive Break of Structure (BoS), confirming a short-term bearish structure.
The drop through the Breakout zone of 4.10x indicates a dominant selling force.
Currently, the price is bouncing from the Premium Zone 4.05x, aligning with the technical rebound behaviour after a strong sell-off.
The BUY side is merely pulling the price back to the abandoned liquidity zones (FVG 4.12x – 4.15x) before the SELL side can regain control.
The upper FVG zone is where the price often returns to fill after a steep fall. This is also the confluence zone between:
FVG (Fair Value Gap)
Old candle body Breaker
Fibonacci Premium
→ The risk of selling at these zones is very high.
💎 Key Technical Zones
Rebound zone for Sell
FVG 1: 4.101 – 4.126
FVG 2 (Strong Confluence): 4.126 – 4.150
Support zone – target to hit
Premium Zone $$$: 4.050 – 4.052
Lower FVG: 4.030 – 4.035
High probability price scenario: Rebound to FVG → reaction → continue to decline to 4.03x.
🎯 Trading Plan – Prioritise SELL
1️⃣ SELL Setup – High Probability
Wait for price to rebound to the above FVG zones:
Entry SELL:
4.118 – 4.126
Can add orders at higher: 4.140 – 4.150
Stop-loss: above 4.158
TP1: 4.101
TP2: 4.050
TP3: 4.030
✔️ This is a trend-following setup, selling at premium, adhering to SMC principles.
✔️ The current price is just beginning the rebound, not yet meeting BUY conditions.
2️⃣ BUY Setup – Only activate on deep Discount
Entry BUY: 4.030 – 4.035 (Lower FVG)
SL: below 4.020
TP: 4.070 – 4.100
→ BUY is only for counter-trend traders and must wait for a clear discount.
🧠 Vincent’s View
The market is in a distribution – decline phase, every rebound aims to pull liquidity.
As long as the price does not close above 4.150, SELL remains the optimal strategy for the day.
Observe closely when the price hits 4.12x – 4.15x, this is a “high-risk” zone for the BUY side and a “great opportunity” for the SELL side.
“Sell where the liquidity lives — that’s where institutions strike.” ⚜️
⏰ Timeframe: 1H
📅 Update: 17/11/2025
✍️ Analysis by: Captain Vincent

GOLD volatility, monetary policy and political riskThe global OANDA:XAUUSD went through a volatile trading session on Tuesday, as prices fell more than $50 in the North American session before recovering around $30, ending the day in the green. As of Wednesday morning, November 12, spot gold stood at around $4,128/ounce, up around $2 on the day.
The main drivers of this development came from two opposing factors: the prospect of the Federal Reserve (Fed) possibly cutting interest rates in December, and capital withdrawals from gold ETFs after a long rally.
Policy pressures and labor market signals
U.S. private payrolls data, according to preliminary estimates from ADP Research, showed a weekly average of 11,250 job cuts in the four weeks ended October 25. The weaker-than-expected figure sent the dollar to a low of 99.29, giving gold a chance to rebound.
The move comes just as Washington is about to end its longest government shutdown in history, which has stalled the release of economic data. Investors are hoping the reopening of the government will quickly bring a wave of pent-up data that will help better determine the true state of the U.S. economy.
“As the government reopens, we’re going to start seeing more cracks in the economy,” said Marc Chandler, chief strategist at Bannockburn Global Forex. This expectation reinforces the belief that the Fed will begin its easing cycle in December. According to the CME FedWatch tool, the probability of a rate cut has risen to 64%, while Fed Governor Milan hinted at the possibility of a 50 basis point cut due to a weak labor market and slowing inflation.
ETF Profit Taking, Gold Temporarily Adjusts
However, gold’s rally was capped by profit-taking in the ETF market. Bloomberg data shows gold ETFs have seen four straight weeks of outflows, after eight weeks of net buying. “Every 1% move in the gold price translates into about 10 tonnes of ETF outflows,” said Michael Haigh, head of FIC research at Société Générale.
The reversal reflects investors’ defensive sentiment after gold peaked at $4,380 an ounce in mid-October, a new record high amid political uncertainty and expectations of lower interest rates. Still, safe-haven demand was strong enough to help prices recover to $4,126.77 by the end of Tuesday’s session, up 0.3%.
US Politics: A lull ahead of data
The US Senate has passed a deal to reopen the government, while the Republican-controlled House is expected to approve it this week, before it goes to the White House for President Trump to sign into law. The reopening of the government not only ends the government shutdown but also sets the stage for a new cycle of data releases, including official jobs and inflation reports.
Medium-term outlook: Gold demand remains strong
Despite short-term volatility, fundamentals remain supportive of gold. The precious metal has risen more than 55% year-to-date, on track for its biggest gain since 1979. “The medium-term support from global easing to central bank demand remains intact,” said Christopher Wong, a strategist at OCBC.
Summary
The gold market is operating in a cycle of monetary policy expectations and geopolitical safe-haven sentiment. As the Fed moves closer to easing and delayed data looms, price volatility is likely to remain high.
However, with sustained central bank buying and global risks remaining intact, gold remains a strategic asset in a reshaping global financial landscape.
Technical analysis OANDA:XAUUSD
Gold prices are maintaining a short-term uptrend channel formed from the October bottom. After a deep correction around $3,970 – $3,850/ounce (corresponding to the Fibonacci levels of 0.382 and 0.5), the price has bounced back and is currently trading around $4,123, close to the technical resistance zone of Fib 0.236 at $4,128.
The moving average (MA21) is currently at $4,055, acting as a dynamic support zone in the short term. The recent candlestick structure shows that the bullish momentum is being consolidated with a series of higher lows, while the RSI has recovered towards 55, confirming that the bullish momentum is regaining the upper hand.
If gold holds above the $4,055 zone, the next upside targets are:
• Near resistance: $4,216 – $4,220 (psychological level and 0.236 Fibonacci resistance zone).
• Extended resistance: $4,308 – $4,380 (historic old peak zone).
On the contrary, if the price loses $4,055, the $3,972 – $3,846 zone will become the main support zone to watch, corresponding to the lower boundary of the current uptrend channel.
The overall trend remains bullish, provided the $4,055 support zone holds. The current phase is a recovery accumulation phase, which could open up a further rally towards $4,300 if US economic data continues to be weak and the Fed reinforces easing expectations.
SELL XAUUSD PRICE 4201 - 4199⚡️
↠↠ Stop Loss 4205
→Take Profit 1 4193
↨
→Take Profit 2 4187
BUY XAUUSD PRICE 4090 - 4092⚡️
↠↠ Stop Loss 4086
→Take Profit 1 4098
↨
→Take Profit 2 4105
GOLD (XAU/USD): 2 Crucial Trades Before the NFP Storm!📉 Technical Analysis (SMC - 2H)
Trend: Downtrend after clear MSS/BOS.
Focus: Price is retracing to the Selling Zone (Premium) to fill the FVG.
⚔️ Detailed Trading Plan (R:R > 1:2)
1. Preferred Strategy: SELL Limit (Trend Following)
Entry: 4,157.782 (FVG Peak - Supply Zone)
Stop Loss (SL): 4,206.895 (Safe SL above nearest structural peak)
Take Profit 2 (TP2): 4,051.733 (Main structural target - Nearest low)
Objective: Participate in the ongoing downtrend.
2. Countertrend Strategy: BUY Limit (Technical Rebound)
Entry: 4,051.733 (Nearest structural low - Support)
Stop Loss (SL): 4,018.699 (SL below lower FVG)
Take Profit 2 (TP2): 4,126.333 (Rebound to upper FVG low)
Objective: Capitalize on the technical rebound from strong support.
🚨 Key Risk: This Week's Focus
Hawkish Fed: Officials like Schmid affirm high inflation, unwilling to ease policy, maintaining high interest rates (Negative for Gold).
Major News: FOMC Minutes (Wednesday) and especially NFP (Thursday) will determine short-term momentum for USD/Gold.
Risk Management: Gold will be highly volatile from Wednesday. Adhere to SL and manage capital under 2% per trade.
#Gold #XAUUSD #Forex #TechnicalAnalysis #FVG #SmartMoney #Fed #NFP #TradingView

XAUUSD DROPS BELOW $4,100 WHAT NEXT?XAUUSD price dropped below the $4,100 level on Friday’s trading session. This sparks reactions from traders. Are we going to see further selling pressure or it’s just a mere drop in price? From my own point of view, I expect more drop in price. I anticipate more bearish price action to develop away from this market. I’m selling short on Gold.
