GOLD Best Places To Buy And Sell Cleared , 500 Pips Waiting !Here is m y opinion on GOLD On 15 Mins T.F , We have a Huge movement To Upside since Last 2 weeks , and we have a range now for 2 days started between 4100.00 to 4148.00 so we can buy and sell Gold This Week from 2 areas , 4100.00 will be the best place for Buy and 4148.00 will be the best place for Sell , now the price very near buy area so we can wait the price to retest the support area and then enter a buy trade and targeting 4148.00 and when the price touch it and give us a good bearish P.A , we can enter a sell trade and targeting 4100.00 , It`s All Depend On Price action . I`m Sure that the main direction now is buy so i`m interesting to buy gold from 4100.00 but the best place for me will be 4060.00 cuz the price didn`t retest it until now . if we have a daily closure below our support then this idea will not be valid anymore .
Entry Reasons :
1- Highest Level The Price Touch It
2- Broken Res
3- New Support Created .
4- Clear Price Action .
5- Clear Support & Res .
6- Price Range Cleared .
Trade ideas

"XAUUSD"Gold quickly reached the resistance targets it had on its upward path.
The shape of the candles formed shows that it no longer has the strength to reach higher targets within the remaining time,
so a pullback of gold toward 3900 seems more likely.
Please review the previous analyses.
XAUUSD | Gold Swing Short SetupGold closed strong Bearish in Weekly now retesting the Bearish Ob, Until unless it doesn't take liquidation below, chances are higher it will dump again. Use proper risk management, if it forms the daily fvg, then take first entry from the 50% of daily fvg, 2nd from the entry mentioned, and hold till tp or SL.

BUY GOLD NOW, FOCUS We Take a buy position here, and focus on 4035.076, AND IF MORE MOMENTUM Continues we could see, 4050.133 level been reached,
*TRUST THE SYSTEM*

long move toward the IMB D1.
10:05 UTC+2
The short move has potentially already fulfilled its purpose.
The price took PWL (+ PDL and ff IMBᵃ D1).
This is a compression-based approach — therefore, from this zone I will expect a long move toward the IMBᵃ D1.
Inside that zone, I will watch the price again and make a new analysis. For now, the plan is to work toward it.
If the price holds below AL, then I will ignore longs today.

Below 4,025 USD = continuation lower; above 4,060 USD = rebound.Gold is sitting on a knife’s edge.
Bulls are trying to defend 4,030 USD, but momentum still favors the sellers after the breakdown below 4,100 USD.
If 4,030 USD breaks, expect a slide toward 3,950–3,880 USD.
If buyers reclaim 4,060 USD, we could see a technical rebound toward 4,160 USD.
For now, the professional move is patience — wait for confirmation either way.
Below 4,025 → sell the continuation.
Above 4,060 → buy the reclaim.
Between those levels → stay out and protect capital.

GOLD Breakout Done , Long Setup Valid To Get 300 Pips !Here is My 15 Min Gold Chart , and here is my opinion , the price going up very hard without any correction so we should move with it and we have a 4H Candle closure above our Res 4130.00 And Perfect Breakout and this give us a very good confirmation , so we have a good confirmation now to can buy after the price go back to retest the broken area 4130.00 One more time and we have already a great touch that take all stop losses before going up so i think the second touch will be better and will give us a good chance to enter with good stop loss , and we can be targeting 100 to 300 pips . if we have a daily closure below this area this mean this idea will not be valid anymore .
Reasons To Enter :
1- Perfect Touch For The Area .
2- Clear Bullish Price Action .
3- Bigger T.F Giving Good Bullish P.A .
4- The Price Take The Last High .
5- Perfect 4H Closure .

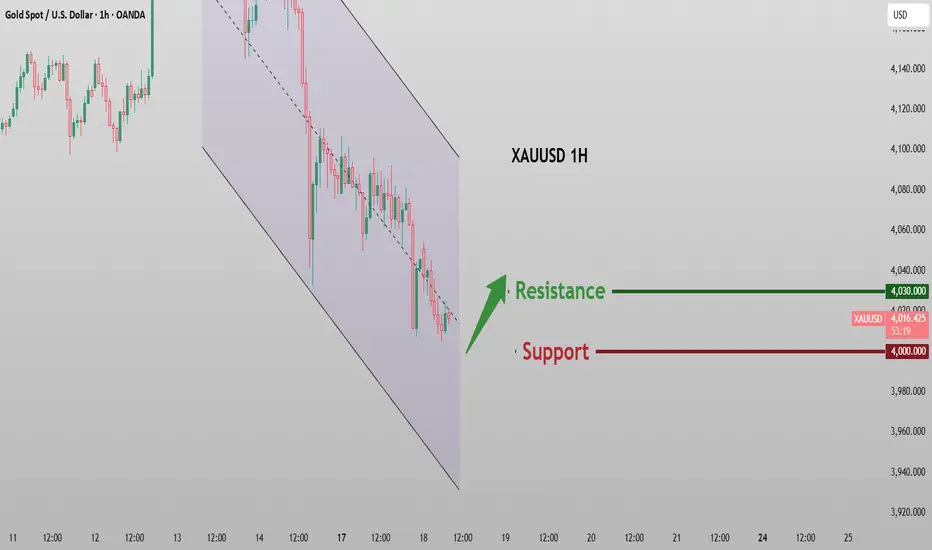
Gold Bears Take ChargeGold continues to trade under calculated downward pressure as the market maintains a decisive bearish structure. The repeated inability of buyers to hold price above the 4020–4035 supply region confirms that sellers remain firmly in control. This zone has now become a strong rejection point, shaping a clear bearish trajectory for the sessions ahead.
On the technical front, price is forming tight corrective pullbacks—an indication of seller strength and buyer exhaustion. The break below the 4000 psychological level has further shifted momentum, exposing the downside liquidity pocket toward 3940.
Fundamental Drivers Boosting Bearish Pressure
1. Strengthening U.S. Dollar
Dollar demand has picked up amid safe-haven flows and expectations of tighter U.S. financial conditions. A stronger USD traditionally weighs on gold, reducing its appeal as a non-yielding asset.
2. Hawkish Tone From the U.S. Federal Reserve
Recent comments from Fed officials hint at reluctance to cut rates aggressively. Even a mildly hawkish stance keeps treasury yields elevated—another bearish force for gold.
3. Reduced Demand for Safe-Haven Assets
Geopolitical tensions have eased compared to previous weeks, lowering emergency demand for gold. When risk appetite stabilizes, investors rotate out of metals and into higher-yielding assets.
4. Rising Bond Yields
Higher yields increase the opportunity cost of holding gold, pushing metal prices downward as investors prefer income-generating instruments.
key points
RESISTANCE LEVEL 4056
SUPPORT LEVEL 4005
TARGET LEVEL1 3980
TARGET LEVEL 2 3940

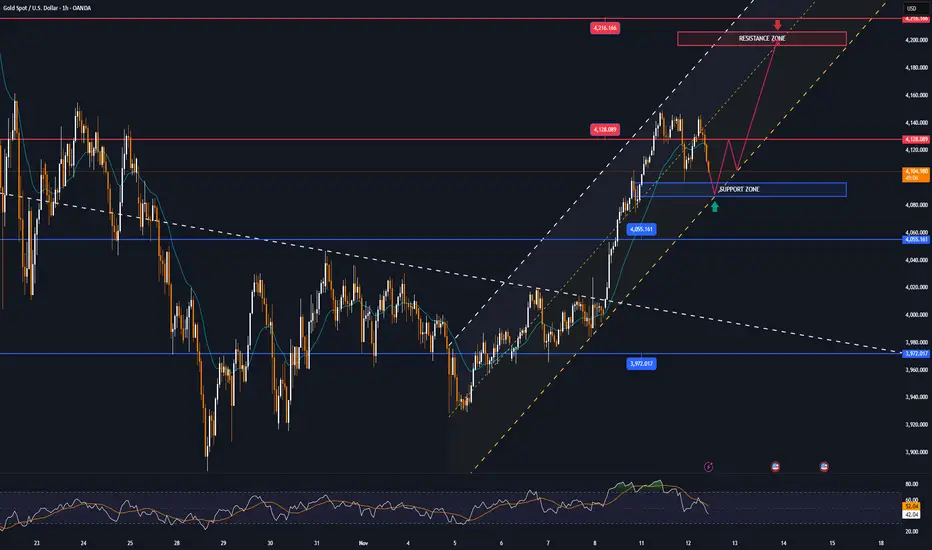
GOLD volatility, monetary policy and political riskThe global OANDA:XAUUSD went through a volatile trading session on Tuesday, as prices fell more than $50 in the North American session before recovering around $30, ending the day in the green. As of Wednesday morning, November 12, spot gold stood at around $4,128/ounce, up around $2 on the day.
The main drivers of this development came from two opposing factors: the prospect of the Federal Reserve (Fed) possibly cutting interest rates in December, and capital withdrawals from gold ETFs after a long rally.
Policy pressures and labor market signals
U.S. private payrolls data, according to preliminary estimates from ADP Research, showed a weekly average of 11,250 job cuts in the four weeks ended October 25. The weaker-than-expected figure sent the dollar to a low of 99.29, giving gold a chance to rebound.
The move comes just as Washington is about to end its longest government shutdown in history, which has stalled the release of economic data. Investors are hoping the reopening of the government will quickly bring a wave of pent-up data that will help better determine the true state of the U.S. economy.
“As the government reopens, we’re going to start seeing more cracks in the economy,” said Marc Chandler, chief strategist at Bannockburn Global Forex. This expectation reinforces the belief that the Fed will begin its easing cycle in December. According to the CME FedWatch tool, the probability of a rate cut has risen to 64%, while Fed Governor Milan hinted at the possibility of a 50 basis point cut due to a weak labor market and slowing inflation.
ETF Profit Taking, Gold Temporarily Adjusts
However, gold’s rally was capped by profit-taking in the ETF market. Bloomberg data shows gold ETFs have seen four straight weeks of outflows, after eight weeks of net buying. “Every 1% move in the gold price translates into about 10 tonnes of ETF outflows,” said Michael Haigh, head of FIC research at Société Générale.
The reversal reflects investors’ defensive sentiment after gold peaked at $4,380 an ounce in mid-October, a new record high amid political uncertainty and expectations of lower interest rates. Still, safe-haven demand was strong enough to help prices recover to $4,126.77 by the end of Tuesday’s session, up 0.3%.
US Politics: A lull ahead of data
The US Senate has passed a deal to reopen the government, while the Republican-controlled House is expected to approve it this week, before it goes to the White House for President Trump to sign into law. The reopening of the government not only ends the government shutdown but also sets the stage for a new cycle of data releases, including official jobs and inflation reports.
Medium-term outlook: Gold demand remains strong
Despite short-term volatility, fundamentals remain supportive of gold. The precious metal has risen more than 55% year-to-date, on track for its biggest gain since 1979. “The medium-term support from global easing to central bank demand remains intact,” said Christopher Wong, a strategist at OCBC.
Summary
The gold market is operating in a cycle of monetary policy expectations and geopolitical safe-haven sentiment. As the Fed moves closer to easing and delayed data looms, price volatility is likely to remain high.
However, with sustained central bank buying and global risks remaining intact, gold remains a strategic asset in a reshaping global financial landscape.
Technical analysis OANDA:XAUUSD
Gold prices are maintaining a short-term uptrend channel formed from the October bottom. After a deep correction around $3,970 – $3,850/ounce (corresponding to the Fibonacci levels of 0.382 and 0.5), the price has bounced back and is currently trading around $4,123, close to the technical resistance zone of Fib 0.236 at $4,128.
The moving average (MA21) is currently at $4,055, acting as a dynamic support zone in the short term. The recent candlestick structure shows that the bullish momentum is being consolidated with a series of higher lows, while the RSI has recovered towards 55, confirming that the bullish momentum is regaining the upper hand.
If gold holds above the $4,055 zone, the next upside targets are:
• Near resistance: $4,216 – $4,220 (psychological level and 0.236 Fibonacci resistance zone).
• Extended resistance: $4,308 – $4,380 (historic old peak zone).
On the contrary, if the price loses $4,055, the $3,972 – $3,846 zone will become the main support zone to watch, corresponding to the lower boundary of the current uptrend channel.
The overall trend remains bullish, provided the $4,055 support zone holds. The current phase is a recovery accumulation phase, which could open up a further rally towards $4,300 if US economic data continues to be weak and the Fed reinforces easing expectations.
SELL XAUUSD PRICE 4201 - 4199⚡️
↠↠ Stop Loss 4205
→Take Profit 1 4193
↨
→Take Profit 2 4187
BUY XAUUSD PRICE 4090 - 4092⚡️
↠↠ Stop Loss 4086
→Take Profit 1 4098
↨
→Take Profit 2 4105
Buy XAUUSDTaking chances with XAUUSD here at 4008. We could see price rise to 3189 judging from this falling channel pattern and resting buy side liquidity

What I See on Your Chart. xauusd1) Upper Supply Zone – 4211 to 4247
Price has previously reacted strongly here.
Your green projection shows a possible bullish move back into this zone.
If price breaks above 4149–4141, then a move toward 4211–4247 becomes likely.
2) Mid-Level Zone – 4104 to 4097
This is where price is currently hovering (4085 area).
You have three possible projections:
Green arrow: Minor bounce → then bullish continuation.
Red arrow: Sharp drop after a small pullback.
Blue arrow: Deeper drop into lower support.
This means you’re watching for confirmation on whether this zone acts as support or fails.
3) Lower Demand Zone – 4046 to 4038
Blue arrows show the move toward this deeper liquidity pool.
This is your downside target if 4097 fails.

Gold price continues to recover, accumulating above 4200⭐️GOLDEN INFORMATION:
Gold (XAU/USD) trades higher near $4,185 in early Asian hours on Friday, supported by expectations that the reopening of the US government will resume economic data releases and strengthen bets on additional Fed rate cuts.
The longest shutdown in US history ended on Thursday after President Trump signed a funding bill, which passed the House in a 222–209 vote with broad Republican support and a few Democratic votes. Investors now expect upcoming post-shutdown data to show labor market softness, potentially pressuring the US Dollar (USD) and providing near-term support for the USD-priced metal.
⭐️Personal comments NOVA:
Gold price is still in an uptrend, recovering above 4200. Liquidity scan of H1 breakout price zone 4147 completed and recovered.
⭐️SET UP GOLD PRICE:
🔥SELL GOLD zone: 4288 - 4286 SL 4293
TP1: $4270
TP2: $4255
TP3: $4240
🔥BUY GOLD zone: 4100 - 4102 SL 4095
TP1: $4115
TP2: $4130
TP3: $4145
⭐️Technical analysis:
Based on technical indicators EMA 34, EMA89 and support resistance areas to set up a reasonable BUY order.
⭐️NOTE:
Note: Nova wishes traders to manage their capital well
- take the number of lots that match your capital
- Takeprofit equal to 4-6% of capital account
- Stoplose equal to 2-3% of capital account

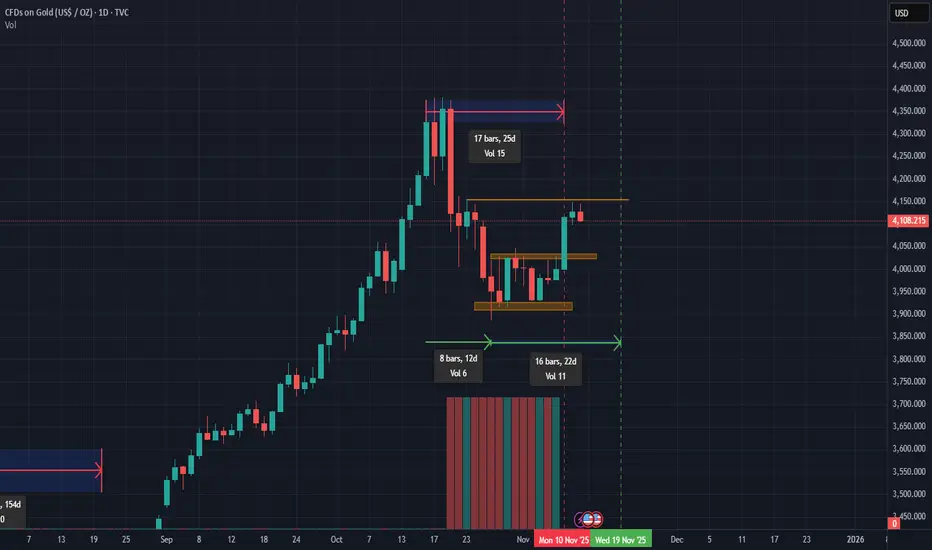
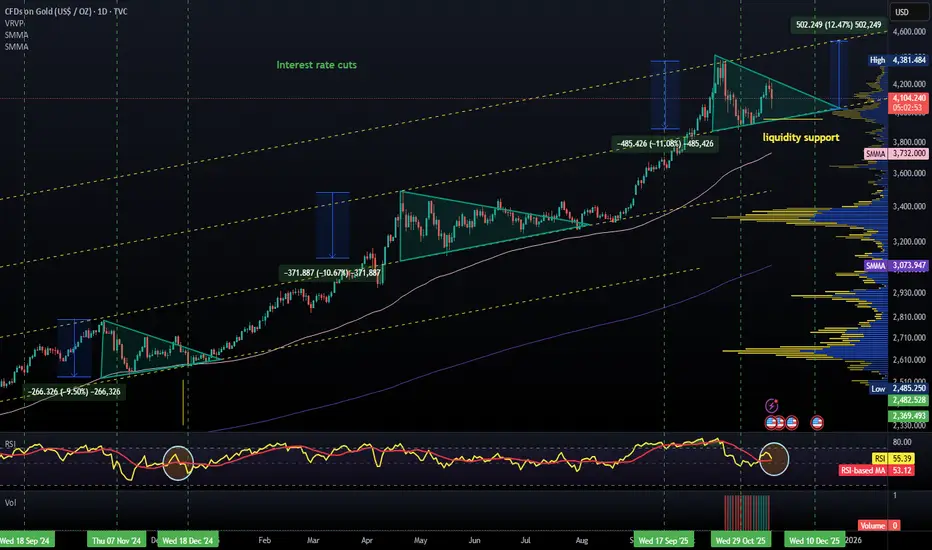
Gold repeating pattern, return to ATH and aboveGold will return to its all time highs in the near future.
1) Interest rate cuts
2) Distrust in Trump
3) Distrust in USD
4) Venezuela conflict may happen
5) Government shutdown over and economic data could be negative
6) Michael Burry seems to be quite confident in recession coming, Buffet holds record cash
XAUUSD Analysis – Major Buy Zone Reached!Gold (XAUUSD) has finally tapped into the key demand zone between $4,000 – $4,020, a level that previously acted as a strong reaction point.
This zone has now been respected again with a clean liquidity grab below recent lows.
🔍 Market Breakdown
Price has been in a steady decline after rejecting the supply zone around $4,130 – $4,150 (highlighted red).
Today, we saw a sharp wick down into the green demand zone, showing buyer presence and absorption of sell-side liquidity.
FOMC and USD news lined up ahead increases volatility, but also increases the probability of a strong reversal from this zone.
📌 My Bias
I’m expecting: 1️⃣ A small corrective dip or retest back into the green zone
2️⃣ A strong bullish rally targeting the supply zone above
3️⃣ Final target around $4,130 – $4,150 if momentum holds
🎯 Buy Targets
Entry Zone: 4000 – 4020
TP1: 4075
TP2: 4130 (Main Target)
TP3: 4150 (Extended)
SL: Below 3985
⚠️ Why This Setup Makes Sense
Price swept liquidity beneath the previous lows
Buyers responded strongly from the demand zone
USD weakness expected around major news events
Clean imbalance above waiting to be filled
Strong bullish structure still intact on higher timeframes
💬 Engagement Question
Do you think Gold will respect this demand zone and push upward, or will news drag it lower?
Drop your opinion in the comments!👇🔥
If you want me to break down the next move after the news release, just comment “Update” and I’ll post a follow-up. 📈💬

XAU/USD Market Outlook — Bullish Move From 4,058.36 ZoneGold has retraced into a major demand zone around 4,058.36, where price has shown the first signs of bullish reaction after clearing liquidity below previous lows. This zone aligns with a prior accumulation block and serves as the origin of the last major bullish swing.
As long as price holds above this level, I expect a bullish continuation toward the upper liquidity region, with targets around 4,244.86, and ultimately the major high at 4,381.73.
My stop loss is positioned at 3,887.60, below the deeper demand zone and previous structural low, ensuring safety from intraday volatility while maintaining the bullish structure.

XAUUSD - Buy SetupTimeframes Used: Monthly → Weekly → Daily → 4H
Current Market Condition:
XAUUSD is a valid trade according to my system rules:
Monthly: Price is above the Cloud → Bullish
Weekly: Price is above the Cloud → Bullish
Daily: Price is above the Cloud → Bullish
----------------------------------------------------------------------------------------------------------------
Currently in trade on 4hr timeframe:
Entry: 4111.02
Stoploss: 4010.79
TP: Aiming for 1:5 risk to reward
---------------------------------------------------------------------------------------------------------------v

XAUUSD Long: Ascending Channel Targets Retest of $4,230 SupplyHello traders! XAUUSD has recently shown a clear bullish recovery structure after forming a strong base within the Demand Zone around $4,120–$4,130, where price previously reacted multiple times. This area also aligns with the lower boundary of the Ascending Channel, confirming it as a key decision point for buyers. Earlier, Gold formed a Double Top pattern near the $4,230–$4,240 zone, which acted as a pivotal Supply Area and triggered a sharp correction. Following that, the market produced two notable fake breakouts below support — liquidity sweeps that failed to establish a bearish continuation. Each failed breakdown was followed by strong buying pressure, signaling active demand.
Currently, after touching the Fibonacci Pivot Point, price reversed and re-entered the Ascending Channel, where bulls regained control. The current movement shows Gold pulling back from the Supply Line near $4,200–$4,230, suggesting that sellers are defending this zone, but the overall structure still favors buyers as long as the price remains above the channel support. At the moment, XAUUSD is approaching the confluence area between the Supply Zone ($4,200–$4,230) and the Supply Line, which represents a major reaction level. A clean breakout above this region would confirm bullish continuation, while a rejection could trigger another correction back toward the Demand Zone.
My scenario as XAUUSD holds above the $4,120–$4,130 Demand Zone, the bullish structure remains intact. The next upside objective sits around $4,200–$4,230, where both the Supply Line and key resistance meet. A successful breakout and close above $4,230 would confirm bullish continuation, opening the door for a move toward $4,260–$4,280 in the short term. However, if price rejects the supply area, a pullback toward $4,150–$4,130 is possible — an area where buyers may re-enter. A break below $4,120 would invalidate the bullish scenario and signal deeper correction toward $4,080–$4,060. For now, the structure favors buying pullbacks within the ascending channel, as long as price remains above key demand. Manage your risk!

XAUUSD DROPS BELOW $4,100 WHAT NEXT?XAUUSD price dropped below the $4,100 level on Friday’s trading session. This sparks reactions from traders. Are we going to see further selling pressure or it’s just a mere drop in price? From my own point of view, I expect more drop in price. I anticipate more bearish price action to develop away from this market. I’m selling short on Gold.

XAUUSD_5M_BuyShort-term gold analysis The market can enter an upward correction by completing five down waves The most important number for the up wave is $4,100 and only by maintaining this number can the market become bullish.

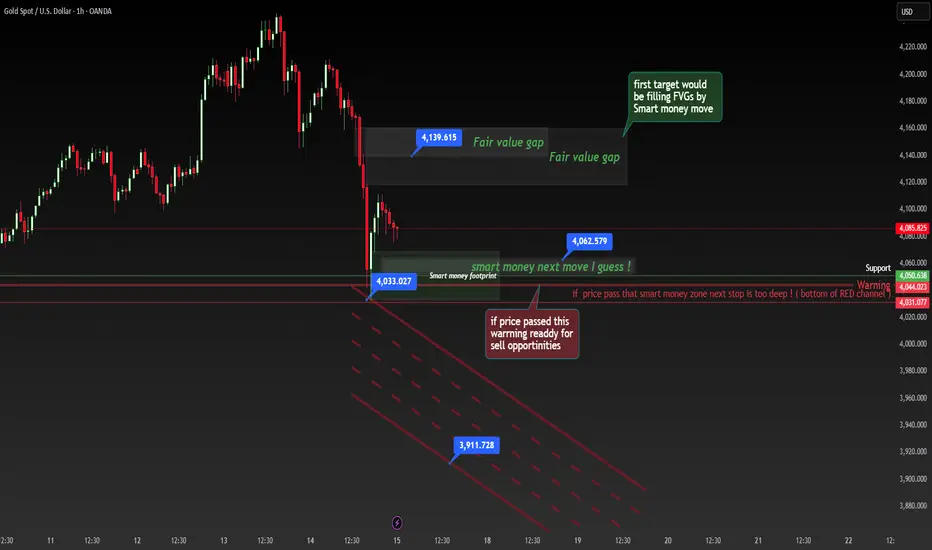
Smart Money Roadmap: Gold’s Next Move Mapped OutGold is currently reacting inside a high-impact Smart Money footprint zone after a strong bearish move. Price has left multiple Fair Value Gaps (FVGs) above, suggesting a potential short-term bullish correction as institutions rebalance inefficiencies. The first logical target is the upper FVG zone around 4,139, where price may face strong resistance.
Below, a critical Smart Money support area around 4,033 – 4,062 is acting as a decision point. If price holds above this zone, we could see a healthy pullback toward FVG imbalances. But if price breaks below the Smart Money support and crosses into the warning region, the next downside target aligns with the channel projection near 3,911, opening the door for deeper sell opportunities.
Gold has printed a strong bearish leg, leaving behind clear Smart Money footprints. The current zone around 4,033 – 4,062 is a key institutional support area. As long as price respects this zone, Smart Money may push into the upper Fair Value Gaps (FVGs) around 4,139, which would be the first target for a corrective move.
However, a break below the Smart Money zone triggers a major warning. If price falls into the red channel, it opens clean sell opportunities with a downside projection toward 3,911. This level lines up with the bottom of the descending channel and represents a deeper liquidity target.
🟢 Bullish bias → only if price respects the Smart Money support and moves to fill upper FVGs.
🔴 Bearish continuation → if price breaks below the warning zone and enters the channel.
This analysis is based on Smart Money Concepts (SMC), Fair Value Gaps, liquidity levels, and institutional price behavior.
After Multiple 4150 Rejections, Gold Eyes Support at 40501. What Happened Yesterday
After an intraday correction, Gold once again tested the 4150 resistance zone, then pulled back toward 4100, only to rebound and touch 4150 again later in the session. Each attempt to break higher was rejected, sending the price back toward interim support.
2. Market Context
Multiple failed breaks above 4150 suggest that the market is not yet ready to extend the rally from Monday. The current price action points to a likely continuation of the correction, as the market digests the strong bullish move from earlier in the week.
3. Technical Outlook
The 4045–4060 zone stands out as a key confluence support, aligning with previous resistance and short-term rising trend line. A dip into this area would be a healthy pullback within the broader uptrend and could attract renewed buying interest from bulls.
4. Trading Plan
My preferred approach is to buy dips into 4045–4060, with invalidation below 4030. This setup offers an attractive risk-reward profile, targeting a retest of 4150 on the next bullish leg.
As long as the support zone holds, the bullish structure remains intact and upside continuation remains the higher-probability scenario.
5. Conclusion
Gold is consolidating after its sharp rally, and short-term correction is part of the process. I remain bullish above 4040-4050 zone, expecting buyers to step back in near support and potentially push for another test of 4150 soon. 🚀

Gold Extends Its Downward Pressure Amid Clouded MomentumHello everyone, I see gold still holding its downward pace after forming a top around 4,230–4,250 USD/oz, now hovering near 4,030 USD/oz — trading below the Ichimoku cloud and squeezed between several unfilled Fair Value Gaps, signalling that the market may be rebalancing liquidity before choosing a clearer direction. After the strong surge earlier this month, corrective pressure has returned, pushing price toward the short-term support zone at 4,000–3,980 USD/oz — an area that overlaps with previous green FVGs and where buying reactions typically appear. On the upside, 4,070–4,100 USD/oz has turned into a key resistance region where price has repeatedly attempted to break but failed. Only a decisive breakout above this zone would restore the short-term bullish structure; otherwise, losing 3,980 could open the door for further downside.
On the news front, gold continues to face weight from fading expectations of a Fed rate cut next month, a strengthening US dollar, and the return of risk-off sentiment, all of which leave the metal struggling for momentum. The probability of a 25-basis-point cut, according to CME FedWatch, has sharply fallen from 61.9% to 39.8%, while the likelihood of unchanged rates has climbed to 60.2%. This extends the pressure on gold — a non-yielding asset — while the dollar benefits more clearly. The prolonged government shutdown in the US has also delayed key inflation and labour reports for October, leaving the Fed with less evidence to support a firmer forward-guidance message. Meanwhile, Chair Powell’s cautious stance reinforces the view that higher rates will persist for longer, adding further strain to gold.
Based on both technical and macro factors, I feel this could be gold’s final corrective phase before the market finds equilibrium again. I expect price to ease toward 3,990–3,970 USD/oz to “test” liquidity — an area where demand historically returns. If buyers step in as before, gold could rebound toward 4,100–4,150 USD/oz, and once above 4,150, the next target expands toward 4,200–4,250 USD/oz.

Marginal weakening of macroeconomic negative factorsDigestion of hawkish remarks from the Federal Reserve: Previously, Fed officials issued a series of signals indicating "no immediate rate cut", causing the probability of a rate cut in December to drop from 66% to below 50%, but the market has now fully absorbed this negative factor. The impact of further hawkish statements from the Fed will weaken. Moreover, the core PCE in the US has continued to fall to 2.8% in October, indicating weak economic data, which still leaves room for long-term rate cuts. The negative factors are unlikely to continue to intensify.
The retreat of risk aversion has slowed down: The short-term negative factors such as the US government shutdown and the easing of the geopolitical situation in Venezuela have been released. Potential risks such as the situation in the Middle East and the crisis in the Red Sea shipping route still exist. The market's sensitivity to negative factors has decreased, and there is no new catalyst for the decline.
Gold trading strategy
buy:4000-4010
tp:4020-4030
sl:3990