GOLD NOVEMBER 15, 2025Trading plan for next week, November 17-21, 2025.
Key levels to watch out:
Demand Zone at 4,004.
SBR at 4,110.
POC at 4,128 and 4,199.
Supply Zone at 4,160 to 4,170.
Resistance / Golden zone (Fibo 0.618) at 4,143 to 4,148.
Swing Trade: Buy at demand zone.
Trade ideas

Lingrid | GOLD Possible False Breakout - Correction Setup OANDA:XAUUSD has extended its rally after a clean breakout from the range zone, now testing a confluence area near 4,155 within the resistance zone. The structure forms a steep upward channel with a potential short-term exhaustion pattern near the upper boundary. If price fails to sustain above 4,150, a corrective pullback toward 4,065–4,000 could unfold. The broader momentum remains bullish but stretched, suggesting a possible pause before continuation.
⚠️ Risks:
A breakout above 4,150 could accelerate momentum toward 4,220.
Softer U.S. inflation data may weaken USD and fuel further gold demand.
Rising geopolitical tensions could boost safe-haven inflows, invalidating pullback scenarios.
If this idea resonates with you or you have your own opinion, traders, hit the comments. I’m excited to read your thoughts!


GOLD next move possible! Price will retest the resistance levelGold analysis next target :
Chart Details
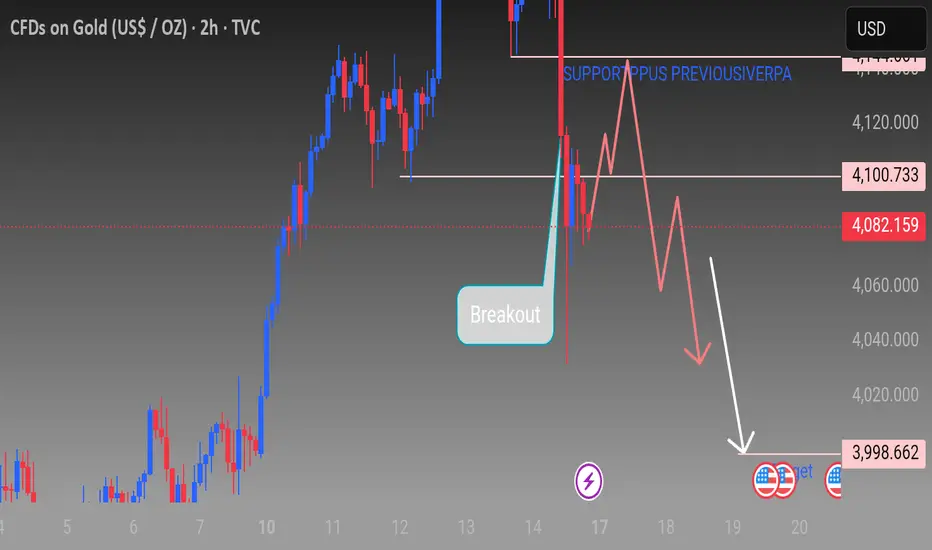
- *Instrument*: CFDs on Gold (US$/OZ)
- *Timeframe*: 2 hours
- *Platform*: TradingView (TVC)
- *Current Price*: $4,082.159 (down -88.991 or -2.13%)
- *Sell/Buy Prices*:
- Sell: $4,082.159 with 1,922
- Buy: $4,084.081
Chart Analysis
- *Trend Indication*: A downward trend is shown with an arrow pointing towards $3,998.662.
- *Breakout*: A breakout is marked on the chart.
- *Support/Resistance*:
- Support plus previous resistance area is marked around $4,100.733.
- Current price ($4,082.159) is below this level.
Other Chart Elements
- *Price Levels*: Prices ranging from $3,998.662 to $4,125.000 are shown on the right side of the chart.
- *Candlestick Chart*: The chart displays red and blue candlesticks indicating price movements.
Please drop your comments below if you found it helpful thanks
Gold in down correctionPrevious analysis was correct. and unfortunately, I close it manually.
Expecting a continued downtrend to 3850 for a swing trade.
Selling at current price and placing a pending sell order at 4175, with a first target of 4098. SL at 4192. Refer to the chart for prices.Once 4098 is hit, I'll move the SL to entry. Looking for a further push down to 3920, then 3850. Will update as the trade progresses.

XAUUSD | Consolidation and Anticipation of Fed Data📈 Gold Market Analysis: Consolidation and Anticipation of Fed Data
The gold market (XAU/USD) experienced a relatively flat and sideways trading session on Monday, consolidating between the key levels of $4103 and $4055. This movement occurred after the precious metal experienced a sharp 2% decline in the previous trading session, reflecting investor caution.
Investors are currently adopting a wait-and-see approach, awaiting the release of important economic data from the United States. This data is crucial because it will provide new clues regarding the Federal Reserve's (Fed) interest rate policy path. Expectations regarding monetary tightening or, conversely, a rate cut will significantly impact US bond yields and the value of the US dollar, which in turn will determine the direction of gold prices.
📌 Technical Outlook and Key Levels
Gold is currently consolidating firmly within a key pivot range.
Bearish Update:
The primary bearish focus lies at the $4055 support level.
A clear breakout and close of the 1-hour candle (1H close) below this support is expected to trigger a further wave of bearish momentum.
The next downside target is the minor support level of $4013, followed by the more significant support at $3979.
Sustaining the price below $4055 will maintain a downside bias.
Bullish Update:
To reverse momentum, gold needs to break through the key resistance level at $4103.
A convincing breakout, confirmed by a 4-hour candle (4H close) closing above $4103, would signal a shift in momentum to the bullish side and a price recovery.
This would pave the way towards the next resistance target located at $4148.

XAUUSDPrice Action Trading is a method of financial market analysis where traders make buying and selling decisions solely based on the asset's price movements over time, without relying on technical indicators.
It's essentially the art of reading a "naked" or clean chart to understand the psychology and behavior of market participants.

Lets move up to 4140 TP and then shoot back down. Gold Bearish..As the market is busy making equal legs to 4140 TP level and shoot back down.
Lets make money and enjoy the ride.
Good Luck Traders.!!

The gold price correction is not over yet! Short gold.Last week, gold experienced a breathtaking rollercoaster ride. At the opening bell, gold prices surged and held firm above the psychological level of $4,000. Bulls, like galloping steeds, launched a new and fierce offensive, once aiming for the historical high set last month, reaching a peak of around $4,245. The market seemed to be ignited with the flames of a raging bull market. A series of hawkish signals from Federal Reserve officials, their words like thunderclaps, shook the market, abruptly cooling sentiment. Gold prices plummeted, erasing all previous gains, and ultimately closed around $4,085, leaving a trail of disappointment.
The gold market has been caught in a period of intense volatility due to the uncertainty surrounding Federal Reserve policies and a lack of US economic data, leaving both bulls and bears relentlessly battered. Such extreme two-way fluctuations were nothing short of a brutal baptism for traders, especially those investors who habitually blindly bought the dip and ignored stop-loss discipline, who suffered heavy losses. Here I solemnly remind you: when the market is turbulent and the direction is unclear, do not rush into the market. It is better to observe the situation calmly, watch more and act less, and always face every breath and pulse of the market with a sense of awe. Regarding trading strategies!
Regarding trading strategy:
I plan to place short orders in batches within the 4075-4095 range, waiting for the gold price to weaken during a rebound. The key support level to watch is the 4030-4050 area. If this level is breached, gold may begin a new downward trend, heading towards a deeper technical correction.
The above are my personal thoughts! If they are helpful to you or your ideas align with mine, please like and follow to show your support! All strategies have a limited lifespan, so while referring to them, you should also closely monitor market changes. I will also respond flexibly based on actual market fluctuations, and I will announce specifics in the channel!

XAU/USD Bullish trend buying from support zone📈 GOLD – New Bullish View | 1H Timeframe
Gold is showing fresh bullish momentum, respecting the 4160 support zone and pushing upward.
🎯 Technical Targets:
4191
4207
Price action remains strong above support, indicating potential continuation of the uptrend. As always, market conditions can shift—stay alert.
⚠️ Risk Management:
Use proper lot sizing, set clear stop-loss levels, and never overleverage. Discipline is key.
If you found this analysis useful, Like, Follow, Comment & Share to support the page!

Gold in Buy═════════════════════════════════════════════════
🏆 GOLD ANALYSIS - MONDAY, NOV 17, 2025
SATHAYAM_ACADEMY Daily Update
⏰ SESSION: 9:00 AM - 4:30 PM IST
📊 MARKET RECAP:
✅ Morning: Strong SELL signal (-25 pips)
Result: +$225 profit locked in!
❌ Midday: Sideways trap zone (avoid)
Action: Protected capital + waited
═════════════════════════════════════════════════
🎯 MARKET STRUCTURE ANALYSIS:
Historical Swing Low: 4,032.230
├─ +78 point target (swing OB): 4,111.185 ✅
├─ +50 point target (discount OB): 4,099.760 ✅
├─ -25 point correction: 4,070.935 ✅
Current Price: 4,083.270 (trap zone)
#Trading #Gold #XAUUSD #Sathayam_Academy #SmartMoney #StructureTrading #Discipline
═════════════════════════════════════════════════
📈 THREE-TIER ENTRY STRATEGY:
TIER 1 - OVERNIGHT TRADE (Set & Forget):
├─ Entry: BUY LIMIT 4,041
├─ SL: 4,028 (13 pip stop)
├─ Target: 4,111.185 (+70 pips!)
├─ Ratio: 1:5.4 (EXCELLENT!)
├─ Type: Swing structure buy
├─ Timeframe: Overnight/this week
└─ Status: Passive order ⏳
TIER 2 - TODAY'S PRIMARY (London Open):
IF +50 target 4,099.760 hits FIRST:
├─ Entry: BUY LIMIT 4,057-4,054
├─ SL: 4,048 (6-9 pip stop)
├─ Target: 4,100-4,120
├─ Ratio: 1:3+ (GOOD!)
├─ Type: Premium zone buy
├─ Confirmation: +50 point level confirmed
└─ Action: ENTER IMMEDIATELY ✅
TIER 3 - ALTERNATIVE (If reversal first):
IF -25 target 4,070.935 hits BEFORE +50:
├─ Entry: SELL LIMIT 4,085-4,080
├─ SL: 4,097 (12-17 pip stop)
├─ Target: 4,050-4,040
├─ Ratio: 1:2.5+ (GOOD!)
├─ Type: Correction sell
├─ Confirmation: -25 point level confirmed
└─ Action: SELL CORRECTION ✅
═════════════════════════════════════════════════
📊 EXECUTION LOGIC:
⏰ RIGHT NOW (4:22 PM):
├─ TIER 1: Place BUY LIMIT 4,041 (overnight)
├─ MONITOR: Price action for next 30 mins
└─ WAIT: London open direction signal
🎯 WHEN LONDON OPENS (4:30 PM+):
├─ IF price breaks UP to +50 zone
│ └─ TIER 2: Place BUY 4,057-4,054
├─ IF price drops to -25 zone
│ └─ TIER 3: Place SELL 4,085-4,080
└─ IF sideways continues
└─ CLOSE DAY: Protect +$225 profit
═════════════════════════════════════════════════
💡 KEY RULES:
✅ TIER 1 active 24/7 (overnight hold)
✅ TIER 2 enters IF +50 confirms first
✅ TIER 3 enters IF -25 confirms first
✅ NEVER both TIER 2 & 3 at same time
✅ Choose direction based on first signal
✅ Capital protection ALWAYS first
═════════════════════════════════════════════════
📈 TODAY'S LESSON:
1. Multiple OB levels = Multiple opportunities
2. Swing OB (+78) = Long-term hold potential
3. Discount OB (+50) = Higher probability today
4. Correction level (-25) = Safety exit/reversal
5. Set & forget orders = Passive income mindset
═════════════════════════════════════════════════
🏆 TODAY'S RESULTS:
Morning Trade: +$225 ✅
Discipline: 100% ✅
Capital Protected: YES ✅
Framework Validated: YES ✅
Community Learning: MAXIMUM ✅
═════════════════════════════════════════════════
Remember:
"Patience = Profit"
"Structure = Edge"
"Discipline = Freedom"
Stay disciplined. Stay profitable. 💪💙
═════════════════════════════════════════════════

Fundamental analysis of Gold (XAU/USD)GOLD
Here’s a fundamental analysis of Gold (XAU/USD)
1. Interest Rates & Real Yields
One of the biggest drivers of gold is real interest rates (nominal interest rates minus inflation). When real yields are low or negative, gold becomes more attractive since it carries no coupon. In recent weeks, growing expectations that the Federal Reserve will cut interest rates have boosted gold’s appeal. For example, analysts see a high probability of a Fed rate cut in December.
Also, as long-term inflation remains stubborn, the “opportunity cost” of holding gold (rather than interest-earning assets) is lower, which favours gold.
---
2. U.S. Dollar Strength & Currency Effects
Gold is priced in U.S. dollars, so a weaker dollar typically supports higher gold prices (foreign buyers get more gold for their money). Recently the dollar has shown some weakness, which helps gold.
Conversely, if the dollar strengthens sharply (for example because of safe-haven flows into USD or a surprise strong US economy), that could temper gold’s upside.
---
3. Central Bank & Institutional Demand
Central banks around the world continue to buy gold as part of reserve diversification and as a hedge against currency risk. This structural demand supports gold’s medium- and long-term fundamentals.
At the same time, investment flows (via ETFs, etc.) are rising, showing that institutional investors are leaning into gold. This adds to upward pressure.
---
4. Geopolitical & Macro Risk Premium
Gold is still viewed as a “safe-haven” asset. Elevated geopolitical risks, recession fears, or inflation shocks tend to push investors into gold. Reports suggest the current market environment — with elevated macro risks — favours gold’s role as a hedge.
So, if new shocks (trade, geopolitics, monetary policy) emerge, they could accelerate the move upward.
---
5. Supply, Demand & Inflation Dynamics
While gold supply (mining + recycling) is relatively stable, demand from investment and central banks is increasing — tightening the balance somewhat.
Meanwhile inflation remains elevated in many economies, which supports gold’s appeal as a store of value.
---
6. Key Fundamental Takeaways (Bullish Scenario)
If the Fed begins cutting rates, real yields fall → gold rises.
If the dollar weakens further, that boosts gold’s dollar-price.
If central banks amplify gold purchases and investment flows remain strong, that structural demand underpins prices.
If geopolitical or macro risks increase, gold benefits from the safe-haven bid.
Together, these suggest a favourable environment for gold to continue its up-trend.
---
7. Key Risks / What Could Go Wrong
If inflation falls rapidly and the Fed holds firm or even raises rates, real yields may rise → that would pressure gold.
If the dollar strengthens significantly (e.g., due to strong US growth or safe-haven demand), gold could face headwinds.
A sudden improvement in global risk appetite might shift flow away from safe assets like gold.
Supply-side overshoot or substitution into other assets could dampen inflows.

XAU/USD 17 November 2025 Intraday AnalysisH4 Analysis:
-> Swing: Bullish.
-> Internal: Bullish.
Analysis and bias remains the same as analysis dated 20 October 2025.
Price has printed as per previous intraday expectation by printing a bearish CHoCH which indicates, but not confirms, bullish pullback phase initiation.
Price is currently trading within an established internal range, however, I will continue to monitor price with regards to depth of pullback.
Intraday expectation:
Price to continue bearish, react at either discount of 50% internal EQ, or H4 supply zone before targeting weak internal high priced at 4,380.990.
Note:
The Federal Reserve’s sustained dovish stance, coupled with ongoing geopolitical uncertainties, is likely to prolong heightened volatility in the gold market. Given this elevated risk environment, traders should exercise caution and recalibrate risk management strategies to navigate potential price fluctuations effectively.
Additionally, gold pricing remains sensitive to broader macroeconomic developments, including policy decisions under President Trump. Shifts in geopolitical strategy and economic directives could further amplify uncertainty, contributing to market repricing dynamics.
H4 Chart:
M15 Analysis:
-> Swing: Bullish.
-> Internal: Bullish.
As per analysis dated 14 November 2025, price has printed a bearish CHoCH to indicate, but not confirm bearish pullback phase initiation.
Price is currently trading within an established internal range.
Intraday expectation:
Price to trade down to either discount of 50% internal EQ, or M15 demand zone before targeting weak internal high, priced at 4,245.195
Note:
Gold remains highly volatile amid the Federal Reserve's continued dovish stance, persistent and escalating geopolitical uncertainties. Traders should implement robust risk management strategies and remain vigilant, as price swings may become more pronounced in this elevated volatility environment.
Additionally, President Trump’s tariff announcements, particularly against China, are expected to further amplify market turbulence, potentially triggering sharp price fluctuations and whipsaws.
M15 Chart:

Gold Traders Beware | Sell the Trap, Buy the Expansion💥 GOLD: Smart Money is setting the trap! 💰 Expect a dip to 🟩 3800 before the $5,100 breakout. Don’t chase — position smart. 🚀
Gold has been unstoppable — printing higher highs and leaving emotional traders behind.
But now… the Smart Money trap is loading ⚠️
Price has tapped into the 🟥 4160–4220 premium zone , where liquidity is stacked and institutions quietly prepare their next move. Before the massive bullish rally to $5,100+ , expect one last shakeou t — a dip engineered to flush retail longs and reload institutional buys near 🟩 3880–3800.
The crowd will panic. The pros will accumulate. Stay patient, trade smart. 🧠✨
📊 Smart Money Breakdown:
🧠 Institutional Playbook:
Liquidity resting above recent highs 🧲
🟥 4160–4220 = Smart Money Distribution Zone
🟩 3880–3800 = Discount Reaccumulation Zone
Expect a fake-out drop → explosive bullish reversal
💡 Trade Plan:
🔻 Sell Zone: 🟥 4,161 – 4,219
🎯 Targets: 🟩 3,880 – 3,800 (ideal long re-entry area)
🚀 Ultimate Target: $5,100+ (once discount OB holds)
🟨 Price Action Confluences:
Liquidity sweep above structure highs 🩸
Fair Value Gap + Order Block alignment ⚙️
Higher-timeframe BOS still intact 💪
Elliott-style wave 2 correction before next expansion 🌊
🧭 Bias Overview:
🟥 Short-term: Controlled bearish correction
🟩 Mid-term: Explosive bullish continuation → $5,100+
💭 Mindset: Trade the trap — not the emotion .
⚠️ Disclaimer:
This content is for educational and informational purposes only.
It does not constitute financial advice.
Always apply your own analysis and risk management before trading. 💡
🔥 Follow for Smart Money + Price Action setups the big banks don’t share!
💬 Comment below — are you selling the trap or waiting to buy the dip?
⚡ Let’s ride the Gold move together — with precision, not emotion.
#Gold #XAUUSD #SmartMoneyConcepts #PriceAction #LiquiditySweep #OrderBlock #SwingTrading #Commodities #GoldAnalysis #FVG #TradingView #InstitutionalTrading #MarketStructure #GoldForecast #Forex

XAU/USD – Rebalancing Structure, Support Zone Holding Steady⏰ Timeframe: 30m
📅 Update: 17/11/2025
🔍 Market Context
After the extended decline late last week, gold is gradually stabilizing around the 4,050–4,080 USD zone, showing a positive reaction at the structural support zone.
The recent Break of Structure (BOS) sequence indicates that the selling momentum is gradually weakening, while the newly formed Order Block is acting as a temporary balance for the market.
The current structure slightly leans towards a technical recovery, as buying flows are returning around the main support zone.
📊 Technical Structure
Support Zone (4,049–4,080 USD): a critical support zone, confluencing with the previous liquidity bottom.
Order Block (4,096–4,115 USD): a short-term supply-demand area, potentially a retest point before the price expands higher.
Resistance Zone (4,145 USD): the first intermediate level to overcome to confirm upward momentum.
Target Zone (4,210 USD): the upper liquidity zone, corresponding to the potential expansion mark of the recovery wave.
🎯 Market Outlook
Priority scenario for the day:
1️⃣ Gold may retest the Order Block zone 4,096–4,115 USD before forming the first push up to 4,145 USD.
2️⃣ If buying pressure is maintained and this resistance zone is broken, the expansion momentum may head towards 4,210 USD, corresponding to a higher liquidity zone.
3️⃣ Losing the 4,049 USD mark will invalidate the recovery structure and bring the market back to a lower balance zone.
🧠 Analyst’s View
The market is currently in a reaccumulation phase after a strong correction.
Buyers still maintain a technical advantage as long as the price remains above the 4,049 USD support zone.
Observing price behavior around the Order Block and the 4,145 USD zone will be key signals to confirm the strength of this recovery wave.
🛡️ Risk Note
The current phase is a “pullback phase” within the larger structure.
Traders should wait for clear price behavior confirmation at technical zones rather than predicting movements in advance.

LiamTrading – XAUUSD H1 | Continue to watch for SELL at the ...LiamTrading – XAUUSD H1 | Continue to watch for SELL at the start of the week – wait for price to retrace to the trendline & resistance for a perfect entry
Gold is experiencing a sharp decline as the global market faces liquidity pressure. The simultaneous drop in gold, stocks, and Bitcoin indicates that money is being pulled out of risky assets and even safe havens, similar to tense periods like the 2008 crisis or the early 2020 pandemic. Investors are selling profitable assets to cover losses elsewhere.
In the long term, gold typically recovers sooner, but in the short term, the downtrend still prevails.
On H1, the price is below the descending trendline, under the 4100 resistance, and is moving in a clear Lower High – Lower Low structure. This is a good signal to continue prioritizing SELL orders retracing to resistance.
🔍 Technical Analysis (Trendline • S/R • Fibonacci • Liquidity)
The descending trendline is the biggest barrier; each time the price touches the trendline, it is strongly rejected.
Main Resistance:
4098–4100: resistance zone + confluence with trendline.
4120–4130: stronger zone if price retraces deeply (close to Fibo 0.382).
Target Support:
4065: intermediate support – where the price has bounced slightly several times before.
4040 – 4025: large liquidity zone – confluence with the bottom of FVG H1.
3985–3995: the end zone of the down wave if selling pressure expands.
Liquidity Zone:
Many liquidity sweep bottoms continuously → indicating selling pressure still prevails.
The lower FVG zone (around 4025–4040) is highly likely to be filled this week.
📉 Trading Scenario (prioritize SELL retrace)
Scenario – SELL retrace to trendline + resistance (priority)
Entry: 4098–4100
SL: 4106
TP: 4088 → 4065 → 4040 → 4025
💡 Suggestion: Wait for M5–M15 to form a rejection candle (pin bar / bearish engulfing) before executing the order.
When to BUY?
Only BUY if:
H1 closes a candle above 4120, breaking the descending trendline → short-term trend phase change.
If this signal is not present → do not rush to buy against the trend.
⚠️ Important Note
The phenomenon of “selling everything to hold cash” may continue → gold may continue to face pressure in the short term.
Which price zone are you watching for today's session?
Comment below & Follow LiamTrading channel for the fastest updates!


Gold bullish breakout targeting 4140Gold price is showing strong bullish momentum, breaking above key resistance and turning it into support. Current price action suggests a possible pullback to the buy zone near 4,100 before targeting the next level at 4,140.

XAU/USD - NEW HIGHS? $4550 TargetLooking at more longs on GOLD here will update in this comment section on lower timeframe setups once we get confirmation !

XAU/USD Bearish Pressure Builds as Price Retests Breakdown ZoneGold continues to show strong bearish momentum on the H1 timeframe as price fails to reclaim the 9-EMA and keeps rejecting the descending trendline. After breaking down from the major distribution zone around 4,230 – 4,260, XAU/USD is now forming a weak corrective pullback — a typical setup before a continuation drop.
The current structure is clearly bearish with a sequence of lower highs – lower lows, and the retest of the breakdown zone suggests sellers are still in control.
Key Technical Levels
Resistance Zones
4,115 – 4,120: Retest zone + descending trendline + EMA9
4,140: Dynamic resistance; bearish bias remains below this level
Support Zones
4,025 – 4,030: First support, may create a short corrective bounce
3,975 – 3,985: Major support, aligning with previous structure and Fib zones
Trend Outlook
EMA 9 sloping downward, price remains below the average → bearish continuation bias
Price action structure confirms lower highs
Retest–rejection pattern indicates sellers are defending key zones aggressively
Trading Strategy (Intraday)
1. Trend-Following Sell Setup – Preferred Strategy
Wait for price to retest 4,115 – 4,120
Look for bearish rejection patterns
→ Sell
TP1: 4,030
TP2: 3,980
SL: Above 4,140
2. Sell Breakout Continuation
If price breaks below 4,030
Wait for retest and confirm momentum
→ Sell continuation
TP: 3,975
SL: 20–25 points above the breakout zone
3. Countertrend Buy (Only for skilled scalpers)
Only consider buys at 3,975 – 3,985 if strong bullish reaction appears
Not a preferred setup in the current trend
Conclusion
Gold maintains a bearish structure as long as price stays below the EMA and the descending trendline. Sellers are still dominating, and a deeper move towards lower support levels remains highly probable. Watch price behavior closely around 4,115 and 4,030 for the best intraday entries.
If you find this analysis valuable, make sure to follow and save it to catch more TradingView strategies like this.

GOLD MARKET BREAKDOWNAfter the bears at the close of last week's candle, which saw gold dip to 4020's, this dip was merely a liqiuidity sweep to enable gold create a new hedge .
This week's candle opens bullish, a breakout from 4105 would enable our bullish stance and aid more market confluence. Mid trend as first target - if market reacts and if it doesn't, we break past through
......Note thats this is an overview analysis and there may be few changes as the market forms its primary zones, further insights would be given as the market unfolds

A SELLGood time to sell, a sell at 4085-90 sl at 4115 ,and tp at 600pips or 4020 or 4000 and lastly 3960
