XAUUSD Daily AnalysisBased on ichimoku's data XAUUSD long-term trend is still bulish.
Xauusd is in the short-term downward trend.
if it cannot break through the support level (3962) with ichimoku elements, it will change its direction to resistence levels, but if it can, it will continue to highlighted support levels which are very important for gold and you can consider it as long-term support zones.
Trade ideas

Understanding Forex Money Flow: Risk-on & Risk-offWhen it comes to Forex, most traders focus on technicals, chart patterns, or indicators. But “money flow” — the force that truly moves price — is often overlooked. If you want to read the market like a pro, you must understand Risk-on and Risk-off: the two sentiment states that drive global capital.
Today, let’s break them down clearly, practically, and in a way you can apply immediately.
🔥 What Is Risk-on?
“Risk-on” appears when the market is optimistic, investors seek risk, and money flows strongly into high-return assets.
Signals of a Risk-on Environment:
Strong stock market rallies
Capital shifts into riskier assets
Bond yields rise
Positive economic news or geopolitical easing
Assets That Benefit in Forex:
AUD, NZD, CAD (commodity currencies)
GBP, EUR (when the economy is stable)
Bitcoin, oil, and equities also tend to rise
Risk-on = “The market is excited → money flows into high-yield assets”.
💥 What Is Risk-off?
“Risk-off” occurs when the market fears uncertainty, causing money to move toward safe-haven assets.
Signals of a Risk-off Environment:
Stock markets fall sharply
Money exits risky assets
Gold spikes
USD and JPY strengthen
Negative economic news, war, inflation, or political instability
Assets That Benefit in Forex:
USD, JPY, CHF
Gold (XAUUSD)
U.S. government bonds
Risk-off = “The market is scared → money runs to safety”.
❓ Why Forex Traders MUST Understand Risk-on / Risk-off
No matter what indicator you use, the market ultimately reacts to major capital flow.
Understanding these two states helps you:
Trade with market sentiment → dramatically increases win rate
Avoid entering trades against the money flow → fewer “pointless stop-loss hits”
Identify strong/weak currencies → choose high-probability setups
Many perfect technical setups fail simply because they go against global money flow.
📌 How to Apply This Immediately in Your Forex Trading
1. Check the News → Identify Sentiment
Good news? Strong GDP? Stable markets? → Risk-on
Bad news? War? Inflation? Hawkish Fed? → Risk-off
2. Compare Currency Strength
Simple formula:
Risk-on → prioritize BUY AUD, NZD, CAD
Risk-off → prioritize BUY USD, JPY, CHF
3. Follow the Trend — Avoid Fighting Money Flow
The strongest trends often come from shifts between Risk-on and Risk-off.
Examples:
Bad news → JPY strengthens → XXXJPY pairs fall hard
Risk-on returns → USD weakens → gold rises quickly
Follow the money flow, and you’re already ahead of 80% of traders.
🧠 Conclusion – If You Want to Trade Smart, Trade With the Money Flow
Risk-on and Risk-off aren’t just theory — they’re the compass that reveals market psychology, which is the foundation of every trend.
Want to trade like Smart Money?
→ Watch where the money is moving, not just where the candles are going.

Gold 30-Min — Volume Sell Reversal Triggered⚡Base : Hanzo Trading Alpha Algorithm
The algorithm calculates volatility displacement vs liquidity recovery, identifying where probability meets imbalance.
It trades only where precision, volume, and manipulation intersect —only logic.
✈️ Technical Reasons
/ Direction — SHORT / Reversal 4065 Area
☄️Bearish rejection confirmed through sharp candle body.
☄️Lower-high forming beneath resistance supply region.
☄️Volume decreasing confirms exhaustion in price rally.
☄️Sellers regained imbalance with heavy top rejection.
☄️Algorithm detects fading demand and shift to control.
⚙️ Hanzo Alpha Trading Protocol
The Alpha Candle defines the day’s real control zone — the first battle of momentum.
From this origin, the Volume Window reveals where the next precision strike begins.
⚙️ Hanzo Volume Window / Map
Window tracked from 10:30 — mapping true market behavior.
POC alignment exposes institutional bias and breakout potential zones.
⚙️ Hanzo Delta Window / Pulse
Delta window monitors real buying vs. selling power behind each move.
Tracks volume aggression to expose who controls the candle — buyers or sellers.
When Delta aligns with Volume Map, momentum becomes undeniable.

Bearish Reversal Expected from Key Resistance ZoneHello Followers, I am going to share you my opinion on gold next move..
Currently gold is running at 4035.. Price has approached a strong Resistance Area, where previous candles have repeatedly failed to break higher. The current market structure shows exhaustion near this resistance zone, indicating a potential reversal. Once price reacts from the resistance, we expect it to form a lower high and continue dropping toward the marked Target Area around the 3940. This creates a high-probability sell setup... If gold do not respect the resistance and break it then we have a Stoploss point there..
KEYPOINTS:
Entry-level 3935
Target Area 3940
Resistance area 4050/4065
Stop Loss Point 4090

XAUUSD: Light Downtrend, Targeting Lower LevelsGold prices declined during the Asian trading session on Tuesday, continuing the recent downtrend. The weakening confidence in the Federal Reserve's potential rate cut in December has provided strong support for the US dollar , putting pressure on gold and other non-yielding assets. Furthermore, the caution ahead of the delayed September non-farm payroll report, expected to be released this week, is also benefiting the US dollar and driving gold prices lower.
On the chart, we can see that gold is currently moving within a mild downtrend, with a price structure forming a “cup and handle” pattern, setting up for a possible pullback. The resistance level at 4,120,000 USD is quite strong, and if the price fails to break this level, gold is likely to continue its decline toward the next support levels around 4,080,000 USD and 4,000,000 USD.
In particular, the support zone near 4,000,000 USD is a key area to watch, where prices may bounce if selling pressure is not too strong. However, given the current downtrend, the potential for further declines below 4,000,000 USD is highly probable.
Trade Strategy Recommendations:
Sell: If gold fails to break the resistance at 4,120,000 USD and continues to decline, consider opening a sell position with targets near 4,080,000 USD and 4,000,000 USD.
Buy Against the Trend: Consider short-term buy orders if gold rebounds from the 4,000,000 USD support zone, but only trade with low risk and within a short time frame.
Be sure to closely monitor the important resistance and support levels , particularly around 4,080,000 USD and 4,000,000 USD, to make accurate trading decisions.

Gold Consolidation maintain bullish Structure Gold price recently broke out of consolidation and is now rebounding strongly to the upside.
On Monday, gold held steady as growing expectations of a Federal Reserve rate cut next month supported bullish sentiment, helping offset the pressure from a firmer U.S. dollar.
After a long downside movement, price has bounced aggressively upward, showing strong buying interest Gold is clearly bullish within the current range, and if price holds above the breakout zone, momentum may continue then next resistance will be 4100 to 4132 as long as gold maintains this structure, the bullish outlook remains intact.
You may find more details in the chart,
Trade wisely best of Luck buddies.
Ps; Support with like and comments for better analysis Thanks for Supporting.

XAUUSD - long XAUUSD - long ,use trade and risk manamgnet for best result, i see pattern i execute , simple rule

Gold Pauses as Sellers Signal a Potential Downward Move AheadHello everyone,
Gold has just gone through a rather “heavy” session after being strongly rejected at the 4,090–4,100 USD area — a region where sellers seem ready to step in the moment price attempts to move higher. At the moment, gold has pulled back to around 4,065 USD, and the repeated appearance of small-bodied candles with long upper wicks looks like a reminder that the market is becoming tired after the previous bullish move.
External conditions are adding more pressure as well: the USD has strengthened sharply following US economic data that beat expectations, the 10-year Treasury yield remains above 4%, and equity markets continue to rally thanks to Big Tech. With capital flowing out of safe-haven assets, gold simply lacks the “immediate reason” to bounce strongly right now.
With everything that’s unfolding, I’m leaning towards a clear scenario: gold is likely to slide down toward the 4,040–4,030 USD zone to test liquidity. If this area fails to hold, a drop toward 4,000 USD becomes a very real possibility — and that’s where the market may decide whether buyers still have enough strength to return.
What about you — do you think gold can defend 4,040 and rebound, or will it need to fall all the way to 4,000 before any recovery can happen?

ICT-based structures and expected price projections.Key Elements Visible:
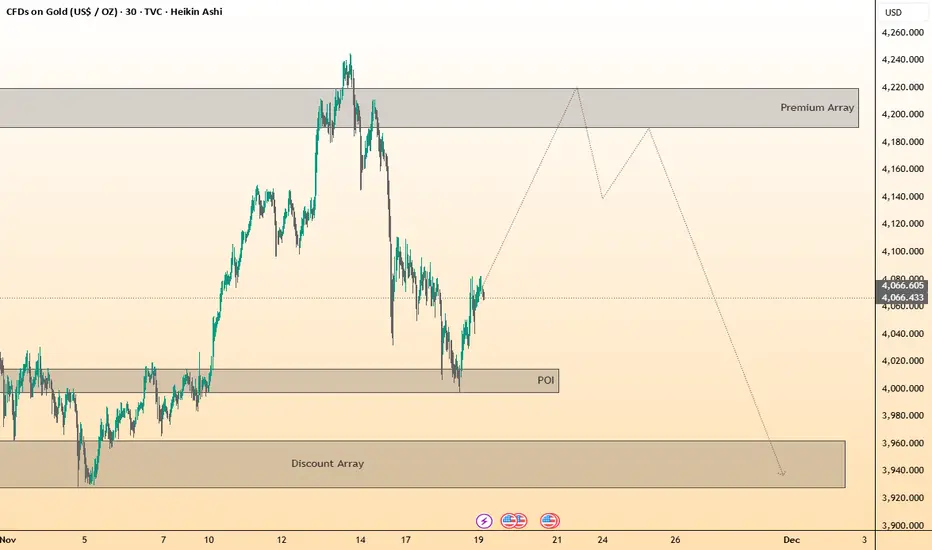
🔹 Current Market Price:
Price is trading around 4066.
🔹 Previous Swing High Zone:
A Premium Array is drawn as a large grey zone around the 4180–4220 area, indicating a potential distribution or sell zone where price may react after grabbing liquidity.
🔹 Previous Swing Low / POI:
A Point of Interest (POI) is marked below, around the 4000–4020 region. This is shown as a discount area where buyers may step in.
🔹 Discount Array:
At the bottom of the chart, a large Discount Array box is shaded, around the 3920–3980 zone, suggesting a deeper liquidity pool or bearish objective if the lower POIs are taken.
🔹 Projected Price Path:
A speculative line (market structure projection) is drawn showing:
A move upwards toward the Premium Array zone
Followed by a sharp reversal downward, targeting the Discount Array
🔹 Market Structure Context:
The current price appears in a retracement phase, attempting to recover from a previous sharp decline.
Gold H1 – Is This Just a Range or a Break Incoming?🟡 XAUUSD – Intraday Smart Money Plan | by Ryan_TitanTrader (21/11)
📈 Market Context
Gold continues to trade inside a compressed intraday range as markets react to the latest discussion on whether the Federal Reserve is likely to cut interest rates anytime soon.
According to new reports, policymakers remain cautious, and early rate-cut expectations are fading as inflation progress slows.
This shift pushes USD stronger, increases Treasury yields, and temporarily weakens gold’s bullish momentum.
Key takeaways from the news:
• Fed officials note that inflation is “still not where it needs to be,” reducing the probability of early rate cuts.
• Markets have scaled back expectations for a Q1 cut, keeping USD supported.
• Higher yields → tighter financial conditions → gold struggles to break premium levels.
• Institutions are likely engineering liquidity grabs on both sides before committing to a new directional move.
Price is currently sitting near the 4030–4045 zone, right above discount liquidity, waiting for a catalyst to break out of the short-term compression.
🔎 Technical Analysis (1H / SMC Structure)
• Market Structure:
Gold has completed a clear CHoCH + short-term bearish sequence and is now compressing into the discount zone around 4030.
• Premium Sell Zone (4H Supply):
4128–4130 aligns with unmitigated supply + buy-side liquidity resting above internal highs.
• Discount Buy Zone:
4030–4028 sits inside the last clean demand zone where a previous sweep occurred.
• Liquidity Map:
→ Buy-side liquidity: above 4128–4135
→ Sell-side liquidity: below 4028–4020
Institutions are likely to sweep one side before delivering direction.
🔴 Sell Setup (Premium Reaction Zone)
• Entry: 4128 – 4130
• Stop-Loss: 4140
• Take-Profit:
→ 4080 (minor imbalance fill)
→ 4045 (range EQ)
→ 4030–4028 (discount demand retest)
📌 Execution rule: Wait for liquidity sweep into the zone + bearish CHoCH on M5–M15 before entering.
🟢 Buy Setup (Discount Reaction Zone)
• Entry: 4030 – 4028
• Stop-Loss: 4020
• Take-Profit:
→ 4060 (short-term reaction level)
→ 4095 (inefficiency fill)
→ 4120 (premium retest)
📌 Valid only if price sweeps the 4030–4028 pocket and shows bullish displacement from discount.
⚠️ Risk Management Notes
• USD strength may spike unexpectedly as rate-cut bets fade — reduce position size during volatility.
• Avoid trading inside the 4045–4085 chop zone unless a clean structure break forms.
• Manage trades aggressively once liquidity levels are taken.
• Expect engineered manipulation during low-volume Asian hours.
📝 Summary
Gold is compressing inside a narrow intraday range as markets reassess the likelihood of Fed rate cuts.
SMC structure suggests a two-sided liquidity sweep before a decisive move:
• Sell Zone: 4128–4130 (premium supply)
• Buy Zone: 4030–4028 (discount demand)
Expect classic accumulation → sweep → displacement patterns until macro conditions create a new trend.
📍 Follow @Ryan_TitanTrader for more Smart Money updates.

GOLD: Improved Volume Signals Potential Upside for GoldGOLD: Improved Volume Signals Potential Upside for Gold
Yesterday the volume was very low and failed to start the uptrend. Perhaps it was also in this situation because of the NFP data that came out better than expected and the US dollar showed strength again.
Gold found strong support in our old area near 4030 from where it recovered again. Currently gold reached 4078 and chances are it will rise further.
Today's volume seems to be better compared to all other days combined. The fundamental analysis did not change during all these days.
Targets remain the same:
4150
4230
With extension levels at 4290 and 4360 if momentum accelerates
You may find more details in the chart!
Thank you and Good Luck!
❤️PS: Please support with a like or comment if you find this analysis useful for your trading day❤️
GOLD → Consolidation while awaiting the driverFX:XAUUSD is consolidating after a sharp decline. Bulls are consolidating above 4050. Important US data is ahead, including the employment report (NFP) on Thursday.
Decrease in bets on Fed easing: The probability of a cut in December has fallen to 46% (from 67% a week ago) after cautious statements by Fed officials. However, we have not yet seen inflation and employment data, so the situation may change... The September NFP report will be released on Thursday after a 43-day hiatus.
The market is waiting for clarity from the US data. Weak indicators (NFP, inflation) could bring back interest in gold, while strong data would strengthen the dollar and reinforce the correction.
Gold is in the $4030–4100 range. A break above $4100 will require weak US data or unexpectedly dovish rhetoric from the Fed. The $4030–4045 level is key support.
Resistance levels: 4097, 4110
Support levels: 4071, 4046, 4032
I think the market may remain in the current range while awaiting economic data or other drivers. A correction to support may form from resistance. It is important to monitor the levels from below; if the bulls keep the price above support during the correction, gold will be able to strengthen...
Best regards, R. Linda!

XAUUSD – Where Smart Money Strikes Today🌐 MARKET CONTEXT
Gold begins today’s session after a phase of controlled volatility, where price continued to sweep both sides of the range but failed to commit to a direction. The broader intraday structure remains bearish, with price rejecting premium levels and forming consistent lower highs.
Recent Drivers:
USD shows moderate resilience following firm Fed communication
Market sentiment cautious ahead of late-week economic announcements
No significant safe-haven inflow → neutral risk environment
Session Expectations:
London Session: Likely to trigger early liquidity sweeps above premium wicks
NY Session: Expected to deliver the main directional push
Bias: Bearish unless price reaches deep discount zones and prints a CHoCH
Price is currently trading within the middle of the intraday range → best setups remain at extremes (premium sells / discount buys).
📉 TECHNICAL ANALYSIS (SMC + LIQUIDITY STRUCTURE)
Market Structure
M30 structure remains bearish (Lower Highs → Lower Lows)
Current equilibrium zone: 4060–4080
Inducement stacking above 4147 and 4081
Liquidity Map
Buy-Side Liquidity (BSL): Above 4147 and 4081
Sell-Side Liquidity (SSL): Below 4033 and deeper cluster at 3993
These layers show engineered liquidity designed to trap impatient traders.
Imbalances (FVG Zones)
Bearish FVG: 4147–4148 → strong premium rejection zone
Minor FVG: 4079–4081 → ideal scalp sweep zone
Discount FVGs: 4033 and 3993 → high-quality buy reactions
🔑 KEY PRICE ZONES (Clear & Engaging Explanations)
4148–4147 ▶️ Premium Liquidity Trap – High-Probability Sell
This zone holds a clean bearish OB + untouched BSL above 4147.
Institutional traders typically use this area to trigger breakout buyers before reversing the move sharply downward.
4079–4081 ▶️ Mid-Premium Inducement – Scalp Rejection Zone
A compact liquidity pool sitting just above equilibrium.
Market often sweeps here during London session to induce buys before dropping.
4035–4033 ▶️ Discount Reaction Zone – Reliable Scalping Demand
Micro OB + SSL alignment makes this zone ideal for sharp intraday rebounds.
Expect fast reactions with minimal drawdown.
3995–3993 ▶️ Deep Discount Pool – Strong Reversal Zone
This region contains layered SSL + higher-timeframe discount confluence.
If price taps this zone, a significant intraday reversal becomes highly probable.
⚙️ TRADE SETUPS (SMC-Based, High Precision)
✔️ SELL SETUP 1 – Premium Rejection
Entry: 4148–4147
Stop-loss: 4126
TP1: 4135
TP2: 4105
TP3: 4080
Logic: BSL sweep + FVG mitigation → strong bearish displacement expected.
✔️ SELL SCALP – Mid-Range Liquidity Sweep
Entry: 4079–4081
Stop-loss: 4087
TP1: 4065
TP2: 4048
TP3: 4033
Logic: Sweep of inducement above mini-BSL before continuation down.
✔️ BUY SCALP – Intraday Discount Rebound
Entry: 4035–4033
Stop-loss: 4027
TP1: 4048
TP2: 4070
Logic: SSL sweep triggers a micro CHoCH → quick bullish bounce.
✔️ BUY SETUP 2 – Deep Discount Reversal
Entry: 3995–3993
Stop-loss: 3987
TP1: 4010
TP2: 4040
TP3: 4070
Logic: Key institutionally favoured zone → strong liquidity-driven reversal.
🧠 NOTES / SESSION PLAN
Only trade at extremes — avoid mid-range to prevent chop
Expect engineered fake-outs at London open
NY session likely delivers true directional movement
Wait for M5/M15 confirmation: CHoCH + BOS before executing
Avoid buying near premium zones to avoid falling into liquidity traps
🏁 CONCLUSION
Gold maintains a bearish M30 structure, favouring sell setups at 4147 and 4081.
Discount zones at 4033 and 3993 offer high-probability buy opportunities for intraday rebounds or full reversals.
Stay disciplined.
Let liquidity be your guide.
Strike only when the trap is set.

Gold Drops, Rebounds, Drops Again – Structure Still Bearish1. What Happened Yesterday
Gold reacted perfectly from the indicated sell zone, dropping almost 800 pips in a very short period.
However, immediately after the decline, the market turned violent with a 600-pip reversal, followed by another 700-pip drop overnight.
Such chaotic swings clearly show a battle between bulls and bears, with neither side managing to seize full control so far.
2. Current Market Context
This is one of the most difficult types of environments to trade:
- Momentum is uncertain
- Volatility is extreme
- Direction changes rapidly
Still, certain levels remain crucial for identifying the next move.
3. Technical Outlook
Key levels to watch:
- 4050 support → absolutely critical for bulls
A break and sustained move below 4050 would likely open the path toward a retest of 3900
- 4100 zone → immediate upside barrier
A clean stabilization above 4100 could finally give bulls the strength to push toward 4200
Without a decisive break of either level, expect more volatile two-sided trading.
4. Trading Plan
As of now, my bias remains bearish, unchanged from yesterday.
However, I remain aware of the strong intraday volatility and the possibility of fast upside spikes.
My main scenarios:
- Below 4050 → bearish continuation, targeting 3900
- Above 4100 → bullish momentum, possible rise toward 4200
Until one of these breaks occurs, expect Gold to remain noisy and difficult.
5. Conclusion
Gold is in a highly unstable phase, with sharp 600–800 pip swings in both directions. The market is fighting for direction, but structurally, the bearish bias still dominates unless price regains stability above 4100.

Gold Losing 4050 Support – 4K Now at Risk1. What Happened Yesterday
Gold broke below the key 4050 support zone and continued to decline, coming very close to the psychological 4000 level.
This is the most significant bearish continuation we’ve seen since the strong rally earlier this month.
2. Current Market Context
At the time of writing, price is showing only a weak and shallow rebound, hovering around 4017.
Momentum remains bearish, and structurally, the market looks vulnerable to a clean break below 4K.
3. Technical Outlook
If price continues lower, the 3950–3970 zone becomes highly relevant. This area represents a medium-term bullish demand zone, and a drop into it could offer a meaningful buying opportunity — but only with confirmation.
Right now, the structure remains bearish. A genuine shift back to bullish conditions would require:
- A reclaim of 4050, and more importantly
- A stabilization above that level, not just a wick or intraday spike.
Without that, any bounce is just noise inside a bearish trend.
4. Trading Plan
- Bearish bias remains active as long as price trades under 4050
- A flush into 3950–3970 could be a buy zone, but only if price shows clear support and reversal signs
- Until then, bulls are on defense, and shorts continue to have the advantage
5. Conclusion
Gold is under pressure, and a break below 4K is a strong possibility. A deeper drop may eventually turn into an opportunity for medium-term buyers, but at this moment the structure is bearish and caution is required.

STILL IN A BUY ZONE How price closed at 3am UTC, if it was at a different place like a free zone i would have called for closure of the sells because it signaled further push downwards but as long as price is above 4045 , it could start buying more only if the trend doesn't want to change to bearishness and therefore there was no need to call for closure of the trade, price is currently at a discounted area as some people call it and it even best to buy there and if you bought you can still hold it because price is still in a buy zone .

Gold Rebounds, But Sellers Likely Preparing for Another Drop1. What Happened Yesterday
Gold finally rebounded after the steep 2500-pip drop from the recent top.
Although I anticipated this rebound, my preferred buy zone around 3970 was never reached. Instead, Gold dipped only slightly below the 4000 figure, then climbed to the 4080 zone.
This confirms that buyers are still active
2. Current Market Context
In my view, this bounce is just a corrective move, not the start of a new bullish leg.
Momentum remains bearish, and the market structure still favors another wave of selling.
3. Technical Outlook
Key levels to watch:
- 4120–4140 → resistance zone and ideal area to hunt for new short entries
- 4080 → intraday pivot
- 3900 → next major target and strong technical support
As long as Gold stays below 4140, the path of least resistance remains to the downside.
4. Trading Plan
My plan going forward is simple:
- Look for shorts on rallies into 4120–4140
- Hold a downside target at 3900
- Reassess only if Gold breaks and stabilizes above 4140
Until then, selling strength continues to make the most sense.
5. Conclusion
Gold’s rebound was expected — but limited. With the broader trend still bearish, I anticipate another decline, potentially toward the 3900 zone. Any rally into resistance should provide attractive selling opportunities.

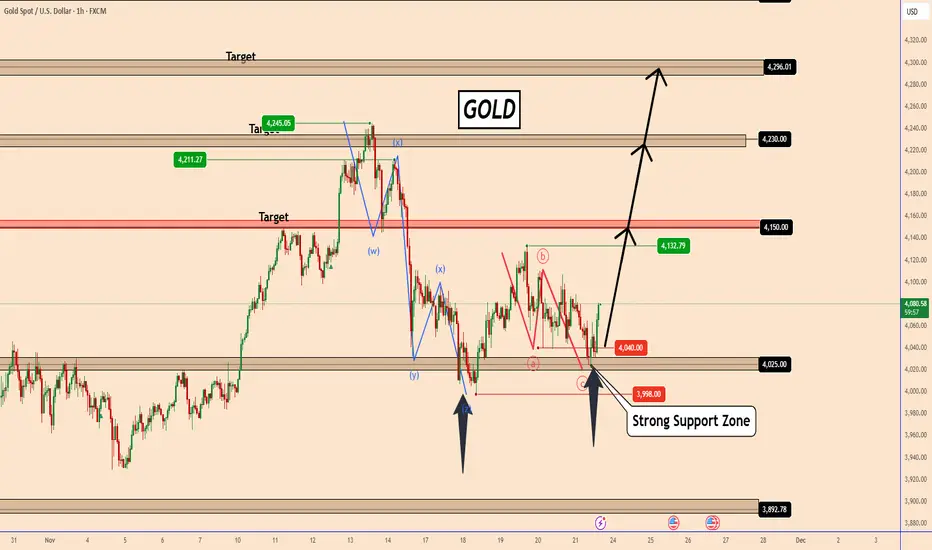
XAUUSD Buyers Step In — Market Aiming for $4,140 RetestHello traders! Let’s take a look at XAUUSD (Gold). XAUUSD maintains a bullish structure after bouncing from the key $4,050–$4,060 support zone, where price also retested the ascending trendline. After breaking out of the descending channel, Gold formed a new accumulation zone and moved higher, approaching the strong $4,140 resistance level. The price is now trading between the ascending support and the local supply zone near $4,140, forming a tightening structure. A breakout above this level could open the way for further upside, while a rejection may trigger a correction back toward $4,060. As long as XAUUSD holds above $4,060 and the ascending trendline, a renewed move toward $4,140 remains likely, with potential for a breakout. Please share this idea with your friends and click Boost 🚀

GOLD (XAUUSD): Support & Resistance Analysis for Next Week
Here is my latest structure analysis for Gold.
Vertical Structures
Vertical Support 1: Rising trend line
Horizontal Structures
Support 1: 4021 - 4045 area
Support 2: 3869 - 3934 area
Support 3: 3765 - 3829 area
Support 4: 3690 - 3738 area
Resistance 1: 4082 - 4133 area
Resistance 2: 4202 - 4246 area
Resistance 3: 4360 - 4382 area
Consider these structures for pullback/breakout trading.
❤️Please, support my work with like, thank you!❤️
I am part of Trade Nation's Influencer program and receive a monthly fee for using their TradingView charts in my analysis.

THE KOG REPORT - UpdateEnd of day update from us here at KOG:
Ranging day on gold today with not much action. We gave the lower levels yesterday that we wanted price to tap and bounce from which it did, giving a nice long trade to start the week. After that, just small up and down movement not really worth getting involved in.
For that reason, we'll stick with the same plan for now and monitor the indicators for any change, otherwise, still looking for a potential undercut low.
RED BOXES:
Break above 4095 for 4104, 4110, 4120 and 4127 in extension of the move
Break below 4080 for 4065✅, 4055✅ and 4040 in extension of the move
Please do support us by hitting the like button, leaving a comment, and giving us a follow. We’ve been doing this for a long time now providing traders with in-depth free analysis on Gold, so your likes and comments are very much appreciated.
As always, trade safe.
KOG

Gold Consolidation remains bearish momentumGold is trading inside a descending structure, showing continued bearish pressure Price is repeatedly rejecting the mid-trendline, signalling weak bullish momentum a break below 4,040 may trigger a drop market bias remains bearish unless price breaks above the upper trendline.
Gold prices are on track for a weekly loss of around 1.5% following a mixed U.S. jobs report and ongoing uncertainty surrounding Federal Reserve policy. In New York, gold futures fell 0.5% to 4,041 per troy ounce, while spot prices reacted to stronger-than-expected U.S. job growth for September.
Technical Outlook:
The market is currently moving within a narrow trading range. a breakout above the 4,060 level could trigger bullish momentum, allowing prices to test the 4,065 to 4,075 zone However, failure to break above resistance may lead to consolidation. A bearish continuation below support could push gold toward the 4,005 to 3,970 major support area.
You may find more details in the chart,
Trade wisely best of luck buddies.
Ps; Support with like and comments for batter analysis Thanks for Supporting,

Gold Weakens as Sellers Regain ControlHello everyone, gold is starting to lose its upward momentum when looking at the 4H chart: the price is hovering around 4,065 USD, right after a firm rejection from the 4,090–4,100 USD region. A series of small-bodied candles with long upper wicks suggests that buyers are slowing down, while sellers are stepping back in and taking control each time price approaches the supply zone above.
Technically, the Ichimoku cloud has flattened and begun tilting downward—a familiar sign of a weak, slightly bearish sideways market. Just overhead, the 4,090–4,100 USD zone aligns with an unfilled red FVG, forming a strong resistance layer that makes it difficult for gold to break higher. On the downside, the nearest support sits at 4,040–4,030 USD, where a green FVG and an old liquidity cluster previously triggered strong reactions.
The external backdrop doesn’t support gold either: the USD is recovering well following stronger-than-expected US economic data, the 10-year Treasury yield is holding around 4.1%, and US–EU equities continue rising thanks to Big Tech. Capital is moving away from safe-haven assets, leaving gold without much momentum to rebound in the short term.
Given all these signals, I lean toward one primary scenario: gold may pull back to retest the 4,040–4,030 USD zone in the coming sessions. If that area breaks cleanly, the next target would be 4,000 USD—a high-liquidity region that has produced strong bounces in the past. On the other hand, as long as 4,090 continues to reject price, gold is likely to remain in a tight 4,050–4,090 range rather than resume an immediate uptrend.
What do you think—will 4,040 hold this time, or will gold need to revisit 4,000 before finding new buying pressure?

XAU/USD | Gold Rebounds Strongly After Hitting Key Demand Zone!By analyzing the #Gold chart on the 4-hour timeframe, we can see that after reaching $4105, the price dropped again and made a sharp move down into the $4026 demand zone I mentioned in the previous analysis. As soon as gold touched this zone, strong buying pressure kicked in, pushing the price back up to around $4080.
The next short-term supply zones to watch are $4090, $4100, and $4109.
The medium-term supply zones are $4150, $4172, and $4193.
Keep an eye on gold’s reaction in these areas, they can trigger new pullbacks or confirm further upside movement.
Please support me with your likes and comments to motivate me to share more analysis with you and share your opinion about the possible trend of this chart with me !
Best Regards , Arman Shaban
