ElDoradoFx – GOLD ANALYSIS (17/11/2025, ASIA SESSION)
1️⃣ Market Overview
Gold opens the Asia session around $4,105, attempting a recovery after last week’s heavy selloff that drove price into the $4,032–$4,070 macro support zone.
The bounce has pushed price back into a dense resistance cluster—including the descending trendline, 50 EMA, 200 EMA, and supply zone at $4,104–$4,116.
Despite the short-term recovery, the broader structure remains bearish, with the market trading under multiple key swing highs and still respecting all descending structure lines. Asia session is expected to deliver a corrective leg unless buyers break through the first resistance block.
Price is currently coiling before a potential breakout into London.
⸻
2️⃣ Technical Breakdown
🔹 Daily (D1)
• Gold holds above the 100 EMA, but remains below broken bullish channel support.
• RSI ~55, reflecting a neutral-to-recovering state.
• The daily BOS remains bearish until price reclaims $4,146–$4,173.
• Daily buyers protecting the $3,930–$3,990 zone, but momentum is still corrective.
⸻
🔹 H1 Chart
• Clear bearish BOS from the $4,245 swing high.
• Price bounced sharply from $4,032 and now retests a very strong resistance cluster:
• Descending trendline
• 50 EMA
• 200 EMA
• Micro supply zone
• RSI ~41 showing weak bullish strength.
• H1 remains bearish unless $4,130–$4,146 breaks.
⸻
🔹 15M–5M Structure
• Multiple CHoCHs after rejecting the $4,070–$4,080 demand zone.
• Momentum indicators turning green, but trendline + MA structure overhead is intact.
• Heavy sell pressure expected around $4,104–$4,116.
⸻
3️⃣ Fibonacci Analysis
Last swing: 4,245 → 4,032
• 38.2% = 4,114
• 50.0% = 4,138
• 61.8% = 4,162
🎯 Fibonacci Golden Zone: 4,114 – 4,162
This zone aligns with supply, trendline resistance, and H1 EMA cluster → high-probability sell area.
⸻
4️⃣ High-Probability Trade Scenarios
📈 BUY SCENARIO (Countertrend Only)
• Entry Zone: 4,080 – 4,070 (Fresh demand + sweep zone)
• Targets: 4,104 → 4,116 → 4,130
• Stop Loss: Below 4,060
• Confirmation:
✔ Bullish CHoCH on 5M–15M
✔ Engulfing or FVG fill reaction
Only valid if the pullback holds above 4,070.
⸻
📉 SELL SCENARIO (Primary Bias)
• Entry Zone: 4,114 – 4,162 (Golden Zone + Trendline + Supply)
• Targets: 4,090 → 4,070 → 4,050 → 4,032
• Stop Loss: Above 4,172
• Confirmation:
✔ Rejection wicks
✔ RSI divergence
✔ MAs curling downward
This is the highest probability setup for the Asia → London transition.
⸻
💥 Breakout SELL Setup
• Trigger: Break & close below 4,070
• Retest: 4,074 – 4,078
• Targets: 4,050 → 4,032 → 4,010
• Stop Loss: Above 4,090
Continuation of the macro bearish move.
⸻
💥 Breakout BUY Setup
• Trigger: Break & close above 4,130
• Retest: 4,116 – 4,120
• Targets: 4,146 → 4,173 → 4,200
• Stop Loss: Below 4,104
Only valid if strong volume enters the market.
⸻
5️⃣ Fundamental Watch
• Asia session expected quiet until Tokyo liquidity.
• Market positioning ahead of:
• US FOMC speakers
• US Housing Data
• DXY stability near 106 still suppressing strong upside.
• No major Asia-session news, but volatility may rise into London.
⸻
6️⃣ Key Technical Levels
Resistance:
4,104
4,116
4,130
4,146
4,173
Support:
4,090
4,080
4,070
4,050
4,032
Golden Zone: 4,114 – 4,162
Breakout Levels:
• Buy Trigger: > 4,130
• Sell Trigger: < 4,070
⸻
7️⃣ Analyst Summary
Gold is attempting a recovery from the 4,032 low, but the broader structure remains bearish.
Asia session likely pushes into 4,104–4,116, where the strongest sellers are positioned.
Only a clean break above 4,130 changes the short-term tone to bullish.
Until then, the market remains in retracement mode, preparing for another leg lower.
⸻
8️⃣ Final Bias Summary
📉 Primary Bias: Bearish below 4,130, targeting 4,090 → 4,070 → 4,050
📈 Alternative Bias: Bullish only above 4,130, targeting 4,146 → 4,173 → 4,200
⸻
📊 ElDoradoFx PREMIUM 3.0 – WEEKLY PERFORMANCE RECAP 📊
📅 10 – 16 NOV 2025
💰 Precision. Consistency. Profit.
━━━━━━━━━━━━━━━━━━
🟢 MONDAY 10/11
✅ BUY (SWING) +2,850 PIPS
✅ BUY +20 PIPS
✅ BUY +210 PIPS
✅ BUY +110 PIPS
✅ SELL +20 PIPS
✅ BUY +210 PIPS
📊 Huge start — swing and intraday aligned perfectly.
━━━━━━━━━━━━━━━━━━
🔵 TUESDAY 11/11
GOLD
✅ BUY +110 PIPS
✅ BUY +90 PIPS
✅ BUY LIMIT +40 PIPS
✅ BUY +40 PIPS
✅ BUY +60 PIPS
❌ BUY -50 PIPS (SL)
✅ BUY +280 PIPS
✅ BUY +240 PIPS
LIVE SESSION
❌ BUY -40 PIPS (SL)
✅ BUY +120 PIPS
✅ BUY +60 PIPS
✅ BUY +30 PIPS
📈 Strong directional day with clean scalping in session.
━━━━━━━━━━━━━━━━━━
🟣 WEDNESDAY 12/11
✅ BUY +20 PIPS
✅ BUY +30 PIPS
✅ BUY +40 PIPS
❌ SELL -40 PIPS (SL)
✅ BUY +210 PIPS
✅ SELL +15 PIPS
✅ BUY +210 PIPS
📊 Trend continuation — minimal drawdown.
━━━━━━━━━━━━━━━━━━
🔴 THURSDAY 13/11
❌ BUY -40 PIPS (SL)
✅ BUY +210 PIPS
✅ BUY +110 PIPS
✅ BUY +60 PIPS
✅ BUY +210 PIPS
✅ BUY +60 PIPS
❌ BUY -80 PIPS (SL)
✅ SELL +210 PIPS
⚖️ BUY – BE
✅ BUY +240 PIPS
🔥 Huge bullish momentum — big intraday winners.
━━━━━━━━━━━━━━━━━━
🟡 FRIDAY 14/11
❌ BUY -60 PIPS (SL)
✅ BUY +110 PIPS
✅ BUY LIMIT +60 PIPS
✅ SELL +110 PIPS
❌ BUY -70 PIPS (SL)
✅ BUY +110 PIPS
LIVE SESSION
⚖️ BUY – BE
✅ SELL +250 PIPS
❌ BUY -40 PIPS (SL)
✅ BUY +60 PIPS
⚖️ SELL – BE
✅ SELL +180 PIPS
📊 High volatility day — precision paid off.
━━━━━━━━━━━━━━━━━━
🪙 BTC/USD WEEKEND BONUS
✅ SELL +600 PIPS
✅ BUY +500 PIPS
✅ SELL +400 PIPS
━━━━━━━━━━━━━━━━━━
📊 WEEKLY RECAP
🥇 GOLD NET PIPS: +6,575 PIPS
📱 BTC/USD BONUS: +1,500 PIPS
🚀 TOTAL WEEKLY PROFIT: +8,075 PIPS
📌 Signals Counted: 39 Wins | 8 SL
🎯 Win Rate: 83%
━━━━━━━━━━━━━━━━━━
🔥 Another powerful trading week — GOLD swings and intraday setups delivered exceptional precision, and BTC weekend signals added strong bonus gains.
👏 Congrats if you profited! Let’s continue the momentum.
— ElDoradoFx PREMIUM 3.0 Team 💼📈
Trade ideas

Elliot Waves - Short on XAUUSDMarkets are close to close de Yearly canddle. Im looking a descount on XAUUSD After 2025 bull Markets. Looking for the last numer.

Gold: Range Play with Trendline BiasGold has settled into a clean range after its breakout. My plan is to buy from the range low in line with the rising trendline. If that level gives way, the next opportunity sits lower for a fresh reaction and potential trendline retest before continuation.

GOLD BULLISH MOVE Gold broke the D1 supply order block and closed above it. It created a demand order block and is retracing for a buying opportunity to continue upward.

XAUUSD Gold is a chemical element; it has chemical symbol Au and atomic number 79. In its pure form, it is a bright-metallic-yellow, dense, soft, malleable, and ductile metal. Chemically, gold is a transition metal, a group 11 element, and one of the noble metals.

Gold prices plummeted, but what exactly happened?Gold's technical outlook has shown clear signs of a reversal, compounded by recent comments from Federal Reserve officials that have reinforced bearish expectations. The bullish trend is struggling to hold, and prices rebounded quickly after touching the previous strong support level of 4030. We successfully captured this profit as expected, with the timing perfectly in line with our predictions. From a structural perspective, the short-term gold price movement is a technical correction after an oversold condition. This rebound is a normal technical correction and does not change the overall weak medium-term outlook. The market is likely to continue its downward trend through a period of consolidation. Strategically, the key short-term resistance level to watch is the 4090-4110 area. If the price rebounds but fails to break through this range, it will present a crucial opportunity to short. The overall strategy remains unchanged: focus on selling on rallies, and look for opportunities to short in the 4090-4110 area. Maintain a steady pace, follow the trend, and the market will naturally provide the necessary profit opportunities.

OUTLOOK XAUUSD 1H Analysis (13th November 2025)This is not a financial advise, It's just a trading idea.
BUY/SELL SCENARIOS:
BUYS:
1) Body candle close above the 4211.72 level.
2) Retest the Previous Daily High at the 4211.72 level.
3) Create a 5/15m Bullish Engulfing Candle to capitalize on BUYS towards the 4272.50 level.
SELLS:
1) Sweep the Previous Daily High at the 4211.72 level.
2) Create a 5/15m Bearish CHOCH with a body candle close (with a FVG).
3) Retest the 5/15m Bearish CHOCH Level to capitalize on SELLS towards the 4149.00 level.
Trade smart, Trade according to your plan.

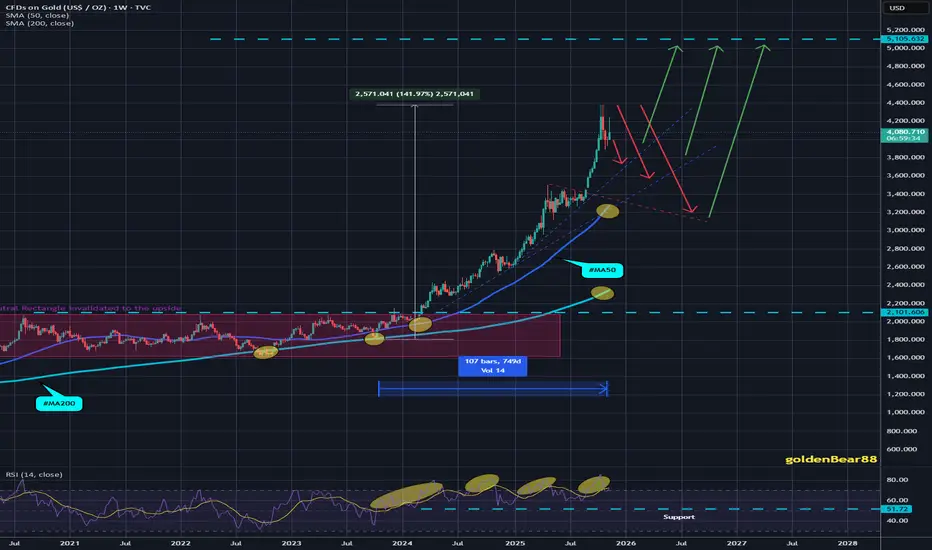
Excellent Selling sequence for me to Buy for usTechnical analysis: Gold is showing increasing Selling presence on Weekly (#1W) chart as it is virtually unchanged (the (#1W) candle at # +1.86% currently) as Price-action is on parabolic downtrend within July’s High’s and October Low’s. This has effectively constructed an series of red Daily chart's candles hence the Bearish values on almost all charts which was an ideal Selling opportunity for Short-term Traders however Gold is struggling to stage more serious decline below #4,000.80 benchmark which I mentioned many times as possible 'floor'. Personally I remain on Medium-term Buying set-up as Daily and Weekly chart (#1W) remains heavily Bullish indicating that the latest decline was simply another accumulation and distribution phase of the recently started renewed Bull market. However the Price-action just touched the Weekly chart’s (#1W) #4,052.80 benchmark for the first time since recent upswing which was essentially the start of the parabolic rise. As a result when the #4,100.80 breaks, the next are of my importance is new ATH's level before possible Stabilization zone where Medium and Long-term Sellers will re-appear. If that happens then I will add to my portfolio giving a horizon of #20 - #30 session horizon until Gold hit #4,300.80 benchmark. However it is important to mention that if DX continues the spiral downtrend and Gold re-captures (confirmation by market closing) Resistance zone, Gold can correct #4,100.80 today.
My position: I have placed my Buys on #4,032.80 - #4,042.80 Long-term and my Targets are #4,100.80 - #4,127.80 zones. I maintain my #5,100.80 Long-term Target as these declines are excellent Buying opportunities / fuel for more up.
Latest Direction After Gold Price Surge
News:
On Thursday (November 13) in Asian trading, spot gold remained relatively stable after yesterday's surge, currently trading around $4,200 per ounce.
On Wednesday evening local time, US President Trump signed a temporary funding bill, ending the longest government shutdown in US history. The bill will provide continued funding for the federal government, ensuring most government agencies have operating funds until January 30, 2026.
The end of the US government shutdown means that official economic data will resume being released, paving the way for a Federal Reserve interest rate cut in December.
Technical aspects:
On the daily chart, after stabilizing last week, gold has continued its rebound this week, showing short-term strength. Support levels to watch are around $4210, near Wednesday's high, and then the intraday low of $4185. Resistance levels to watch are the intraday high around $4240; a break above this level would indicate further strength, with the upside target at the psychological level of $4300, which also coincides with the upper Bollinger Band on the daily chart.
The 5-day moving average is trending upwards in a golden cross, the MACD indicator has formed a golden cross, and the KDJ and RSI indicators are also trending upwards in a golden cross, suggesting short-term technical indicators indicate a potential for further gold price rebound.
Trading strategy:
Buy:4190-4185, SL: 4175, TP: 4250-4275


XAU/USD — Bullish Continuation Setup (4H Chart)Gold (XAU/USD) has been consolidating near US $4,000 after rallying strongly to new highs above US $4,300 earlier this quarter.
Price has since formed a falling wedge / triangle pattern, signaling potential bullish continuation if buyers regain control.
Technical Outlook
Price is compressing between converging trendlines, with clear zones marked on the chart.
Buy confirmation: a breakout and close above 4,020–4,040 would signal bullish momentum.
If confirmed, price could extend toward 4,120–4,180, followed by 4,250+.
Buy invalidation: a breakdown below 3,940 would negate the bullish setup and expose the 3,900–3,860 support zone.
The overall structure remains constructive — a breakout above resistance would complete the wedge and potentially resume the broader uptrend channel.
Fundamental View (November 2025)
Fed policy: The Federal Reserve held rates steady in October but hinted at rate cuts in early 2026, a dovish tilt that supports gold.
Macro conditions: U.S. inflation (~3.2%) remains sticky, and bond yields are easing — reducing pressure on non-yielding assets like gold.
Safe-haven demand: Continued geopolitical tension in the Middle East and strong central-bank purchases (China, India, Turkey) add structural support.
Short-term risk: A brief U.S. dollar rebound may cause intraday volatility, but sentiment remains broadly bullish.
Trading Plan
Bias: Short-term bullish continuation
Breakout trigger: Above 4,020–4,040 (confirmed breakout)
Targets:
‣ TP1: 4,120–4,150
‣ TP2: 4,180–4,250
Invalidation: Below 3,940

GOLD IDEASWe anticipate GOLD to reject the +D1 C.E and respect the upper Quadrant and continue higher to HTF Bullish momentum.
NB; If Gold does not respect the C.E and upper Quadrant of the D1 FVG, and instead close below the C.E we'll be anticipating a sell-off.
Safe Trading!


XAUUSD: Bounce from Support Zone Targets $4,280 ResistanceHello everyone, here is my breakdown of the current Gold setup.
Market Analysis
Gold (XAUUSD) continues to maintain a bullish market structure after successfully recovering from the Support Zone near $4,090–$4,100, where buyers stepped in to defend a key demand area. Following a fake breakout to the downside in late October, price regained momentum and established a new Upward Channel, characterized by higher highs and higher lows — a strong sign of renewed buying pressure.
Currently, gold has already completed two major breakout phases, first reclaiming the support range and then extending toward the mid-channel zone. The current consolidation suggests a temporary pause before another impulsive leg upward. Price is now trading between the $4,190 support and the $4,350 resistance area, where previous reactions indicate strong liquidity. This resistance has acted as a cap for prior rallies, making it a crucial target zone for bulls. As long as the metal holds above the channel’s lower boundary, the short-term trend remains bullish. A minor pullback toward the support area could serve as a healthy correction before another rally unfolds. However, a confirmed break below $4,190 could temporarily weaken the bullish momentum and lead to a deeper retracement.
My Scenario & Strategy
I expect XAUUSD to maintain its bullish trajectory while respecting the ascending channel structure. Buyers may look for potential long setups near the $4,190–$4,200 support zone, targeting the $4,320–$4,350 resistance area (TP1). A breakout and close above $4,350 would open the path toward $4,400+ levels, confirming further continuation of the bullish cycle.
Conversely, a strong bearish break below the channel and support zone could signal a short-term correction toward $4,100 before buyers attempt to regain control. For now, sentiment remains optimistic, and gold continues to look poised for another bullish leg higher within its well-defined upward channel.
That's the setup I'm tracking. Thank you for your attention, and always manage your risk.

The Leap Competition Updates | Ep. 02Bruh, I got Cooked Twice. Gold showed no messy, Twice in a row.

SELL SIGNAL ASSET:GOLD (XAUUSD)Bears are stepping in as price shows signs of exhaustion at key resistance levels.
This setup marks a high-probability short-term downside opportunity, ideal for traders who look to capitalize on momentum reversals and clean structural shifts.
✳️ Market Snapshot
Structure Shift: Price forms a lower high, signaling potential weakness ahead.
Momentum Turn: Sellers are reclaiming control after a failed bullish push.
Entry Zone: A defined area where downside acceleration is likely to begin.
Risk Control: Stop-loss levels remain tight (around 40–50 pips) to safeguard capital.
💰 Trading Outlook
Consider short positions near the highlighted resistance or confirmation candle.
Targets: Short-term take-profits at recent support or liquidity sweep zones.
Tip: Keep position sizing aligned with your risk plan — focus on accuracy, not aggression.
⚠️ Trader’s Note
This signal is intended for short-term momentum trading. Always apply your own analysis, follow strict risk management, and treat this as a trade idea, not financial advice.

The logic of the gold rallyAfter the data vacuum period, policy signals will become clear
The US government shutdown led to the absence of some economic data, forcing the Federal Reserve to temporarily maintain a "neutral stance". However, as the data is gradually completed, the policy path will become clearer. Historical experience shows that the policy expectation correction after the data vacuum period often leads to an increase in gold volatility. And the current 4085 correction level precisely provides a safe entry window for the policy-driven upward trend.
Next week's gold trading strategy
buy:4065-4075
tp:4085-4095-4130
sl:4055

HOW MANY BUYER TRAPS BEFORE NEW ATH GOLD ?📈 Analysis of Gold Trading Plan (SMC/Order Flow)
🔍 Current Market Context
Structure: The market has shown a strong bullish trend, marked by a Break of Structure (BOS) and a Liquidity Done Sweep around the $4,145 price level.
Liquidity:
The market performed a "First Sweep Here" (initial liquidity grab) after the rally, signaling a readiness for a correction.
The main liquidity target for the upward move (Big Boy Liquidity) is set above the $4,240 level.
Recent Price Action: After hitting the peak and the initial sweep, the price experienced a sharp decline, creating a correction zone.
🎯 Proposed Trading Plan
The plan focuses on two main scenarios: a Short-term Sell (SELL SCALP) and a Primary Buy (BUY GOLD).
1. Primary Buy Scenario (BUY GOLD)
This is the main scenario to continue the bullish trend (Long).
Entry Zone: BUY GOLD 4126 - 4124.
This zone is likely a critical Order Block or an unmitigated Demand Zone, positioned just below the previous liquidity sweep and acting as a strong support/Displaced/Fair Value Gap (FVG) area.
Stop Loss (SL): SL 4120.
This stop-loss level protects the long position, placed just below the key entry zone to avoid being shaken out by minor liquidity grabs.
The indicated Stoploss Buyer area (around $4,145 - $4,150) suggests the price drop might aim to sweep prior buyers' liquidity before bouncing from the $4,124 - $4,126 zone.
Take Profit (TP): The ultimate target is the Liquidity Limit Big Boy (above $4,240).
2. Short-term Sell Scenario (SELL SCALP)
This is a short-term trading opportunity (Scalping) during the corrective move.
Entry Zone: SELL SCALP 4208 - 4210.
This area likely represents a Supply Zone or a bearish Order Block following the sharp drop, where hidden selling pressure resides.
Stop Loss (SL): SL 4212.
This is a very tight stop loss, placed just above the entry zone.
Take Profit (TP): The target is the BUY GOLD 4126 - 4124 area (the primary buy entry zone).
⚠️ Key Considerations
Timeline: This plan requires the price to move according to the predicted scenario (drop to the buy zone before rallying).
Confirmation: Traders should wait for structural confirmation on a lower timeframe (e.g., a Change of Character - CHoCH or a bullish BOS) at the 4126 - 4124 buy zone before entering the trade to improve the probability of success.
Risk Management: Using the suggested Stop Loss (SL) is mandatory for capital protection.

XAU USD - correction playing out of ABC
I'm referring to the Daily price chart and key counts are in line with Wave counting and supply and demand curve trading levels based on fair value gap intervals of weekly trading sessions plotted to a daily chart at intervals of 60.
Current wave - 3 of 5 in the Elliott wave count.
Experiencing ABC corrective structure.
Corrective structure B has formed now nicely at $4,232. XX and rejected nicely, with a newly supply formed - based on A point of structure holding at at $4,372 - $4,217 zone within the inside candle.
Price has nicely breached the wick and sold off accordingly.
Now what happens?
two things -
1. Price will fall to $4000.00 and use this psychological zone and the previous order block to create and nice order block and move up - retaining the Demand control.
2. This looks to be a setup of a technical alignment of a drop, base, drop where price channel or corrective wave from Point B - to point C is forming.
The gap between on the daily structure left shows between $3,850 - 3,720 est is the real zone of interest where the Demand driver will derive from.
Master Key for zones
Black = Three Month
Blue = Monthly
Purple = weekly
Pink = Consolidative box example (Daily)
Orange = Daily
White = Wave
Red = Lines - Fibonacci, wave alignment.
Risk Warning
Trading leveraged products such as Forex, commodities and CFDs, carries with it a high level of risk and so may not be suitable for every investor. Prior to trading the foreign exchange, commodity or CFD market, consider your investment objectives, level of experience and risk appetite. You should never risk more than you can afford to lose. If you fail to understand or are uncertain of the risks involved, please seek independent advice and remember to conduct due diligence as criteria varies to suit the individual.
Below are some of the take aways from the video - please listen again incase any detail is missed.
Do you enjoy the setups?
Professional analyst with 8+ years experience in the capital markets
Focus on technical output not fundamentals
Focus on investing for long term positional moves
Provide updates where necessary - with new updated ideas tracking the progress.
If you like the idea, please leave a like or comment.
To all the followers, thank you for your continued support.
Thanks,
LVPA MMXXIV

GOLD TO TAKE ALL TIME HIGHI expect gold to reverse off the zone drawn, we buy upon confirmation(bullish reversal signal) on zone to take the high as liquidity.

FOMC Drama, XAU Comedy. Gold Has Its Own Script.Imagine the coming week…
Everything is moving kind of “normal” 😴… until we hit the big event:
👉 WEDNESDAY NIGHT — FOMC MINUTES.
🎭 SCENE ONE: BEFORE THE STORM
------------------------------
Tuesday night / Wednesday morning:
Gold is sitting just above 4,000…
Not mooning 🚀, not crashing 💥…
The whole market feels there’s a “verbal exam” coming from the Fed, but nobody knows the question yet 😅.
• Big funds (Smart Money):
– Some are lightly positioned,
– Others are flat on the sidelines,
– Nobody wants to go full degen size before reading the minutes 🙃.
• On your XAUMO chart:
– Below you: **Uploading Zone** around 4,00x – 4,05x
– Above you: **Offloading Zone** around 4,18x – 4,21x
– Price is stuck in between… exactly in the “middle of the sofa” 🛋️.
Retail traders on social media:
– “Gold is going 4,300 EASY bro” 🤡
– “No, it’s going back to 3,900, you’re all doomed” 😱
But the one who will actually settle this fight is NOT them… it’s the Fed 😏.
Time passes… we arrive at Wednesday:
🎬 SCENE TWO: THE DOOR OPENS — MINUTES DROPPED
----------------------------------------------
Around 9:00 p.m. Cairo time…
News screen flashes: **FOMC MINUTES RELEASED** 📜.
In one second:
• 10-year Treasury yields move hard:
– Either they drop fast,
– Or they rip up.
• Dollar index (DXY):
– Either breaks the day’s low,
– Or does a nice little spike-up flex 💪.
And here the **gold** story starts:
1️⃣ If the minutes are **DOVISH**
(Fed more scared of weak growth than of inflation):
– Yields start dropping,
– Dollar cools down and pulls back,
– Stocks grab some air and try to rally.
Gold?
→ First few seconds: pure noise… wick games 🎯.
Then:
• Big green candle pops on the chart,
• Volume jumps,
• Delta turns positive (people smashing the Ask like there’s a sale on gold 😂).
On the XAUMO map:
– 4,04x – 4,06x becomes **real Uploading**,
– A bullish MegaBar launches from there and drags us to mid-range 4,12x – 4,14x,
– A few sessions later we might re-test 4,18x – 4,20x again.
The story:
“Markets hear: Fed won’t murder the economy (yet) 🥲.
So some money sneaks out of the dollar and high yields…
and quietly slides into gold.”
2️⃣ If the minutes are **HAWKISH**
(Fed still frowning at inflation 😠):
– Yields rise or at least refuse to fall,
– Dollar tightens up and pushes higher,
– Equities get stressed.
Gold?
→ Maybe a spike up/down in the first minute (stop hunt classic 😏),
but then:
• Wider red candles,
• Negative delta (aggressive selling at Bid),
• Price abandons the upper edge of the range and walks down.
On XAUMO:
– 4,18x – 4,21x is confirmed as a **true Offloading Zone**:
• Bearish Kill Bars at the top,
• High RVOL but move is DOWN.
– Market starts probing 4,10x – 4,08x… and if pressure keeps going,
it tests 4,02x – 4,00x.
Story here:
“Wall Street hears: no pampering, kids. Rates stay high until inflation taps out 💪.
So anyone holding gold just as a ‘rate hedge’ starts trimming.
Diamond hands suddenly become paper hands 😬.”
🎯 SCENE THREE: AFTER THE SMOKE — RESETTING THE STAGE
-----------------------------------------------------
Whether the minutes are dovish or hawkish…
The important part is NOT the first 5 minutes of drama…
It’s **what happens after the first wave**:
• If DOVISH:
– Does gold keep pushing after the spike?
→ Does it build candles ABOVE 4,12x – 4,14x and hold?
If YES → market believed the story and we have **Uploading from below** ✅.
• If HAWKISH:
– Does every little bounce get sold?
→ Every time we approach 4,16x – 4,18x, a big seller shows up?
If YES → that’s **real Offloading above**, and odds of visiting 4,00x get higher 🚨.
Now your turn:
As a XAUMO analyst you don’t care about the headline alone…
You care about:
– Where did yields go?
– What did DXY actually do?
– At which zone did gold flip: **Uploading** or **Offloading**?
📌 TWO-LINE TL;DR
-----------------
Wednesday is not “just another news release”…
It’s the day the Fed tells the market:
“Am I here to relax you… or keep squeezing you?” 😈
And gold answers instantly:
– If relaxed → puts on the safe-haven halo and rallies from accumulation zones 👼.
– If squeezed → takes off the halo and drops from distribution zones, hunting for new buyers below 😏.
Your real job is NOT to predict the script…
Your job is **to read the play correctly**:
– Who is the strong buyer?
– Who is the heavy seller?
– And does the curtain fall on a NEW LOW or a NEW HIGH?
All of this is **EDUCATIONAL ONLY** 📘 —
not a buy/sell signal,
and not a replacement for your own risk plan.

Gold Trade OpportunityOANDA:XAUUSD
Gold started this week with an impulsive move from the demand zone (3869.29) and is currently at the resistance level (unmitigated H4 supply) at 4145 to 4130.
We could see price sell off to the levels of 4058 for a liquidity sweep and
alternatively Gold could perform a counter trend then continue its bullish run to towards 4360
Waiting for confirmation at the marked key level to make a clear and informed trading decision

GOLD LONG IDEAExpecting Gold to go long when the price reaches one of the demand zones and shows entry confirmation.
SL - Logical as per your strategy.
TP - Potential swing targets are shown on the chart.
Good luck.
