XAUUSD – Key Demand Test Ahead? (Next Week Outlook)Timeframe: 4H
Structure: Retracement into major demand
Bias: Watching for bullish reaction inside the 4025 zone
🔍 Market Context
Gold has just completed a sharp selloff after failing to sustain the highs above 4180–4200. The move down came with strong momentum, breaking through minor intraday supports and now heading into a major multi-touch structure zone.
This area has repeatedly acted as:
Previous support
Rejection zone (liquidity pool)
Base of the last impulsive rally
Your chart marks it perfectly: 4025–4040 is the key to next week.
🧲 Why This Zone Matters
Looking left, you can see:
Multiple rejections
Long wicks showing absorption
Consolidation before a bullish breakout
This tells us there’s resting demand, and it’s the type of area large players often defend — at least on first touch.
Price is now pulling back into this area with clean momentum, making this a classic “reaction zone” setup heading into next week.
🕊 Bullish Scenario
A bullish reaction becomes likely if:
Price taps deeper into 4025 AREA
We see a wick rejection or slowdown in bearish momentum
A higher-low forms on the lower timeframe (5m–15m)
Structure breaks back above 4055–4060
If this happens, we could see:
➡️ First target: 4075–4100 (intraday liquidity)
➡️ Next target: 4125–4150 AREA (imbalance fill / previous breakdown point)
This is the cleaner technical path, and it aligns with typical Gold behavior after sharp selloffs.
🔻 Bearish Scenario
If the 4025 zone fails to hold, this becomes a continuation move.
Things to watch:
A clean 4H close below 4025
Retest rejection from underneath
Increasing bearish volume
If we break and hold below the zone, next targets open up:
➡️ 4000 (psychological + whole level)
➡️ 3980–3970 (deeper liquidity sweep area)
This only triggers if the demand zone breaks convincingly.
🎯 Key Levels for Next Week
Major Support Zone:
🟡 405O
🟡 4025
Upside Liquidity:
🎯 4075
🎯 4100
🎯 4125–4150
Downside Liquidity:
⚪ 4000
⚪ 3975
Trade ideas

XAUUSD Strong Rejection From FVG, Watching for Long EntriesGold delivered a clean reaction from the Fair Value Gap (FVG), showing strong buyer interest at the discounted zone. Price also tapped into the Breaker Block, confirming that liquidity below the lows has already been swept.
With this reaction, short-term bullish momentum is building again.
🔍 Key Technical Points
• FVG filled perfectly, triggering an immediate bullish bounce.
• Liquidity sweep below previous lows shows sellers are exhausted.
• Price tapped into the Breaker Block, a strong reversal zone.
• Market has now shifted back above the short-term structure.
Buy Scenario
If price retests the small support zone highlighted on the chart, it may offer a clean continuation long setup.
📌 I will consider buy entries from the retest zone.
Targets remain toward the upper imbalance and recent highs.
🎯 Targets
• First target: Recovery to mid-range
• Main target: 4220+ area (as shown in your projection box)
🛑 Invalidation
A clean break below the FVG zone would invalidate the bullish setup.

XAUUSD Continuation?Based on my analysis for the upcoming Gold trade on Monday, the price has experienced a sharp drop, leaving behind a significant Fair Value Gap (FVG). I anticipate that before continuing its downtrend, the price will retest that FVG and subsequently drop again.

12/11/2025 XAUUSD SHORT TRIANGLE CORRECTION WAVE Bullish Continuation On Going 4182 For This Week
Stay safe, stay rational —
Good luck to everyone out there.

Channel Resistance Holding - Short OpportunityHello Followers, I am going to share you my opinion on gold next move..
Gold is working in a parallel channel couple of days, gold has formed a proper channel, it is respecting lower lows and lowers highs. gold Current Price is 3975.. It is possible that now gold fly high till the resistance area 4020/4045. And then it will form an other an otherwise around the target area 3850. If gold break the resistance then we have an stoploss around4090..
KEYPOINTS:
Current Price 3975
Target Area 3850
Resistance area 4020/4045
Stop Loss Point 4090

GOLD Is Going Up! Long!
Take a look at our analysis for GOLD.
Time Frame: 4h
Current Trend: Bullish
Sentiment: Oversold (based on 7-period RSI)
Forecast: Bullish
The price is testing a key support 4,087.79.
Current market trend & oversold RSI makes me think that buyers will push the price. I will anticipate a bullish movement at least to 4,161.33 level.
P.S
We determine oversold/overbought condition with RSI indicator.
When it drops below 30 - the market is considered to be oversold.
When it bounces above 70 - the market is considered to be overbought.
Like and subscribe and comment my ideas if you enjoy them!

Gold Price Faces Resistance Near 4,207—Potential Pullback AheadGold (XAU/USD) is testing the upper channel resistance around 4,207 after a strong rally. The chart suggests a possible short-term correction toward the 4,200–4,158 support zone before the next directional move.
🟡 1. Current Trend
Gold (XAU/USD) is trading in an ascending channel, indicating an overall bullish trend.
Price action has been forming higher highs and higher lows, confirming steady upward momentum.
---
🔴 2. Resistance Zone
The upper boundary of the channel and price level around 4,207 USD is acting as a strong resistance.
The chart shows multiple rejections near this zone, suggesting a potential short-term top or profit-taking area.
---
🟢 3. Support Levels
The first key support is near 4,200 USD, aligning with previous price consolidation.
A deeper correction could test 4,158 USD, which matches the lower channel trendline and Ichimoku support zone.
---
⚫ 4. Price Action Pattern
The boxed consolidations represent sideways accumulation phases before each breakout — a sign of strong buying pressure.
However, the latest consolidation near the channel top hints at buyer fatigue, which could lead to a pullback.
---
🟣 5. Expected Move (Short-Term Outlook)
The downward arrows on the chart suggest a potential retracement within the channel.
Price could dip toward 4,158–4,200 USD before finding fresh buying interest.
As long as price remains above 4,158, the bullish structure remains intact.
---
⚙️ 6. Trading Implications
Aggressive traders: May look for short opportunities near resistance (~4,207) with tight stops above the channel.
Conservative traders: May wait for a bounce confirmation around 4,158–4,200 to rejoin the uptrend.

Don't panic, we'll respond strategically to the market.
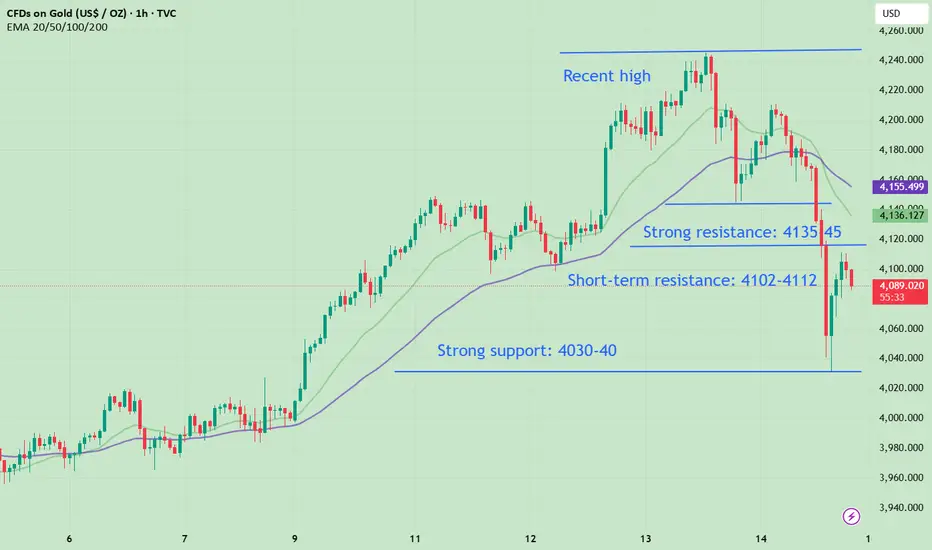
Recent comments from Federal Reserve officials have further reinforced bearish expectations. Gold prices rebounded quickly after touching the previous strong support level of $4030. The market may continue to decline during a period of consolidation. Don't panic, our strategy will be flexible and adaptable to market changes. The key short-term resistance level is the $4105-$4115 area. If gold prices rebound but fail to break through this range, an excellent shorting opportunity will emerge. The overall strategy remains unchanged: sell on rallies, looking for shorting opportunities in the $4105-$4115 area. The initial purchase should be a small position, allowing for expansion as prices rise. Considering it's Friday, we should close our short positions for profit promptly.
This was indeed a Black Friday. We only traded three times today. We opened a short position at 4209 in the Asian session and took profit at 4190. We also opened a long position at 4175 and sold at 4187. Then, we chased a short position after it broke the important support level of 4150, but unexpectedly, it continued to fall without any rebound. In the US session, we warned that this sentiment-driven decline carried significant risk, and advised waiting for the market to stabilize. We reiterate that everyone must control their position size, strictly set stop-loss orders, and never hold onto losing positions.
I focus solely on short-term trading and clear market analysis. In short-term trading, there is no market that always goes up or down; there are only correct entry points in the present moment. Find the rhythm and follow the trend. This is the essence of trading. Currently, you must seize every opportunity to buy on rebounds. If you cannot execute trades precisely, try the method I teach you: first test the market with a small position, then add to the position as it rises. This way, you won't miss any opportunities. If you are truly unsure when, where, and how to trade, let's work together to flexibly and steadily pursue greater profits in the ever-changing market!
(hidden) Confluence of support#Gold has a new shelf of volume that is centered on $4,000. This amount of volume has served as support 2 other times in the last 9 months.
That said, a hidden confluence of support may hit exactly in yellow highlight:
- MA20
- unformed tringle chord
- $4,000, as mentioned.

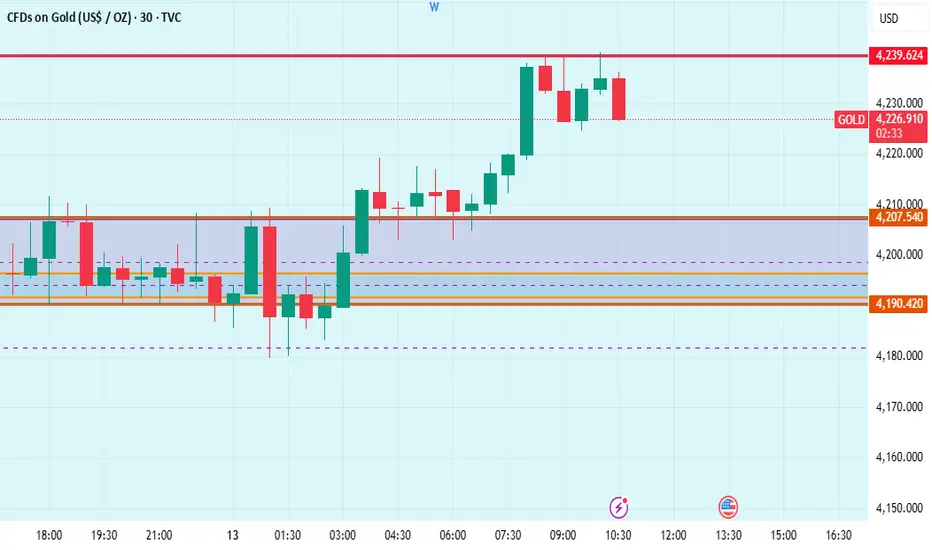
Gold prices have pulled back; consider buying around 4180.Gold prices have pulled back; consider buying around 4180.
As shown in the 30-minute chart:
Current Strategy:
BUY: 4170-4180 (limit)
SL: 4150
TP: 4200+
Gold prices are clearly experiencing selling pressure and a correction; the sharp drop presents a buying opportunity.
Current Support Range: 4170-4180 (Optimal Buying Range)
Strong Support Range: 4150
Trend Support: 4100-4120
Current Resistance: 4250-4280
Pullbacks are buying opportunities.
Just go for it!

Gold at a Turning Point — The Final Breath of Wave (ii)?Following our previous Gold analyses, where we perfectly anticipated the major drop, it now appears that the corrective wave (ii) is nearing completion.
Although a small push higher could still occur, the current price zone is extremely risky for long positions, and it’s time to start looking for sell setups instead. 📉
Based on the Elliott Wave structure and Fibonacci projections, once this correction ends, the market is likely to enter wave (iii) to the downside — typically the strongest and most aggressive part of the entire sequence.
At this stage, patience and disciplined risk management are key, as the main bearish trend may soon reclaim full control of the market. ⚔️
-----------------------------------------------------------------------------------------------
🚀 Who am I?
I'm Mahdi, a prop firm trader with 7+ years of experience in technical analysis, mainly focusing on Smart Money Concepts and Elliott Wave theory.
I specialize in delivering high-quality trading signals, market insights, and educational content tailored for serious traders and investors.
📊 My Tools: SMC, Elliott Wave, Fibonacci, Liquidity Grabs, Order Blocks
💼 Prop Challenge Passed: Yes | Funded Account: In Progress
🔗 Follow for consistent updates and trading insights.

Gold BubbleI think we are in an "everything bubble" presently.
The type of growth seen since 2020 has not been warranted in any sector, even with all the bonus money printed factored in...
That said, I think price will continue to rise rapidly afterward, since I believe we also hit the hyperinflation threshold some time ago.

Not an uptrend yet for gold (XAUUSD)—just a reboundNot an uptrend yet for gold (XAUUSD)—just a rebound; be careful of a sharp reversal.
Technical Analysis
1. XAUUSD rebounded to the 161.8% Fibonacci retracement around 4240, stalled, and has started to pull back. A bullish divergence between price and RSI has set, indicating the potential of a bearish reversal.
2. If XAUUSD falls below 4140, it would confirm the end of the rebound and could plunge lower to 4030, or even retest the prior low around 3900.
3. However, if the support at 4140 holds, the price may further spike to retest 4270 resistance before choosing the next direction.
Fundamental Analysis
4. US government reopening allows economic data to be released, clarifying the economic outlook, and reduces uncertainty, which may diminish demand for safe-haven assets.
5. However, if upcoming data point to a weaker labor market, expectations for Fed rate cuts would increase and support gold.
6. Meanwhile, CME FedWatch shows the market has trimmed the probability of a 0.25% cut in December to 49.9%, down from 62.9% yesterday. For the first time, markets now assign a slightly higher probability to a hold (50.1%) , which will pressure the gold price once traders internalize this shift.
Analysis by: Krisada Yoonaisil, Financial Markets Strategist at Exness

WENT TO DRAWING BOARD Back to business, i went back to drawing board to learn from yesterday failed trade and we are good to go now, mistake identified and noted. but i will limit how i update or post in the night and early morning because of rest and coming to work early most update will be after 9am UTC, and as i said earlier I become busy at work ofen but I will try and update when necessary, we begin proper from next week but we will still post any moment from now.
Re Entry sellSorry guys due to some busy shedule i could not share 1st sell and enjoy above 1000pips sell some booked but some still hold for final tp 4007 and now there is re entry sell so you can enter.
in previous sell we got sl but holding buy hit tp. dont worry about sl. sl is compulsory part of forex markete. they whose says we can not take sl they tells lie. when you will follow proper money managment then 200pips sl is not a big problem because we always get big tps like 400,600,800,1000 pips

Short-term selling plan for gold!Entry: 4120
🎯 Final Target: 4088
❌ Stop-Loss: (Add your SL)
📊 Market Analysis
Gold is showing a clear shift in momentum as price faces rejection near the upper resistance zone. Sellers are stepping in around 4120, signaling potential downside pressure.
A break and hold below this level strengthens the bearish outlook, suggesting that the market may retrace toward the lower liquidity zone around 4088. The intraday structure is weakening, with bearish candles forming and buyers failing to push higher. This behavior supports the idea of a short-term corrective move.
Traders should monitor for retests of the 4120 zone, rejection wicks, or declining bullish volume to confirm continuation toward the target area.

GOLD FREE SIGNAL|SHORT|
✅XAUUSD momentum shifted sharply after tapping the supply block, driving price into a clean displacement swing. With liquidity resting below, continuation toward the lower imbalance remains likely. Time Frame 1H.
—————————
Entry: 4084$
Stop Loss: 4110$
Take Profit: 4050$
Time Frame: 2H
—————————
SHORT🔥
✅Like and subscribe to never miss a new idea!✅

GOLD Local Short! Sell!
GOLD is sliding away from the horizontal supply zone, with bearish displacement hinting at continuation toward the next liquidity pocket below. Any minor pullback may simply serve as distribution before the markdown resumes. Time Frame 1H.
Sell!
Comment and subscribe to help us grow!
Check out other forecasts below too!
Disclosure: I am part of Trade Nation's Influencer program and receive a monthly fee for using their TradingView charts in my analysis.

DeGRAM | GOLD held mirror support📊 Technical Analysis
● XAU/USD has established a clear up-trend after rebounding from the $4,046 support and breaking above the descending resistance line; the new rising channel from early November signals buyers are in control.
● The price is now approaching the $4,138 resistance zone. A pullback to the channel’s support near ~$4,080 could offer a low-risk entry before extension toward next resistance near $4,377.
💡 Fundamental Analysis
● Gold is benefiting from softening U.S. inflation expectations and subdued Treasury yields, which weaken the dollar and enhance the appeal of safe-haven assets.
✨ Summary
Support around $4,046, target $4,377. Uptrend intact, breakout confirmed, favourable fundamentals support continuation.
-------------------
Share your opinion in the comments and support the idea with a like. Thanks for your support!

GOLD XAUUSDnewyork session rejected the 4243-4244 zone ,the technical analysis hinges on daily double top structure break of neckline and buyers return to retest a broken neckline at 4243 and dropped to 4146-4150 zone during the newyork session ,on 4hrs using the line chart we have a strong psychological horizontal structure and another break and retest to close newyork session on another 200pips buy trigger.
break and close 4146-4150 will be another bearish correction .

Is the plunge in gold prices a correction or part of a downtrend
News:
Gold struggled to gain traction above the $4,200 level, with a cautious stance on further easing in the absence of economic data prompting traders to reduce their bets on another rate cut in December. This, in turn, is seen as a key bearish factor for the non-yielding yellow metal.
The reopening of the US government has shifted market focus to a deteriorating fiscal outlook. Furthermore, market participants now seem to believe that delayed US macroeconomic data will show some economic weakness and support the rationale for further easing by the Federal Reserve.
Technical aspects:
In a continuously rising market, a single bearish pullback may be a correction in the bullish trend, not a reversal of the downtrend. Support lies around 4045-50, which is equivalent to the short-term moving average on the daily chart. A break below this level would confirm a potential bearish reversal. The intraday price action is crucial. If the bulls have rallied, the current pullback would confirm a bullish correction. Consider establishing positions around the 4045-50 area.
Trading strategy:
Buy:4050-4045, SL: 4035, TP: 4090-4120

Gold faces a test at 4100; time to prepare for positioningGold’s Downtrend Intensifies:
The decline in gold has accelerated, with the previous support at $4,150 now decisively broken. Based on prior price action, the next key support is located near $4,100, a level that the market tested twice during the earlier consolidation phase but failed to break, indicating strong structural support.
At the same time, the ascending trendline also converges near this area, adding further reinforcement to the support zone.
Therefore, $4,100 can be considered the key pivot level going forward. Should this level be breached, gold could face deeper downside risk, with a potential move back toward the $4,000 psychological level not out of the question.
However, as noted, the $4,100 area carries significant support, so monitoring the price reaction closely will be crucial. If this level holds, long positions may be considered.
If $4,100 breaks decisively, I believe momentum shorts (trend continuation trades) become viable.

Hellena | GOLD (4H): LONG to resistance area 4219.Colleagues, I am not abandoning the idea that the upward movement is not over yet.
It seems that the correction in wave “4” is very long and I think that it may continue to the support area 3807 and there is an important nuance - it is quite difficult to label all this movement as wave “C”, because it contradicts some rules of wave construction, but there are exceptions and I tend to interpret the downward movement in this way.
There is one more option, which does not contradict the rules and it is a “shortened wave ”5" at 4377, and then (ABC) looks more adequate, but I will not display this option. In both cases, I expect a resumption of the move to at least the 4219 area.
Fundamental context
Against the current macro backdrop, gold remains well-supported: the U.S. dollar is under pressure, and bond yields continue to decline after recent weaker economic data. This environment sustains demand for safe-haven assets.
Short-term pullbacks and profit-taking after record highs appear natural — overall interest in gold stays strong, particularly amid expectations of further Fed policy easing.
Manage your capital correctly and competently! Only enter trades based on reliable patterns!
