Gold Breakout and Potential RetraceHey Traders, in today's trading session we are monitoring XAUUSD for a buying opportunity around 4,080 zone, Gold was trading in a downtrend and successfully managed to break it out. Currently is in a correction phase in which it is approaching the retrace area at 4,080 support and resistance area.
Trade safe, Joe.
Trade ideas

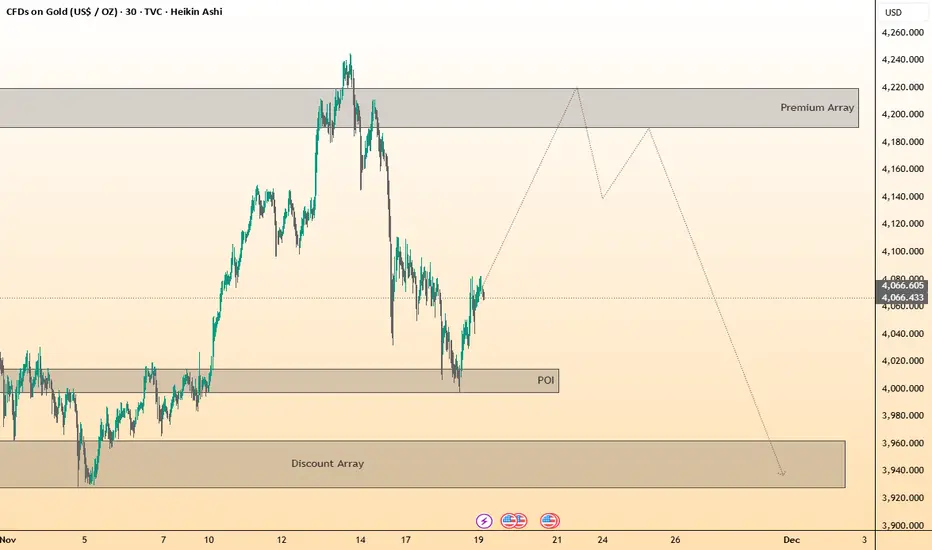
ICT-based structures and expected price projections.Key Elements Visible:
🔹 Current Market Price:
Price is trading around 4066.
🔹 Previous Swing High Zone:
A Premium Array is drawn as a large grey zone around the 4180–4220 area, indicating a potential distribution or sell zone where price may react after grabbing liquidity.
🔹 Previous Swing Low / POI:
A Point of Interest (POI) is marked below, around the 4000–4020 region. This is shown as a discount area where buyers may step in.
🔹 Discount Array:
At the bottom of the chart, a large Discount Array box is shaded, around the 3920–3980 zone, suggesting a deeper liquidity pool or bearish objective if the lower POIs are taken.
🔹 Projected Price Path:
A speculative line (market structure projection) is drawn showing:
A move upwards toward the Premium Array zone
Followed by a sharp reversal downward, targeting the Discount Array
🔹 Market Structure Context:
The current price appears in a retracement phase, attempting to recover from a previous sharp decline.
Sell Gold – Big Money ReturnsMajor structure: Strong downtrend confirmed
A previous upward Order Block was broken — clear reversal into bearish momentum
Entry 1: Fibonacci retracement zone of the down move → Use 50% volume
Entry 2: Retest of the broken Order Block high → Use full 100% volume
Monitor price action closely for signs of further liquidity hunts, new Wave/IMB formation, and manage SL/TP accordingly
This setup aligns with the V-Shark OB methodology: track the shark’s trail of big money, then ride the wave with discipline.
Disclaimer:
Trading carries risk. Past performance does not guarantee future results. Always use proper risk management and never risk more than you can afford to lose.
Tags:
#Gold #XAUUSD #Trading #OrderBlock #LiquidityHunt #VS Shark #VSharkOB #MarketStructure #TradingEducation #DayTrading #USAMarket

(GOLD Bullish Analysis) Idea)PNI UPDATE) CRT LEVEL
Technical Analysis of (XAUUSD – 30M)
Your chart shows a bullish structure forming after a breakout. Here’s the breakdown:
Downtrend Channel Broken
Price was moving inside a descending channel.
A strong bullish candle broke above the channel, signaling a possible trend change.
FVG (Fair Value Gap) + Demand Zone
Price came down to fill the FVG (fair value gap) inside a demand zone.
Buyers defended this area strongly — this confirms bullish interest.
Retest Completed
After breakout, price retested the zone again (the grey box).
This is a bullish continuation signal.
Bullish Impulse Expected
Your blue projection line is correct:
Price is showing signs of continuation toward the upside.
Target Point
Target shown: 4111.178
This aligns with:
Previous liquidity level
Recent swing high
Clean price imbalance above
Structure Summary
Trend: Bullish (after breakout)
Zone: Demand + FVG filled
Bias: Buy-side liquidity target
Expectation: Higher highs toward 4111
---
Conclusion
Your analysis is correct:
Market structure shows bullish continuation after a breakout + retest.
Target area around 4110–4112 makes sense.
Please support it like this idea 💡

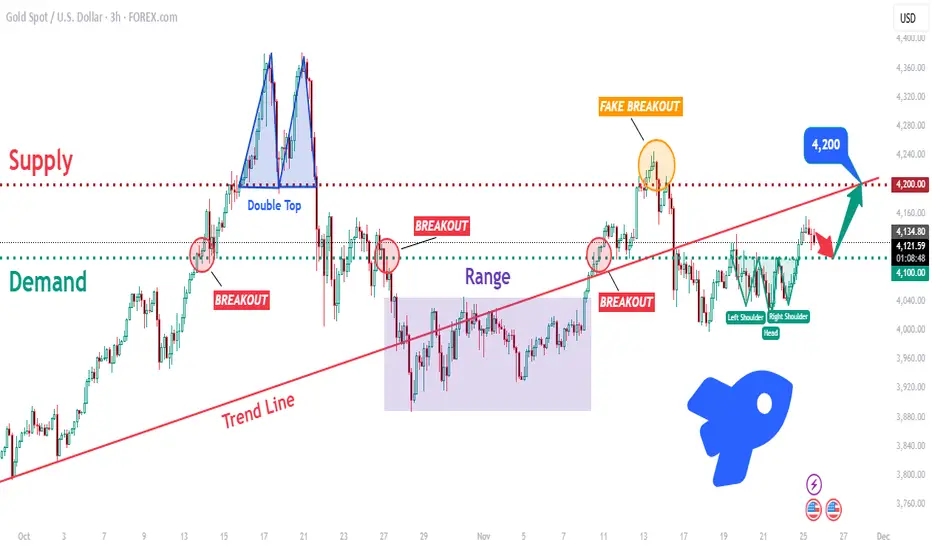
XAUUSD: Bulls Defend 4100! Is a Breakout to 4220 Imminent?Hello traders! XAUUSD continues to trade within a broader bullish structure, but with repeated volatility around key zones. The chart highlights how Gold has reacted multiple times to the major Demand Zone near 4,100, which has consistently acted as a strong support area. Each dip into this zone triggered a bullish response, confirming active buyers. Earlier in the structure, price formed a clear Double Top inside the Supply Zone around 4,220–4,230, which led to a strong bearish reversal and a breakdown below the trend line. After that, Gold entered a prolonged Range Phase, where the market consolidated sideways before breaking out to the upside. Recently, XAUUSD attempted a bullish continuation, but the move resulted in a Fake Breakout above the supply zone, signaling that buyers lacked the strength to maintain momentum above 4,220. This rejection pushed price downward and back below the main Trend Line, which now acts as dynamic resistance.
Currently, Gold is trading above the 4,100 Demand Zone, forming a potential Inverse Head and Shoulders pattern — an early sign that buyers may be preparing for another upward push. As long as price holds above 4,100 and stays above local structure, the bullish scenario remains valid.
My scenario, if XAUUSD holds above the 4,100 Demand Zone, buyers may gain momentum and attempt another breakout toward the 4,200–4,220 Supply Zone, which is the next major resistance and the primary upside target. A sustained break above 4,220 would confirm bullish strength and could open the path toward higher continuation targets. However, if buyers fail to hold the 4,100 level, Gold may drop back into the previous range or retest lower support areas before attempting another reversal. For now, the bias is moderately bullish, supported by demand reactions and reversal patterns — but a confirmed breakout above 4,200 is needed for stronger trend continuation. Manage your risk!
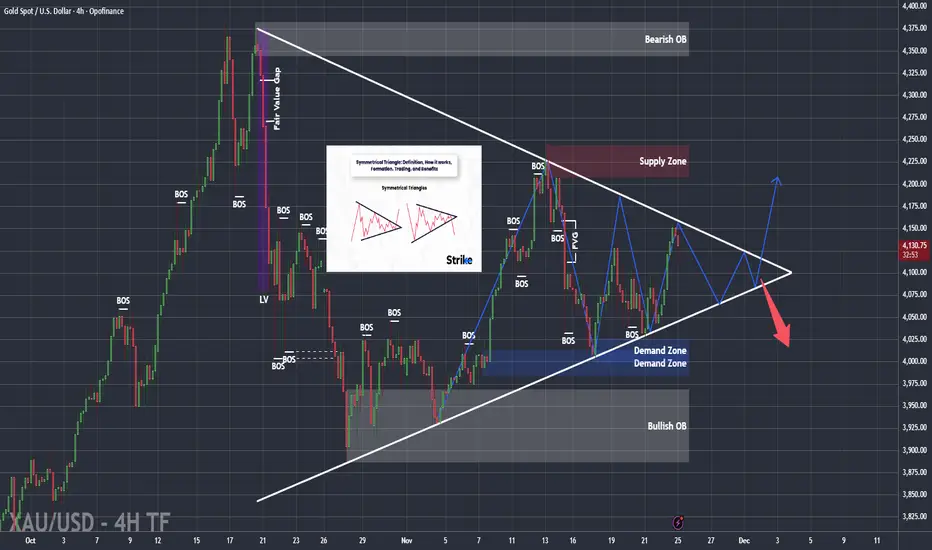
GOLD MARKET UPDATE – Symmetrical Triangle & Key Price ZonesHello Traders! 👋
- GOLD has once again reacted to the 4120–4140 resistance zone, which also aligns with the upper boundary of the Symmetrical Triangle. The price is forming lower highs, signaling weakening buying pressure and the return of short-term bearish momentum.
1. Key Technical Highlights
- Strong rejection at 4120–4140 (major Supply Zone + triangle resistance).
- Price continues to form lower highs, confirming seller presence.
- Market is consolidating inside a Symmetrical Triangle, showing compression and indecision.
- Key support area to watch: 4040–4060 (Demand Zone + triangle support).
- Short-term trend: bearish correction.
- Medium-term trend: sideways / consolidation inside the triangle.
2. Symmetrical Triangle – What It Means for GOLD
Based on the chart:
🔸 Upper trendline: descending – each retest creates a lower high.
🔸 Lower trendline: ascending – buyers are defending higher lows.
This structure forms a Symmetrical Triangle, indicating:
➡️ The market is building pressure and waiting for a major breakout.
➡️ Short-term bias favors a move toward the lower boundary due to the latest rejection at resistance.
Given current price behavior:
👉 GOLD is likely to drop toward 4060,
and potentially test 4040, the base of the triangle.
3. Price Expectation
If GOLD continues to fail at the 4140 resistance, the expected move is:
👉 TP1: 4060
👉 TP2: 4040
At 4040–4060, the market will likely decide the next big move:
1️⃣ Strong bullish reaction → triangle compression continues
2️⃣ Breakdown below 4040 → bearish breakout confirmed
4. Trade Signal (Technical Setup)
🔻 Preferred Sell Setup
Sell Zone: 4120–4140
Stop Loss: above 4160
Take Profit 1: 4080
Take Profit 2: 4060
Take Profit 3: 4040
➡️ This setup aligns with rejection at the triangle’s upper boundary + resistance.
5. Alternative Scenario
-If GOLD breaks above the Symmetrical Triangle and closes firmly above 4140: Short-term trend flips bullish
- Upside targets open toward: 4175- 4200 and potentially the higher bearish order block area
6. Risk Notes
- Symmetrical Triangles can produce false breakouts, so wait for candle confirmation.
- Avoid entering trades in the middle of the triangle, where risk is high.
- Best entries occur at the edges of the structure: 4120–4140 or 4040–4060.
Conclusion
- GOLD remains inside a Symmetrical Triangle, currently showing weakness at the upper boundary. With lower highs forming and supply active at 4120–4140, selling from resistance remains the preferred strategy.
- The market remains sideways until we get a decisive break above 4140 or below 4040.
What are your thoughts on GOLD? Comment now or join my group to trade with me on description
Gold NY Session Strategy 11/19: Will up to 4162 Gold Daily Plan – SMC Outlook (Nov 20)
Framework: CHoCH – BOS – FVG – POI – Premium/Discount Model
1. Market Context
Gold continues to recover after the sharp drop earlier this week. Price is now approaching the Premium zone of the current bullish swing and tapping into H1 supply. The market shows:
Buyers still in short-term control
Momentum weakening as price reaches resistance
A corrective pullback into Discount is likely before any further expansion
2. Structural Overview (SMC Logic)
🔻 Overall Market Structure
A key BOS formed around 4090–4100 → confirms short-term bullish structure
Follow-up CHoCH signals continuation of the intraday uptrend
Price is moving toward the upper FVG + Supply Zone (4160–4162)
🔸 Orderflow Notes
Strong reaction at the 4140 area → clear presence of passive Sell Limit absorption
Demand POI at 4091–4089 held exceptionally well → main bullish mitigation zone
3. Trading Zones (POI)
✅ BUY Zone (Discount Area)
4091 – 4089
Demand + previous CHoCH + fib 1.272 confluence
Ideal low-risk long setup within Discount
Suggested SL: 4087
BUY Scenario:
Price retraces to POI → shows bullish reaction → long toward Premium.
❗️ SELL Zones (Premium Area)
Aggressive Sell Zone:
4143 – 4145
SL: 4147
Optimal Sell Zone:
4160 – 4162
Major supply + imbalance + fib 2.618 extension
Highest probability for reversal
SL: 4165
4. Trade Scenarios
📌 Primary Scenario (High Probability)
Price retraces into 4091–4089 Demand
Look for CHoCH/BOS confirmation on lower timeframe
Enter BUY → target 4143 → 4160
→ Classic SMC model: Buy from Discount → Sell from Premium.
📌 Alternative Scenario
If price rallies straight into 4143–4162 without retracement:
ONLY enter SELL when a clear bearish CHoCH or strong rejection forms
Target: 4100 → 4090
5. Intraday Bias
→ Bullish in Discount zones – Bearish in Premium zones.
Trade based on orderflow → Do not chase price in the middle range.
6. Summary
BUY: 4091–4089 (SL 4087) → TP: 4140 – 4160
SELL:
• 4143–4145 (SL 4147)
• 4160–4162 (SL 4165)
Wait for confirmation at each POI; avoid mid-range entries.


XAUUSD INTRADAY – Breakout + Retest Reaction SetupFOREXCOM:XAUUSD
Key Scenarios
✅ Bullish Case (Primary Bias)
If price holds the 4060–4070 retest zone and prints bullish confirmation, buyers may target:
🎯 1st Target: 4105–4112
🎯 2nd Target: 4150–4165
This scenario remains valid as long as price stays above 4040.
❌ Bearish Case (Invalidation Trigger)
If price fails to hold above 4040 and breaks below the demand zone, a deeper sell-side expansion may follow toward:
Only a clean break below 4040 shifts sentiment bearish.
Current Levels to Watch
Supply Zone: 4060–4075
Support Zone / Entry Interest: 4045–4040
Key Demand: 4025–4035
Major Resistance: 4165–4175
⚠️ Disclaimer:
This analysis is for educational purposes only. It is not financial advice. Please manage risk and trade based on your own strategy.

Elise : XAUUSD 2H — Breakout Retest Accumulation Setup |OANDA:XAUUSD
Key Scenarios
✅ Bullish Case (Primary)
A confirmed break and hold above 4135–4150 supply opens the door for bullish continuation toward:
🎯 Target 1: 4281
🎯 Target 2: 4374 (extended trendline & previous rejection zone)
Bullish structure remains valid above 4035.
❌ Bearish Case (Invalidation)
A clean close below the demand zone 4030–4000 would signal weakness, potentially sending price toward:
Current Levels to Watch
Demand Zone: 4035–4060
Supply / Breakout Zone: 4135–4150
Extended Resistance: 4281 / 4374
⚠️ Disclaimer:
This analysis is for educational purposes only — not financial advice. Always manage risk.

GOLD 4H CHART ROUTE MAP UPDATE & TRADING PLAN FOR THE WEEKHey Everyone,
Please see our updated 4h chart levels and targets for the coming week.
We are seeing price play between two weighted levels with a gap above at 4124 and a gap below at 4042. We will need to see ema5 cross and lock on either weighted level to determine the next range.
We will see levels tested side by side until one of the weighted levels break and lock to confirm direction for the next range.
We will keep the above in mind when taking buys from dips. Our updated levels and weighted levels will allow us to track the movement down and then catch bounces up.
We will continue to buy dips using our support levels taking 20 to 40 pips. As stated before each of our level structures give 20 to 40 pip bounces, which is enough for a nice entry and exit. If you back test the levels we shared every week for the past 24 months, you can see how effectively they were used to trade with or against short/mid term swings and trends.
The swing range give bigger bounces then our weighted levels that's the difference between weighted levels and swing ranges.
BULLISH TARGET
4124
EMA5 CROSS AND LOCK ABOVE 4124 WILL OPEN THE FOLLOWING BULLISH TARGETS
4212
EMA5 CROSS AND LOCK ABOVE 4212 WILL OPEN THE FOLLOWING BULLISH TARGET
4328
EMA5 CROSS AND LOCK ABOVE 4328 WILL OPEN THE FOLLOWING BULLISH TARGET
4422
EMA5 CROSS AND LOCK ABOVE 4422 WILL OPEN THE FOLLOWING BULLISH TARGET
4422
EMA5 CROSS AND LOCK ABOVE 4422 WILL OPEN THE FOLLOWING BULLISH TARGET
4494
BEARISH TARGETS
4042
EMA5 CROSS AND LOCK BELOW 4042WILL OPEN THE FOLLOWING BEARISH TARGET
3964
EMA5 CROSS AND LOCK BELOW 3964 WILL OPEN THE FOLLOWING BEARISH TARGET
3873
EMA5 CROSS AND LOCK BELOW 3873 WILL OPEN THE SWING RANGE
3767
3646
As always, we will keep you all updated with regular updates throughout the week and how we manage the active ideas and setups. Thank you all for your likes, comments and follows, we really appreciate it!
Mr Gold
GoldViewFX

GOLD 1H CHART ROUTE MAP UPDATE & TRADING PLAN FOR THE WEEKHey Everyone,
Please see our updated 1h chart levels and targets for the coming week.
We are seeing price play between two weighted levels with a gap above at 4114 and a gap below at 4057. We will need to see ema5 cross and lock on either weighted level to determine the next range.
We will see levels tested side by side until one of the weighted levels break and lock to confirm direction for the next range.
We will keep the above in mind when taking buys from dips. Our updated levels and weighted levels will allow us to track the movement down and then catch bounces up.
We will continue to buy dips using our support levels taking 20 to 40 pips. As stated before each of our level structures give 20 to 40 pip bounces, which is enough for a nice entry and exit. If you back test the levels we shared every week for the past 24 months, you can see how effectively they were used to trade with or against short/mid term swings and trends.
The swing range give bigger bounces then our weighted levels that's the difference between weighted levels and swing ranges.
BULLISH TARGET
4114
EMA5 CROSS AND LOCK ABOVE 4114 WILL OPEN THE FOLLOWING BULLISH TARGETS
4175
EMA5 CROSS AND LOCK ABOVE 4175 WILL OPEN THE FOLLOWING BULLISH TARGET
4232
EMA5 CROSS AND LOCK ABOVE 4232 WILL OPEN THE FOLLOWING BULLISH TARGET
4289
EMA5 CROSS AND LOCK ABOVE 4289 WILL OPEN THE FOLLOWING BULLISH TARGET
4361
BEARISH TARGETS
4057
EMA5 CROSS AND LOCK BELOW 4057 WILL OPEN THE FOLLOWING BEARISH TARGET
4006
EMA5 CROSS AND LOCK BELOW 4006 WILL OPEN THE FOLLOWING BEARISH TARGET
3965
EMA5 CROSS AND LOCK BELOW 3965 WILL OPEN THE SWING RANGE
3923
3861
As always, we will keep you all updated with regular updates throughout the week and how we manage the active ideas and setups. Thank you all for your likes, comments and follows, we really appreciate it!
Mr Gold
GoldViewFX

FIRST IDEAFirst ever post, looks strange but i think it will work. Very very small stop loss. Pattern Inverse Head and Shoulders 4h. Just an Idea

Avoiding Good Trades?Why Your Mind Hesitates on High-Quality Setups (But Jumps Into Mediocre Ones)
Be honest with yourself:
How many times has this happened?
A high-quality setup appears → suddenly you feel cautious. You hesitate. You “want to see one more candle.”
A mediocre or unclear setup appears → you feel bold, almost too willing to execute.
If this is you, you’re not alone — this behavior is extremely common.
And it has nothing to do with discipline…
It’s your psychology reacting to the wrong type of risk.
Your mind overprotects you during the good setups (because they appear after long waiting, uncertainty, or drawdown)…
And it underestimates danger during familiar, low-quality ones.
This single distortion silently destroys performance for thousands of traders.
The Fix
1. Define your setups — but verify how often they actually appear.
Most traders try to label confluences or build “A+ setups” without ever checking availability.
They don’t know how frequently those conditions appear in real market data.
So they expect setups that simply don’t exist often enough — which creates frustration and hesitation exactly when a real one finally shows up.
If you don’t know availability, you will always misjudge opportunity.
2. Pre-commit to risk — because structure evolves faster than your emotions.
Traders struggle with pre-commitment because structure changes quickly:
breaks, sweeps, displacements, retracements.
By the time a good setup forms, you may have only a few seconds to make a correct decision.
If you try to calculate risk in the moment, hesitation takes over.
Pre-commitment isn’t about forcing size — it’s about removing the decision fatigue that kills high-quality trades.
3. Build a routine that includes emotional resistance, not just rules.
A real routine is not just a checklist.
It’s understanding the emotional friction you’ll face every single time:
hesitation
fear spikes
overthinking
temptation to micro-time entries
the urge to wait for one more confirmation
When you anticipate these reactions, they stop controlling you.
Your routine becomes a stabilizing mechanism that protects your best trades from your worst impulses.
If this resonates… follow this account.
I share insights on structure, availability, psychology, and execution — the real stuff traders actually struggle with.
And drop a comment:
👉 What’s ONE thing you know you should do consistently, but still feel resistance toward?
Your answer might be the next topic.

Gold 30-Min — Volume Buy Reversal Triggered⚡Base : Hanzo Trading Alpha Algorithm
The algorithm calculates volatility displacement vs liquidity recovery, identifying where probability meets imbalance.
It trades only where precision, volume, and manipulation intersect —only logic.
✈️ Technical Reasons
/ Direction — LONG / Reversal 4060 Area
☄️Bullish momentum confirmed through strong candle body.
☄️Structure shifted with higher-low near key demand base.
☄️Volume expanding confirms order-flow alignment upward.
☄️Buyers reclaimed imbalance with sustained clean break.
☄️Algorithm detects rising momentum under low liquidity.
⚙️ Hanzo Alpha Trading Protocol
The Alpha Candle defines the day’s real control zone — the first battle of momentum.
From this origin, the Volume Window reveals where the next precision strike begins.
⚙️ Hanzo Volume Window / Map
Window tracked from 10:30 — mapping true market behavior.
POC alignment exposes institutional bias and breakout potential zones.
⚙️ Hanzo Delta Window / Pulse
Delta window monitors real buying vs. selling power behind each move.
Tracks volume aggression to expose who controls the candle — buyers or sellers.
When Delta aligns with Volume Map, momentum becomes undeniable.

Gold Losing 4050 Support – 4K Now at Risk1. What Happened Yesterday
Gold broke below the key 4050 support zone and continued to decline, coming very close to the psychological 4000 level.
This is the most significant bearish continuation we’ve seen since the strong rally earlier this month.
2. Current Market Context
At the time of writing, price is showing only a weak and shallow rebound, hovering around 4017.
Momentum remains bearish, and structurally, the market looks vulnerable to a clean break below 4K.
3. Technical Outlook
If price continues lower, the 3950–3970 zone becomes highly relevant. This area represents a medium-term bullish demand zone, and a drop into it could offer a meaningful buying opportunity — but only with confirmation.
Right now, the structure remains bearish. A genuine shift back to bullish conditions would require:
- A reclaim of 4050, and more importantly
- A stabilization above that level, not just a wick or intraday spike.
Without that, any bounce is just noise inside a bearish trend.
4. Trading Plan
- Bearish bias remains active as long as price trades under 4050
- A flush into 3950–3970 could be a buy zone, but only if price shows clear support and reversal signs
- Until then, bulls are on defense, and shorts continue to have the advantage
5. Conclusion
Gold is under pressure, and a break below 4K is a strong possibility. A deeper drop may eventually turn into an opportunity for medium-term buyers, but at this moment the structure is bearish and caution is required.

Gold Extends Rally Toward New Highs as Fed Cut Bets IncreaseGold Extends Rally Toward New Highs as Fed Cut Bets Increase
We are following gold from 4030 to the current price and the price has already reached our first major target at 4150.
Currently, gold came out of a strong area near 4130. We can also see that Gold wanted to fall again but stopped near 4110.
After the weaker-than-expected US PPI data, the market is expecting a possible rate cut from the FED meeting in December, thus increasing the chances of gold rising further.
Volume is still low but it may increase during the coming days. Gold appears poised to reach 4,230 and 4,290.
Our analysis did not change because there is nothing to change :)
You may find more details in the chart!
Thank you and Good Luck!
❤️PS: Please support with a like or comment if you find this analysis useful for your trading day❤️

GOLD – Key Levels Ahead of Jobs Data | Bearish Below 4083GOLD | OVERVIEW
Gold fell more than 1% as a stronger U.S. dollar and reduced expectations for a December Fed rate cut pressured prices.
Traders are now awaiting the delayed U.S. jobs report, which is expected to increase volatility.
Market movement remains choppy, which is typical for this time of year as profit-taking and book-squaring overlap with early positioning ahead of the new year.
Markets now await the delayed U.S. jobs report, which may bring sharp price swings.
🔽 Below 4083: Bearish continuation toward 4054 → 4038 → 4008 → 3982
🔼 Above 4083: Bullish move toward 4104 → 4133 → 4147
Pivot: 4076–4083
Support: 4054 · 4038 · 4008 · 3982
Resistance: 4104 · 4133 · 4147
Gold stays bearish under 4083, but a confirmed 1H close above this level will activate the bullish scenario

Gold Price Poised for Breakout as Bullish Channel StrengthensHi!
Market Structure Overview
Price is moving within a clearly defined ascending channel, forming higher highs and higher lows. The recent pullback corrected only about 35% of the previous bullish leg, indicating that buyers are still in control and momentum remains positive.
Key Support Zone (Green Area 4,150–4,175)
This zone represents a former supply that has now flipped into a potential demand area. Price is currently pushing into it from below, and the reaction here will determine the next major move. A clean break and hold above this zone would signal strength and open the path toward higher targets.
Breakout Scenario
If price breaks above the green resistance block, the chart suggests a bullish continuation toward the major supply zone highlighted in red (4,220). The drawn arrow implies that momentum could accelerate once the breakout confirms, aligning with the channel’s upper boundary.
Upside Target (Red Zone 4,220)
This red area represents a strong supply where sellers previously stepped in aggressively. Should price reach this level again, some form of reaction or correction is likely.
Downside Risk
If the breakout fails and price rejects the green zone, a retracement back toward the mid-channel dashed line or even the lower channel boundary would be the next logical move.
Disclaimer: As part of ThinkMarkets’ Influencer Program, I am sponsored to share and publish their charts in my analysis.

DeGRAM | GOLD is preparing to rebound from the $4k level📊 Technical Analysis
● XAU/USD is holding above the 4,040–4,060 support zone, aligning with the rising trendline that has produced multiple higher lows, indicating sustained buyer defense.
● Price is compressing beneath the descending resistance line; a breakout toward 4,138 and then 4,211 becomes likely once structure lifts above 4,097.
💡 Fundamental Analysis
● Gold is supported by cooling U.S. yields and steady safe-haven demand as global risk sentiment remains fragile.
✨ Summary
Support: 4,040–4,060. Targets: 4,138 → 4,211. Bias remains bullish above rising support.
-------------------
Share your opinion in the comments and support the idea with a like. Thanks for your support!

BULLISH SCENARIO - GOLDHello traders,
the gold price has reached the resistance level (4111 – 4096).
Let's expect the bullish scenario:
If the market breaks this resistance zone and closes above it,
we can anticipate a bullish move 📈
🎯 TARGET: 4184

XAUUSD Breakout & Demand Zone Long Setup (30m Timeframe)This chart shows XAUUSD on the 30-minute timeframe, where price has broken out of a descending trendline, indicating potential bullish momentum. After the breakout, price retested the nearby demand zone (highlighted in pink) and is now pushing upward.
A long (buy) setup has been marked with:
Entry: After trendline breakout & demand zone retest
Stop Loss: Below the demand zone
Take Profit: Toward the major supply/resistance zone above (highlighted in red)
This setup reflects a classic trendline breakout + retest continuation pattern, targeting the next key resistance area.

Nov 19, 2025 - XAUUSD GOLD Analysis and Potential Opportunity📊 Analysis:
There are early signs of downside exhaustion on the higher timeframes.
For now, I’ll use 4030 as the main bull–bear pivot:
• Above 4030, the plan is to buy pullbacks into support.
• Below 4030, the plan shifts to selling rallies into resistance.
If price drops toward 3998–4000, watch this support zone closely —
• If it holds, bulls still have a chance.
• If it breaks, bearish momentum will strengthen significantly.
🔍 Key Levels to Watch:
• 4096 – Resistance
• 4089 – Resistance
• 4082 – Resistance
• 4075 – Resistance
• 4065 – Support
• 4055 – Support
• 4030 – Bull–bear pivot
• 3998–4000 – Psychological support zone
📈 Intraday Strategy:
SELL: If price breaks below 4030 → target 4025, with further downside toward 4020, 4015, 4007
BUY: If price holds above 4075 → target 4078, with further upside toward 4082, 4089, 4095
