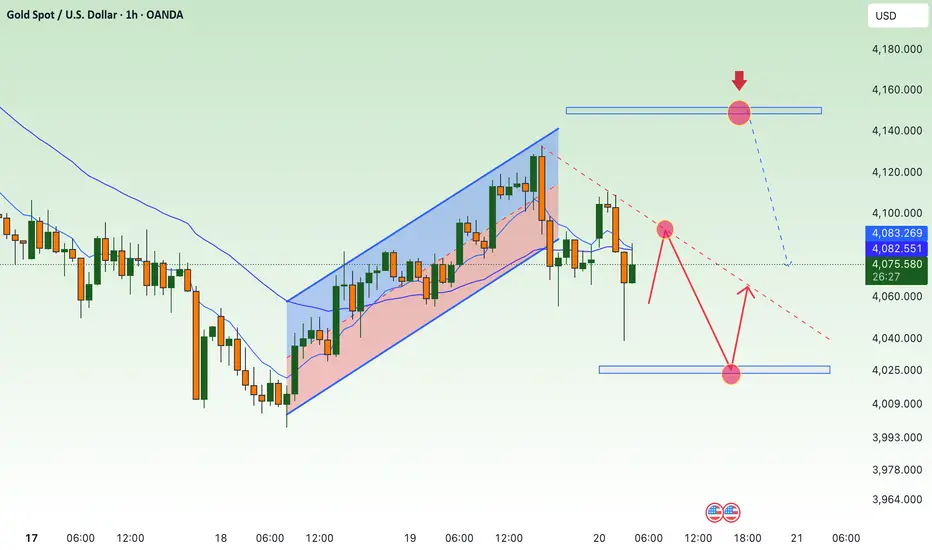
GOLD XAUUSD 60mins BUY Trade ForecastStalking Xau for a potential bullish movement.
All we need now as confirmation to proceed Long with gold on 15/60mins TF is t he inability of price to continue short beyond the drawn line as depicted on the chart.
Will update you once the ticks are green and ready for the launch.
:)
Trade ideas

GOLD rises amid uncertain signals from US economyOANDA:XAUUSD continued to rise in Wednesday's session, as investors increased their holdings of safe-haven assets amid the delay of US employment data due to the government shutdown and the market prepared for the minutes of the Federal Reserve's October meeting.
As of the morning of November 20, spot gold was trading around $4,078/ounce, up about $11, or 0.27%, from the previous day.
Gold's rise coincided with the stabilization of global stocks after a sell-off related to concerns about artificial intelligence valuations. However, investor sentiment remained cautious ahead of Nvidia's business results and a series of US economic data due this week.
Weakening labor market signals support OANDA:XAUUSD
Data released on Tuesday showed the number of Americans receiving unemployment benefits rose to a two-month high in mid-October, a sign that the labor market may be losing momentum.
Against this backdrop, any signs of labor market weakness would reinforce expectations that the Fed may have to ease policy more quickly, providing support for gold, a non-yielding asset that benefits from lower interest rates.
Market focus: Fed minutes and delayed jobs data
Investors are turning their attention to the minutes from the Fed’s October meeting, due at 2 p.m. ET. Despite the 25 basis point cut at its most recent meeting, Chairman Jerome Powell continued to maintain a cautious stance, leaving open the possibility of a pause in easing if inflation risks return.
Separately, the September jobs report, delayed by the government shutdown, is due out on Thursday. This is seen as an early indicator of economic growth strength, with Reuters forecasting non-farm payrolls to rise by around 50,000 jobs.
Any weaker-than-expected figure could boost haven demand and continue to support gold prices.
Rising interest rate cut expectations, a key driver of OANDA:XAUUSD
According to CME FedWatch, the market now rates a 51% chance of the Fed cutting rates again at its next meeting, up from 46% in the previous session.
This increase in expectations is the core factor triggering capital flows to gold, in the context of falling real yields and investors looking for value preservation as the growth outlook becomes more uncertain.
TECHNICAL ANALYSIS AND SUGGESTIONS OANDA:XAUUSD
After recovering from the bottom around $4,000, gold price hit the 0.236 Fibonacci retracement at $4,128 and was immediately rejected, showing that profit-taking pressure is still strong.
• The main trend is still up, as the price is still in the medium-term uptrend channel and above the important MA line.
• The 3,972 area (Fib 0.382) is acting as short-term support, accompanied by the MA line right below around 3,942.
• Since it has not been able to break the 0.382 Fib level, gold is currently not in the best condition for a new uptrend.
RSI has rebounded but has not yet exceeded 60, showing that the buyers have not fully returned, but there are no signs of strong weakness.
SELL XAUUSD PRICE 4108 - 4106⚡️
↠↠ Stop Loss 4112
→Take Profit 1 4100
↨
→Take Profit 2 4094
BUY XAUUSD PRICE 3982 - 3984⚡️
↠↠ Stop Loss 3978
→Take Profit 1 3990
↨
→Take Profit 2 3996

possible path📊 Gold (XAUUSD) Mid-Term Outlook — Technical Analysis
In this analysis, gold is navigating a corrective phase inside a clearly defined descending channel, following its sharp rally toward all-time highs. Price action suggests a potential continuation of bearish pressure in the short term (red path), with the market likely to revisit the major demand zone highlighted between previous consolidation levels.
This demand area aligns perfectly with the lower boundary of the channel, creating a strong confluence for a possible trend reversal.
Should buyers step in at this zone, gold could break out of the channel and transition into a new bullish structure (green path). A confirmed breakout and retest can open the door for a strong upward leg, with medium-term targets at:
$4,186 — Key structural resistance
$5,000 — Major psychological level and projected long-term target
The projection captures two potential scenarios:
🔻 Short-term bearish continuation toward the demand zone
🔺 Mid-term bullish reversal leading toward record highs
This analysis blends structure, trend channels, and price behavior to outline the most probable paths for gold in the coming months.

XAU/USD: Bullish Push to 4158?As the previous analysis worked exactly as predicted, FX:XAUUSD is eyeing a bullish push on the 1-hour chart , with price rebounding from a key support zone near cumulative sell liquidation, converging with a potential entry area that could ignite upside momentum if buyers defend against short-term dips. This setup suggests a reversal opportunity amid recent consolidation, targeting higher levels with strong risk-reward.
Entry between 4020-4032 for a long position🎯. Targets at 4158 (main). Set a stop loss at 3990 to limit exposure📊, yielding a risk-reward ratio of approximately 1:3 . Monitor for confirmation via a bullish candle close above entry with rising volume, leveraging gold's safe-haven appeal.🌟
Fundamentally , gold is attempting to stabilize above $4,000 after a sharp pullback, with early signs of a short-term rebound as markets digest fading Fed rate cut hopes and await key US data. Forecasts indicate an average of $3,675/oz by Q4 2025, but recent surges to $4,239 highlight volatility driven by ETF flows and central bank policies. 💡
📝 Trade Setup
🎯 Entry Zone (Long): 4020 – 4032
🎯 Target (TP1): 4158
❌ Stop Loss: 3990
⚖️ Risk-to-Reward: Approximately 1:3, offering a solid reward structure with defined downside.
What's your outlook on this setup? Drop your thoughts below! 👇

XAUUSD – Resistance Rejection Anticipated Toward 3,997EMA 50 (blue) trending below price but still pointing downward.
EMA 200 (black) well above price, suggesting the overall larger trend remains bearish.
A large resistance zone marked around 4,095–4,115.
Price is currently around 4,060.
The analyst has drawn arrows indicating a potential retracement up into the resistance zone, followed by a sell-off toward a target around 3,997.
🧠 Interpretation of the Analysis on the Chart
1. Resistance Zone
The shaded blue region marks a major supply area where:
Price previously consolidated
Sellers dominated before pushing down
This area coincides with the region where:
Price might retest the 200 EMA overhead
Previous structure created liquidity
2. Expected Move
The arrows suggest the following scenario:
Price rallies slightly higher (likely to tap the resistance zone or sweep local highs).
After that, it rejects from resistance, respecting the bearish higher-timeframe direction.
A continuation move leads price down to the target at around 3,997.
This aligns with:
Trend continuation
Mean-reversion to the bearish EMA structure
🎯 Target Level
3,997 is likely selected because:
It’s a previous swing low
It aligns with a liquidity pool or demand imbalance
It is a natural downside magnet when momentum stays bearish
🧭 Bottom Line
The chart you posted reflects a bearish setup anticipating:
A pullback into resistance, followed by
A sell-off targeting ~3,997
This matches common Smart Money Concepts (SMC) ideas: mitigation → rejection → continuation.

XAUUSD- Strength near 4000 key InflectionThe Support Level
The 4000 zone has acted as a key inflection point, both as support and resistance, since October. Price has been oscillating around this level, consistently finding strength above it and struggle below it.
At present, the market is once again retesting this crucial level. As price approaches 4000, several technical cues are signaling potential underlying strength.
Loss of Downside Momentum
To begin with, there is a clear loss of downside momentum. We witnessed a sharp 100-point decline from the 13 Nov swing high in just three candles. This was followed by a -179 point slide over six candles (acceptable) but then a much slower -106 point drop stretched across 18 candles.
Why did the market suddenly take significantly longer to cover a similar distance from the 14 Nov highs?
This deceleration suggests waning bearish momentum as price nears support.
This observation is further validated by a bullish RSI divergence forming at the lows.
Decreasing Volumes
Additionally, the recent downswing from 4054 has been accompanied by declining volume- a classic sign of seller exhaustion. When falling price is not supported by expanding volume, it often hints at an impending reversal or at least a relief bounce.
Potential for Buy
Structurally, the market is still in a short-term downtrend, printing lower highs and lower lows since the 13 Nov peak. Aggressive traders may look for a bullish reversal signal in the 4000 demand zone, while conservative traders might prefer waiting for a confirmed shift in market structure, a higher high followed by a higher low on lower timeframes, before positioning long.
At this juncture, it’s difficult to justify a fresh short, given the confluence of support, momentum divergence, and volume behavior.
How do you usually evaluate the market when it approaches major support or resistance zones?
📣Disclaimer:
Everything shared here is meant for education and general awareness only. It’s not financial advice, nor a recommendation to buy, sell, or hold any asset. Do your own research, manage your risk, and make sure you understand what you’re getting into.

Gold Nearing the 50% Black Channel Level – Will It Reject or AvoXAUUSD – Gold Technical Update
Gold is moving closer to the 50% midpoint of the main black channel,
a key level highlighted in the latest weekly analysis.
This zone has previously acted as a strong reaction point,
and the market is now approaching it once again.
Key Scenarios:
📉 Bearish Scenario:
If gold continues downward and breaks below the 50% level of the black channel,
this could trigger a deeper correction and open the way toward lower channel targets.
📈 Bullish Scenario:
If gold fails to reach the 50% level and reverses early,
or if it touches the level and bounces strongly,
a bullish reaction may form, leading to upward continuation.
This area is the decision point:
Rejection → Potential bullish move
or
Break → Possible bearish continuation
Further updates will be posted once price confirms direction.

GOLD LONG FROM SUPPORT
GOLD SIGNAL
Trade Direction: long
Entry Level: 4,043.86
Target Level: 4,189.14
Stop Loss: 3,946.77
RISK PROFILE
Risk level: medium
Suggested risk: 1%
Timeframe: 9h
Disclosure: I am part of Trade Nation's Influencer program and receive a monthly fee for using their TradingView charts in my analysis.
✅LIKE AND COMMENT MY IDEAS✅

Gold price continues to decrease, 4000⭐️GOLDEN INFORMATION:
Gold (XAU/USD) edges up toward $4,110 in early Asian trading on Thursday, supported by a cautious market mood and lingering uncertainty around the US economy. Traders now await the US September NFP report later in the day.
Heightened uncertainty—exacerbated by delayed labor data following the recent government shutdown—has complicated the Fed’s assessment of the job market, boosting demand for safe-haven assets like gold. The long-awaited September jobs report will be closely watched for signals on labor conditions and future US rate policy
⭐️Personal comments NOVA:
Price continues to move sideways and accumulate around 4000 - 4100. H1 forms a short-term downtrend line.
⭐️SET UP GOLD PRICE:
🔥SELL GOLD zone: 4148 - 4150 SL 4155
TP1: $4140
TP2: $4120
TP3: $4100
🔥BUY GOLD zone: 4024 - 4022 SL 4017
TP1: $4035
TP2: $4050
TP3: $4070
⭐️Technical analysis:
Based on technical indicators EMA 34, EMA89 and support resistance areas to set up a reasonable SELL order.
⭐️NOTE:
Note: Nova wishes traders to manage their capital well
- take the number of lots that match your capital
- Takeprofit equal to 4-6% of capital account
- Stoplose equal to 2-3% of capital account
Gold selling plan!!- Change of Characteristics
- Order Block
- Symmetrical Triangle as an corrective pattern in Short Time Frame
- Fair Value Gap
- Completed " 12345 " Impulsive Waves and " AB " Corrective Waves

DeGRAM | GOLD will rebound from the $4000 level📊 Technical Analysis
● XAU/USD is rebounding from the 3,980–4,000 support zone, aligning with the rising channel support and a confluence of dynamic trendlines.
● A break of the descending structure signals a potential push toward 4,138, followed by 4,175 if momentum sustains above the reclaimed support.
💡 Fundamental Analysis
● Gold is gaining as US yields ease and safe-haven demand picks up amid renewed geopolitical tensions.
✨ Summary
Support: 3,980–4,000. Targets: 4,138 → 4,175. Bias stays bullish while price holds above channel support.
-------------------
Share your opinion in the comments and support the idea with a like. Thanks for your support!

GOLD H1 – Trump’s Fed Comments Shake Market Sentiment🟡 XAUUSD – Intraday Smart Money Plan | by Ryan_TitanTrader (19/11)
📈 Market Context
Gold is trading in a tight corrective structure as markets react to breaking headlines that Donald Trump is considering removing Fed Chair Jerome Powell.
This news injects uncertainty into Fed policy expectations, causing short-term volatility in USD and positioning gold at a critical decision zone.
• Trump’s comments increase speculation about a potential policy shift, which may temporarily weaken USD sentiment.
• However, gold remains capped below the premium supply zone as institutional flows continue to engineer liquidity sweeps.
• Price is hovering near $4,080 ahead of key Fed-related discussions, keeping both sides of liquidity active.
Institutional order flow suggests controlled accumulation at the discount range while premium regions remain defended by sellers.
🔎 Technical Analysis (1H / SMC Structure)
• Structure: Price is forming a short-term distribution pattern after multiple BOS events from the 4150 breakdown.
• Premium Sell Zone: 4109–4111, aligning with unmitigated supply and internal liquidity pockets.
• Discount Buy Zone: 4009–4007, sitting inside a clean demand block + previous sell-side sweep.
• Liquidity:
→ Buy-side liquidity sits above 4111, where equal-high clusters form.
→ Sell-side liquidity rests between 4007–4000, where earlier long positions were cleared.
🔴 Sell Setup (Premium Reaction Zone)
• Entry: 4109 – 4111
• Stop-Loss: 4119
• Take-Profit:
→ 4055 (minor inefficiency)
→ 4028 (BOS retest)
→ 4009–4007 (discount demand)
📌 Execute only after a liquidity sweep into the zone + bearish CHOCH on M5–M15.
🟢 Buy Setup (Discount Reaction Zone)
• Entry: 4009 – 4007
• Stop-Loss: 4000
• Take-Profit:
→ 4040 (short-term range high)
→ 4075 (inefficiency rebound)
→ 4105/4110 (premium retest)
📌 Valid if price sweeps 4007 and shows bullish displacement.
⚠️ Risk Management Notes
• Expect volatility as traders react to Trump’s comments on Fed leadership.
• Avoid trading in the 4030–4080 chop zone without a clear structural break.
• Reduce position size during impulsive spikes around USD sentiment shifts.
• Trail stops once price clears each liquidity pocket.
📝 Summary
Gold is being influenced heavily by uncertainty around Trump’s remarks about replacing Fed Chair Powell. Liquidity is building at both extremes, offering clean opportunities at the edges of the range.
• Sell Zone: 4109–4111 (premium supply)
• Buy Zone: 4009–4007 (discount accumulation)
Expect a manipulation → reaction → continuation pattern as institutions play both sides of the current structure.
📍 Follow @Ryan_TitanTrader for more Smart Money updates.
🎁 Gifts in BIO for traders who follow daily plans.

GOLD H1 – Will Retail Sales Trigger Gold’s Next Big Move?🟡 XAUUSD – Intraday Smart Money Plan | by Ryan_TitanTrader (17/11)
📈 Market Context
Gold is trading inside a corrective phase as markets anticipate today’s U.S. Retail Sales data and several Fed speeches — both crucial for assessing whether inflation momentum is slowing or rebounding.
• Weak retail numbers may hint at cooling consumer strength, supporting safe-haven bids in gold.
• Strong data could revive USD demand, prompting sell-side setups from premium zones.
Institutional flows show engineered pushes into inefficiency before a directional leg unfolds.
🔎 Technical Analysis (1H / SMC Structure)
• Structure: Gold is forming a short-term accumulation at the discount range after consecutive bearish candles and a deep liquidity sweep below 4030.
• FVG Sell Zone: 4140–4138 aligns with an unmitigated FVG + internal liquidity — ideal for sell-side reactions.
• Discount Zone: 4008–4010 is the last clean demand zone + sweep area, matching the chart’s projected bullish inducement.
• Liquidity:
→ Buy-side liquidity rests above 4140.
→ Sell-side liquidity remains exposed near 4000–3995.
🔴 Sell Setup (Premium Reaction Zone)
• Entry: 4,140 – 4,138
• Stop-Loss: 4,150
• Take-Profit Targets:
→ 4,095 (intra-day imbalance fill)
→ 4,060 (previous BOS block)
→ 4,010 (discount accumulation area)
📌 Trade only after a liquidity sweep into FVG + bearish BOS on M5–M15.
🟢 Buy Setup (Discount Reaction Zone)
• Entry: 4,010 – 4,008
• Stop-Loss: 4,000
• Take-Profit Targets:
→ 4,060 (short-term structure high)
→ 4,095 (mid-range inefficiency)
→ 4,138 (final premium reaction zone)
📌 Valid if price sweeps 4008 and shows bullish BOS + displacement.
⚠️ Risk Management Notes
• Expect volatility during the U.S. Retail Sales release.
• Avoid chasing price inside the 4060–4100 chop region.
• Lock profits at each liquidity level and trail stops.
• Keep total risk under 1–2% per setup.
📝 Summary
Gold remains in a engineered pullback phase with clear liquidity pockets at both extremes.
• Sell Zone: 4140–4138 (FVG / premium reaction zone)
• Buy Zone: 4008–4010 (discount accumulation zone)
A clean manipulation–reaction–continuation pattern is likely before the next intraday move.
📍 Follow @Ryan_TitanTrader for more Smart Money updates ⚡
Check out my TradingView profile for special gifts 🎁

DeGRAM | GOLD is preparing to rebound from the $4k level📊 Technical Analysis
● XAU/USD is holding above the 4,040–4,060 support zone, aligning with the rising trendline that has produced multiple higher lows, indicating sustained buyer defense.
● Price is compressing beneath the descending resistance line; a breakout toward 4,138 and then 4,211 becomes likely once structure lifts above 4,097.
💡 Fundamental Analysis
● Gold is supported by cooling U.S. yields and steady safe-haven demand as global risk sentiment remains fragile.
✨ Summary
Support: 4,040–4,060. Targets: 4,138 → 4,211. Bias remains bullish above rising support.
-------------------
Share your opinion in the comments and support the idea with a like. Thanks for your support!

DeGRAM | GOLD will rebound from the $4000 level📊 Technical Analysis
● GOLD/USD is rebounding from the 4,000–4,060 support area, which aligns with the rising trendline that has held multiple times since early November.
● Price is forming a higher-low structure and breaking above short-term compression, opening room toward 4,132 and potentially 4,200 if buyers sustain momentum.
💡 Fundamental Analysis
● Gold is supported by easing Treasury yields and renewed demand as markets price in softer U.S. inflation and increasing geopolitical hedging.
✨ Summary
Support: 4,000–4,060. Targets: 4,132 → 4,200. Medium-term bullish bias above trendline support.
-------------------
Share your opinion in the comments and support the idea with a like. Thanks for your support!

XAUUSD (Gold) Reversal Setup from Demand ZoneXAUUSD is currently in a downtrend and approaching a key demand zone. If price taps the demand area and rejects, a potential bullish correction toward the target level is expected. Watching for pullback entries along the trendline.
Please Support with Valueable feedback i will be glad.

Price is currently in a premium area, where bearish setupsPrice has moved back into the premium zone near the previous high, where bearish setups may form if confirmation appears. The lower discount zone remains the bullish area, where buyers can step in if price retraces. Market is currently reacting around the premium array, waiting for clear direction.

Gold Breakout and Potential RetraceHey Traders, in today's trading session we are monitoring XAUUSD for a buying opportunity around 4,080 zone, Gold was trading in a downtrend and successfully managed to break it out. Currently is in a correction phase in which it is approaching the retrace area at 4,080 support and resistance area.
Trade safe, Joe.

Gold (XAUUSD): Long Trade from Demand ZoneIdentified Trading Setup
The chart illustrates a potential long (buy) trade setup based on a specific strategy, likely related to Smart Money Concepts (SMC) or order flow analysis:
Support/Demand Zone: The entry is planned around the grey box zone, specifically at the CRT-L (Current Range Low) area, implying a belief that this is a strong level for a price reversal.
SSS (Sell-Side Liquidity): The label "SSS" points to a level around $4,030 which was recently broken, suggesting the initial selling pressure has subsided or that liquidity has been swept.
Projected Path: The black line with arrows indicates the expected price path—a significant reversal from the low zone, followed by an uptrend towards the target.
Target (Take Profit): The trade aims for the CRT-H (Current Range High) around $4,092.85. This level represents a strong area of previous supply or resistance that the price is projected to retest.
💡 Conclusion
The analysis suggests a contrarian trade anticipating a bounce off a key support/demand zone for a retracement back toward recent high-level resistance. The blue shaded box represents the potential profit area for this long setup.

Gold Pullback or Breakout? Sitting at the Edge of a Bigger MoveGold Pullback or Breakout? XAUUSD Sitting at the Edge of a Bigger Move
Gold is coiling in a narrowing channel, and this kind of structure usually ends with a sharp directional break. The chart shows buyers trying to defend the mid-zone, while the broader trend still leans corrective. With macro fundamentals shifting fast and volatility picking up around U.S. data, gold is getting primed for a move that won’t stay quiet for long.
Current Bias
Short-term neutral leaning bullish.
Medium-term bullish if buyers defend the lower channel and reclaim the upper trendline.
Key Fundamental Drivers
• US inflation and labour data are softening (per recent BLS and ADP reports), reducing expectations of aggressive Fed tightening. This generally supports gold.
• US yields have eased from recent highs, reducing opportunity cost of holding gold.
• Geopolitical tensions (Middle East, Ukraine, South China Sea) are keeping a haven bid under gold.
• Strong central-bank buying continues to act as a long-term floor for gold prices.
• USD movement remains the dominant short-term driver.
Macro Context
• Interest rate expectations: Markets are pricing a slower Fed path, especially after soft labour prints and cautious speeches from Cook and other Fed officials. A stable-to-mildly-dovish Fed environment supports gold.
• Global growth trends: Europe remains in a slowdown according to Sentix, while Asia shows modest improvement. Weak global growth tends to boost gold.
• Commodity flows: No supply shocks, but ETF outflows are stabilizing—another supportive sign.
• Geopolitics: Israel–Lebanon escalation risk remains in play. Several global risk headlines recently helped gold find intraday support.
Primary Risk to the Trend
A strong USD rally—especially if driven by unexpected U.S. data strength or hawkish Fed comments—would pressure gold back into deeper corrective territory.
Most Critical Upcoming News/Event
• US FOMC speakers (multiple appearances)
• US CPI revisions and PPI data
• US unemployment claims and PMIs
These will decide whether yields move higher again or give gold room to rally.
Leader/Lagger Dynamics
Gold is usually a lagger to:
• USD direction
• US yields
• Fed expectations
But becomes a leader during periods of heavy geopolitical risk, when it pulls safe-haven assets like CHF and JPY with it.
Right now, XAUUSD is following USD and yields more closely than risk sentiment.
Key Levels
Support Levels:
• 4,000 – 3,985 zone (major demand area)
• 3,960 (channel low / liquidity sweep potential)
Resistance Levels:
• 4,115 – 4,135 (mid-range supply)
• 4,245 (major resistance + previous high)
Stop Loss (SL):
• 3,960 (below channel structure)
Take Profit (TP):
• TP1: 4,115
• TP2: 4,245
Summary: Bias and Watchpoints
Gold is building energy inside a narrowing channel, and the next macro catalyst will likely determine the breakout direction. My bias is neutral-to-bullish as long as price holds above the 4,000 zone and avoids a breakdown toward 3,960. The key drivers are weakening U.S. data, softer Fed expectations, and a stable-to-higher geopolitical risk backdrop. The biggest risk is a USD rebound powered by hotter-than-expected U.S. numbers. The most important event ahead is the cluster of U.S. inflation and labour releases, which will directly influence yields and therefore gold. Stops sit cleanly below 3,960, and the natural upside magnet remains 4,115 first, then 4,245 if momentum builds.
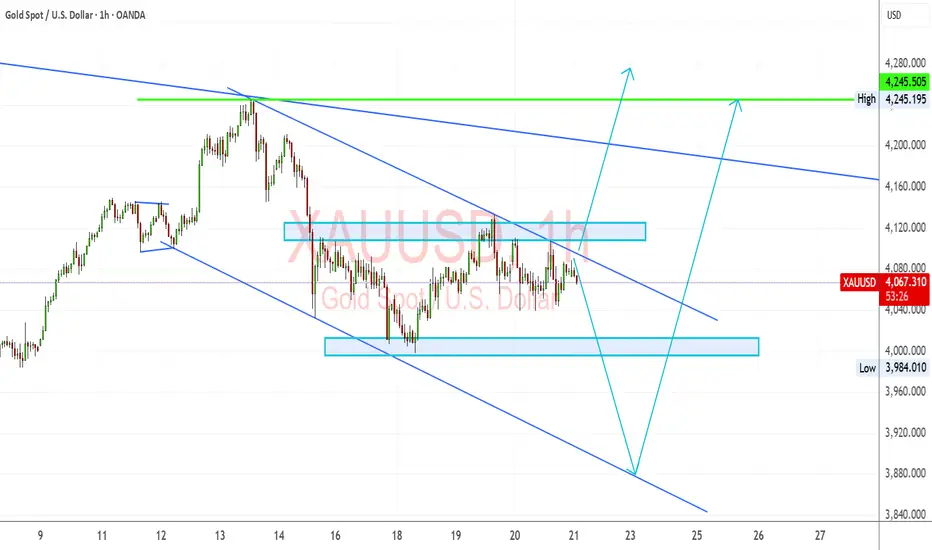
Gold price analysis November 21📌 XAUUSD Trend Analysis – Technical Perspective
The intraday price action is leaning towards a bearish scenario as the 4041 support zone continues to be under pressure. If the H4 chart closes below this zone, a sell signal will be triggered and the next target will be at 3936.
The rising trendline is still playing an important role in the contested zone. However, the price has repeatedly failed to surpass 4100, indicating that buying power is weakening, while increasing the risk of the trendline being broken and the market returning to deeper support zones.
The trading strategy is basically unchanged from yesterday, but it is important to pay special attention to the reaction at the 4041 zone – the area that is deciding the next direction of gold.
📉 SELL
Trigger when: H4 candle closes below 4041
Strategy: SELL on breakout
Target: 3936
📈 BUY
Trigger when: Clear price rejection signal appears at trendline / support zone 4041
Expected target: 4200
Risk: Invalid if candle closes below 4041

(GOLD Bullish Analysis) Idea)PNI UPDATE) CRT LEVEL
Technical Analysis of (XAUUSD – 30M)
Your chart shows a bullish structure forming after a breakout. Here’s the breakdown:
Downtrend Channel Broken
Price was moving inside a descending channel.
A strong bullish candle broke above the channel, signaling a possible trend change.
FVG (Fair Value Gap) + Demand Zone
Price came down to fill the FVG (fair value gap) inside a demand zone.
Buyers defended this area strongly — this confirms bullish interest.
Retest Completed
After breakout, price retested the zone again (the grey box).
This is a bullish continuation signal.
Bullish Impulse Expected
Your blue projection line is correct:
Price is showing signs of continuation toward the upside.
Target Point
Target shown: 4111.178
This aligns with:
Previous liquidity level
Recent swing high
Clean price imbalance above
Structure Summary
Trend: Bullish (after breakout)
Zone: Demand + FVG filled
Bias: Buy-side liquidity target
Expectation: Higher highs toward 4111
---
Conclusion
Your analysis is correct:
Market structure shows bullish continuation after a breakout + retest.
Target area around 4110–4112 makes sense.
Please support it like this idea 💡

XAUUSD: Market Analysis and Strategy for November 18Gold Technical Analysis:
Daily Resistance: 4110, Support: 3930
4-Hour Resistance: 4095, Support: 4000
1-Hour Resistance: 4055, Support: 4000
In the short term, the gold bull market faces the risk of cooling. However, medium- to long-term bulls do not need to panic. Future tariff inflation risks, the trend of central bank gold purchases, and the prolonged geopolitical economic uncertainties, along with the Fed's declining real interest rates, will continue to support gold's core value as a safe-haven asset. The market is at an inflection point; gold bulls need to patiently wait for clearer inflation data or the triggering of new safe-haven events before resuming the upward trend.
The technical picture is largely in line with recent analysis expectations. The continuous decline on the daily chart strengthens the short-term bearish outlook. After the price broke below the Bollinger Middle Band support, the bears are bound to extend the decline. The 4000 level remains crucial in the short term. A decisive break below this level would warrant a short-term sell signal, targeting 3930 or even a drop below 3900 to around 3880. Conversely, if the price rebounds and recovers 4100 in the short term, a buy signal is also warranted, potentially leading to a return to the 4220/4250 area. We need to pay close attention to the possibility of a December rate cut exceeding 60%, as this could trigger a sharp rebound in gold prices.
Looking at the 1-hour chart, after the European session opened, gold's rebound was met with resistance near the middle Bollinger Band at 4043. It is currently in a downward pressure phase. Watch for resistance at the lower edge of the triangle consolidation range mentioned in yesterday's analysis, around 4050/4055.
Trading Strategy:
BUY: 4000~3996
SELL: 4050~4055
More Analysis →
