XAUUSD(GOLD): View Remain The Same Major Swing Sell! Gold dropped to $4030 today, filling up the liquidity gap. However, it reversed nicely. Looking at smaller time frames, we notice heavy selling pressure, which is likely to push the price down towards our target one or two, if fundamentals support the view. Furthermore, we believe the price still has a high chance of going around our top entry around $4380. That area remains a key level if the trend is bearish in the longer term. We advise you to wait for further correction before making any decisions.
Good luck and trade safely!
Team Setupsfx_🏆❤️
Trade ideas

Xau/Usd - Compression Near Support, Breakout ImminentPrice is currently trading around 4057, sitting just above a key support zone highlighted on the chart. This area has been tested multiple times, showing strong buying interest each time price dips into it.
A descending trendline resistance has been respected over several touches, forming a short-term downtrend structure. However, price is now compressing between this trendline and the support zone, suggesting a potential breakout setup.
🔍 What I’m Watching
If buyers continue to defend the support zone, we could see a bullish reversal.
A clean break and retest above the trendline resistance may signal bullish momentum building.
The projected TARGET area aligns with prior reaction levels and the next significant liquidity pocket.
Bullish Scenario
Price bounces from support
Breaks above the descending trendline
Retest confirms the breakout
Targeting the 4100+ area shown on the chart
Bearish Risk
A strong close below the support zone would invalidate the setup
Could lead to further downside pressure

XAUUSD — Deep Narrative Breakdown Through Liquidity & Imbalance🔶 Welcome to “Imbalanced” — A Market Logic Space
This page is focused on clean charting, liquidity behavior and imbalance-based price delivery.
I share structured narratives, premium/discount zones, and disciplined execution models for XAUUSD.
No signals.
No promotions.
Just pure market logic.
If you value clarity over noise, you’ll feel at home here.
The current structure on Gold continues to respect algorithmic delivery, with price moving between well-defined inefficiencies and liquidity pockets.
After the previous displacement, price began building a distribution inside premium, leaving a clear trail of imbalances above and sell-side liquidity resting below.
The chart highlights multiple areas of interest:
• Imbalance & BISI above:
Price has yet to revisit these inefficiencies, suggesting unmitigated zones remain inside premium. These areas represent where the algorithm last delivered impulsively and where future reactions may form once liquidity conditions shift.
• Equal lows (EQL) & Sell-side liquidity:
Beneath the current range sits a cluster of equal lows—textbook liquidity. These resting lows often act as a magnet for engineered pushes, creating clean narrative continuation toward discount levels.
• SIBI in discount:
The lower imbalance zone aligns with a logical draw, given the repetitive taps at the mid-range and the market’s tendency to rebalance inefficiencies left behind during fast moves. This SIBI remains a major reference point for understanding how the next leg might unfold.
Overall, the chart is not about predicting but about reading the story the market is writing:
liquidity creation, imbalance expansion, and the delivery toward areas where inefficiency and resting liquidity coexist.
This is a narrative-driven read, focusing solely on structure, flow, and algorithmic footprints—nothing more, nothing less.
The market leaves the clues; our job is to decode them.
— Imbalanced | Precision in Price Delivery

Test Idea.Just a test. Gold is looking bearish atm. I do believe it will open up with a short move. I Really want 4000-3900 to be triggered before any swing lngs.


Gold Short-Term Rally – Potential to Continue Upside📊 Market Update:
Gold is currently trading around USD 4,078/oz, up from the 4,072 support zone due to short-term buying and weaker USD. Recent US economic news hasn’t been strong enough to halt the short-term uptrend.
📉 Technical Analysis:
• Key resistance: USD 4,085 4.088
• Additional resistance: USD 4.095
• Nearest support: USD 4.072 4.074
• Additional support: USD 4.065
• EMA 09: Price is above EMA 09 → short-term bullish bias continues.
• Candlestick/momentum: Strong bullish candle with high volume → confirms buying pressure dominance.
📌 Outlook:
Gold may continue rising in the next few hours if support at 4,072 4.074 holds. Conversely, if a rejection candle forms at resistance 4,085 4,088 or 4.095, a short-term pullback to 4,065 4,072 is possible.
💡 Short-Term Trading Strategy:
• SELL XAU/USD at: 4,084 4.088
🎯 TP: 40/80/200 pips
❌ SL: 4,092
• BUY XAU/USD: 4.065-4062
🎯 TP: 40/80/200 pips
❌ SL: 4,059

GOLD ANALYSIS What’s Moving the Market Today? November 20, 2025OANDA:XAUUSD GOLD ANALYSIS What’s Moving the Market Today? (November 20, 2025)
Welcome back to Trade with DECRYPTERS, where we turn complex charts into clean, practical buy & sell zones that anyone can understand.
Our goal is simple: react to levels, not emotions.
Follow the zones, follow the structure the market will guide you.
*📰 Market Overview*
Gold slipped after failing to hold above $4,100, drifting back into the mid-range as the Dollar Index (DXY) pushes toward 100.15.
December rate-cut expectations have cooled to around 50%, reducing bullish momentum for metals.
Markets remain fragile with data uncertainty, Fed division, and global tensions all contributing to volatility.
*Key Drivers Behind Today’s Move:*
📈 DXY Strength → A stronger dollar limits upside for gold.
🏦 Fed Minutes Split → Policymakers prefer a “wait & watch” stance, keeping gold range-bound.
📉 Shutdown Data Gaps → Missing CPI/NFP prints create unpredictable volatility bursts.
🌍 Geopolitical Tensions → US–China, Mideast and Ukraine-Russia keep safe-haven flows alive.
🏛 Central Bank Demand → Q3 +220 tonnes; Poland & Kazakhstan leading accumulation.
📊 ETF Flow Behavior → After a record +222t Q3 build, November shows slight outflows but AUM stays near all-time highs — meaning investors are still holding heavy gold exposure.
*📆 What’s Ahead — Key Events to Watch*
🔸 FOMC Meeting – Dec 9–10
Rate cuts remain a coin toss. A surprise hawkish stance could pressure gold quickly, while a dovish tone fuels moves toward upper ranges.
🔸 CPI / NFP Drop After Shutdown Delay
With imputed CPI around ~3.0% core expected, any surprise deviation triggers instant volatility.
Clustered data releases = strong intraday whipsaws.
🔸 Geopolitical Risk Premium
Escalations boost gold instantly.
Calm periods = USD strength and pressure on metal prices.
*🟩 GOLD TECHNICAL LEVELS*
Gold pulled back toward $4,050, but buyers are still active above the $4,000 handle.
The chart currently shows a controlled range with liquidity on both sides — a perfect environment for level-based trading.
*🟩 📌 BUY AREA: 4,005 – 4,028*
Strong accumulation zone where previous demand stepped in.
If price taps into this region, expect sharp rejections and bullish reaction candles.
This zone remains valid as long as gold does not break below $4,000.
Best area for swing & intraday long setups.
*🟥 📌 SELL AREA: 4,107 – 4,121*
This is your first reaction zone previous rejections, wick prints, and liquidity sweeps occurred here.
Expect immediate resistance on first touch.
Ideal short-term scalp sell region unless a clean breakout occurs.
Break above → opens room toward 4,150.
*📝 CONCLUSION*
Gold is playing a tight game between demand at 4,005–4,028 and selling pressure at 4,107–4,121, with EQ hovering near the mid-range.
Holding below EQ favors a deeper pullback into the buy zone, while a clean reclaim above EQ shifts momentum toward 4,148–4,165.
Until CPI/FOMC hits, gold remains range-bound with controlled volatility.
If gold close above 4100 we can see it to 4180
Stay patient.
Follow the levels.
Let the market hit your zones not your emotions.
🙌 Your Support Matters
Please support this analysis with your likes & comments it helps motivate me to share more detailed insights with you.
Feel free to drop your charts & views in the comments. I always reply!
Best Regards,
M. MOIZ KHATTAK | Founder – TRADE WITH DECRYPTERS

Gold risky sellsSupply zone mitigation. Not strong. Targeting lows and demand areas
Risk very little amount on this

DeGRAM | GOLD held the support line📊 TECHNICAL ANALYSIS
● The chart shows Gold (XAU/USD) trading within a rising support line, with multiple bounces (green arrows) near the $4,050–4,100 area and recent test of that trend-line. The upper descending resistance line (red arrows) marks a ceiling near $4,230-4,300 where prior highs were rejected.
● A short-term upward move is expected — price is likely to hold above the rising support trend-line and rebound toward the $4,138 horizontal resistance, with potential push toward $4,200+ if momentum sustains. The failure to hold the trend-line would risk revisiting support near $4,046.
💡 FUNDAMENTAL ANALYSIS
● Gold is benefitting from expectations of a rate cut by the Federal Reserve amidst weak US economic data and a recent government shutdown, which depresses the US dollar and real yields.
● Additionally, geopolitical uncertainty and strong central-bank purchases underpin safe-haven demand for gold, reinforcing the bullish technical outlook.
✨ SUMMARY
● Bias: Long from ~$4,050–4,100 area holding.
● Key trigger: Support hold + rebound toward ~$4,138 then ~$4,200-4,300.
● Risk: Break below ~$4,046 trend-line opens ~$4,000-$3,980.
● Fundamental tailwinds: rate-cut hopes + safe-haven demand = structural support.
-------------------
Share your opinion in the comments and support the idea with a like. Thanks for your support!

Gold next move (gold looks fragile)(24-11-2025)Go through the analysis carefully and do trade accordingly.
Anup 'BIAS for the day (24-11-2025)
Current price- 4075
"if Price stays below 4095, then next target is 4065, 4050 and 4025 and and above that 4100, 4115 ".
-POSSIBILITY-1
Wait (as geopolitical situation are worsening )
-POSSIBILITY-2
Wait (as geopolitical situation are worsening)
Best of luck
Never risk more than 1% of principal to follow any position.
Support us by liking and sharing the post.

Gold is expected to continue its decline next week!
On Friday, gold prices retreated from a three-week high, and a strange phenomenon occurred: the US dollar index and gold fell together. Recent strange occurrences include the end of the US government shutdown triggering a retreat in safe-haven demand, directly weakening some of gold's safe-haven appeal, yet gold continued to rise instead of falling. Then, the decline in the US dollar index, which should have supported gold prices, resulted in both gold and the dollar falling on Friday. While the reopening of the US government provided a short-term boost to market sentiment, the temporary funding agreement failed to resolve the fundamental issues. The bill only extends the federal government's operations until January 30, 2026, with some departments receiving funding until September 30, 2026. The risk of a government shutdown remains for the next few weeks, keeping market sentiment fragile and hindering a sustained recovery in risk appetite. Spot gold faced significant selling pressure. It fell as low as $4032 during the session, closing around $4085, a daily drop of approximately 2.07%, erasing most of the week's gains after retreating from Thursday's three-week high of $4245. Gold prices retreated from a three-week high as momentum waned. The dollar stabilized after Federal Reserve officials signaled caution regarding further monetary easing. Technically, a sustained break below $4,050 could trigger a pullback towards the $4,000 level.
According to the CME FedWatch Tool, the market is currently pricing in a 49% probability of a December rate cut, a significant drop from 94% a month ago. Traders will be watching for speeches from Federal Reserve officials later today, which could further influence interest rate expectations. The U.S. Bureau of Labor Statistics announced a revised timeline Friday afternoon. The agency also stated that a September jobs report will be released on November 21 (next Friday). The Census Bureau said it will release its delayed September construction spending, inventory, and international trade data early next week. The Bureau of Economic Analysis has not yet indicated when it will release its preliminary third-quarter GDP figures. Other government reports showing September retail sales, wholesale prices, and trade data are likely to be released relatively quickly, as statistical agencies had already collected most of this information before the government shutdown and only need to process it. The positive impact of the end of the US government shutdown has diminished some of gold's safe-haven appeal. Meanwhile, a series of cautious comments from Federal Reserve officials prompted traders to lower their expectations for a December rate cut. The cooling prospect of short-term easing has pushed the dollar higher after its recent weakness, putting additional pressure on the non-yielding metal. Traders are currently awaiting delayed US economic data to gain a clearer picture of the Fed's monetary policy outlook. At the same time, renewed concerns about overvaluation in the artificial intelligence sector have weighed on global stock markets and dampened risk appetite, which could limit gold's downside as it moves towards a weekly rally.
Gold Weekly Analysis:
Gold experienced significant volatility this week. It surged in the first half of the week, but then nearly returned to its starting point in the last two days due to news events. Gold tested the 4245 level at the end of the week, and the end of the US government shutdown and hawkish comments from Federal Reserve officials led to a sharp correction, reaching a low of around 4032 before rebounding and consolidating. From a daily chart perspective, gold closed lower this week, with a nearly $180 swing on Friday, indicating significant downward pressure and a easing of bullish sentiment. However, I believe the bulls haven't completely lost control, and this could be seen as a short-term correction driven by fundamental factors. The key support level to watch is around 4000; if this level holds, the market may continue to consolidate. A decisive break below this level would target 3930 and the previous low of 3886. If we consider a 1:1 ratio on the daily chart, the downside target is around 3756. Without significant negative news, I believe the short-term outlook is somewhat challenging. However, if the price retests the support around 3885, bullish sentiment could vanish, and the overall trend will likely shift towards a correction. Therefore, the key levels to watch are 4000 and 3885. Holding these levels would open up further upside potential; otherwise, the bullish momentum may temporarily end.
From a daily chart perspective, yesterday's Asian session saw a strong rally to around 4211 before retreating. Influenced by selling after the shutdown, the US session saw a sharp drop to around 4032, a decline of approximately $180, resulting in a bearish close for the day. Based on the current trend, Monday should be viewed as bearish. Daily resistance is around 4155; if there's a rebound next week, this would be an ideal entry point for shorting. However, the overnight high was around 4111, so any downward movement will likely occur below this level. 1-hour resistance is around 4110; if this level holds on Monday, shorting is a viable strategy. The initial downside target is around 4065-4055, with a further target of 4032-4000 if it breaks below. Consider going long if the 4000 level holds, and if it breaks below, look for opportunities to go short on rallies. In summary, today's short-term trading strategy for gold is primarily to sell on rallies, with buying on dips as a secondary approach. Key resistance levels to watch are 4097-4100, and key support levels are 4030-4000. Traders must follow the trend closely. Manage your position size and stop-loss orders carefully, strictly adhere to stop-loss orders, and never hold losing positions.

THE GOLDEN-PRINT STRATEGY XAUUSD continues to hold firmly above the major support zone around $4000.00. A confirmed break and close above the $4100.00 resistance could signal a potential continuation of bullish momentum.
With the upcoming G20 Summit, market volatility is expected to increase. Depending on the outcomes, this event could either strengthen or weaken the bullish outlook.
In addition, reports suggesting that D. Trump may not attend the summit in South Africa could weigh on USD sentiment. Weakening USD often supports upside moves in gold, which aligns with the bullish scenario if price breaks the $4100.00 zone.
Overall bias:
➡️ Bullish above $4000
➡️ Strong continuation expected above $4100
➡️ Fundamentals currently lean slightly in favor of gold

Long Swing Trade time frame h1, h4, dailyThis analysis identifies potential long entries based clear support and resistance structure.
-The buy zones are historical areas where buyers have previously stopped in, creating demand.
-The trade offers a clear and structured risk to reward ratio.

Long xauusdBuy gold after the market open..and set your Tp under 4200..
.
.
Never forget about risk management and budgeting, and remember that as professional traders, we are here to stay in the market, not to lose and leave..

XAUUSD | Gold Signal | Now 21, 2025 SELL TREND TARGET FOR TODAY 📊
Based on the current trend, structure is strong to bearish. But right now, there’s still a chance for price to make a retracement first.
HAYATE is monitor the structure to see which one is safe whether we BUY first or continue SELL trend.
HAYATE target for this setup we should be able to collect around 100–150 pips++.
♾️Gold sell now @ 4046 - 4050
💰TP1 - 4043
💰TP2 - 4039
🚨SL - 4053

I'm going to continue shorting gold! Are you ready?This week's gold price movement largely aligned with my trading strategy. I shorted gold at the opening on Monday, targeting a low of $4,000. After breaking below $4,000, the price rebounded, recovering its losses on the back of the initial jobless claims data and rising back above $4,100. It then encountered resistance near $4,130 and fell back. This price action was consistent with my view that shorting gold in the $4,125-$4,135 range was very effective, as the market subsequently fell by tens of dollars.
Due to the decline in gold prices and the shift in the center of gravity, the entry price also needs to be lowered. I plan to short gold in batches in the $4095-$4115 range. The technical outlook is currently dominated by a bearish trend, making this area relatively safe.
The above are my personal thoughts! If this is helpful to you or if you share the same ideas, please like and follow to show your support! All strategies have a limited lifespan. While referring to them, it's also important to closely monitor market changes. I will also respond flexibly based on actual market fluctuations!

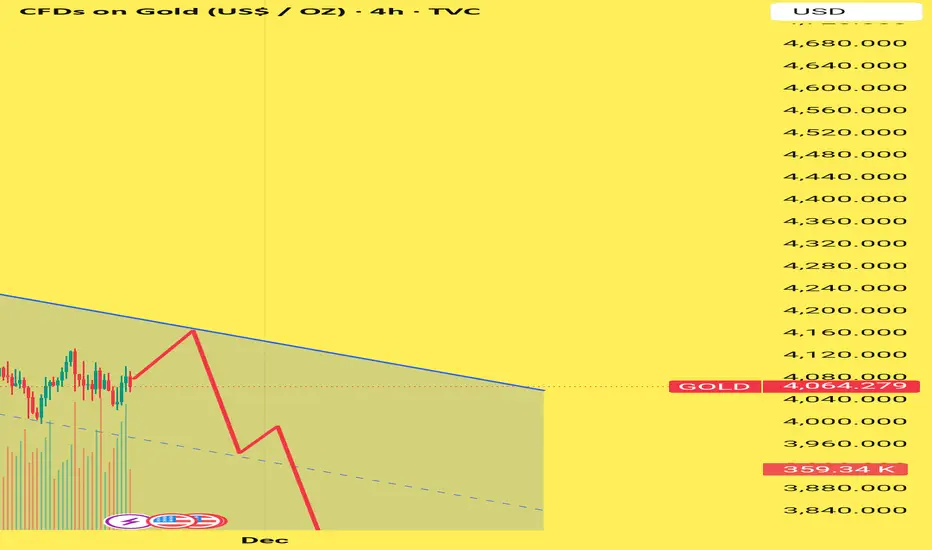
GOLD 4H – Descending Channel Outlook | Key Reaction Zones AheadHello Traders
Gold on the 4H timeframe continues to respect a clear descending channel, with price moving steadily between the upper resistance trendline and the lower support boundary.
At the moment, price is trading near the mid-range of the channel, showing limited bullish momentum but still respecting the broader downtrend structure.
Key Highlights:
🔹 Upper Channel Resistance:
Price is approaching a major trendline where sellers have consistently reacted throughout October and November. A rejection from this zone keeps the bearish structure intact.
🔹 Mid-Channel Reaction:
The dashed median line continues to act as a dynamic pivot. Current price movement suggests temporary consolidation before a larger directional move.
🔹 Bearish Scenario (Most aligned with structure):
If price rejects the upper trendline again, a move toward the lower channel support remains possible. This level has historically provided strong reactions.
🔹 Lower Channel Support:
A drop toward this zone would complete the next leg inside the channel, maintaining the overall descending pattern.
Market Structure Insight:
The overall flow remains bearish as long as Gold trades inside this channel. The chart illustrates potential movement but does not represent any financial advice—simply an analysis of market structure based on visible trend behavior.
Gold BUY SETUPHi All,
Green Pips To All,
Hope everyone is doing good.
Small educational analysis from my end for gold.
Enter Now to BUY or BUY & Target, Stop Loss on the chart
Have a great day ahead.

Gold Market Observation ZonePrice is approacing an important area on my chart.I am watching this zone for potential market reaction based on past behavior.Thisis only my personal analysisfor educational purposes.

Gold 🔵Entry
🔴SL
🟢TP
*`ANALYSIS`*
1. Strong support level respected several times
2. 30 min candle closed below support, meaning support is broken
3. Didn't sell cause the SL would have been big & the candle was breaking the previous candles low in first 2minutes without making a liquidity wick first.
*`Entry`*
When price broke the low of previous exhaustion candles wick with stops above the previous 15min candle high.
*`Set-up`* Impulse Entries
*`Session`* Pre-London
*`Trade Result`*
+0.8%💰
+24pips🎯

Symm Triangle IdeaGold is currently consolidating inside a symmetrical triangle, showing balanced pressure from both buyers and sellers. Price is squeezing toward the apex, indicating a potential volatility breakout soon. A breakout above the upper trendline may signal bullish continuation toward recent highs, while a breakdown below support could open the door for deeper correction. Traders should wait for a clear candle close outside the triangle for confirmation.

short sell finding its way to the market... patience paysxauusd is running a short buy manipulation but the real jackpot comes on a short sell

XAUUSD buy Taking an instant execution on Gold and placing my stoploss at the last swing low
Targeting a 1:10 Let’s see how it plays
