XAUUSD – Clean 1H Demand + 4H Support Reaction
Bias
Bullish short-term after price tapped a strong 1H demand zone that aligns perfectly with 4H support.
Why I Took This Setup
Price returned to a fresh 1H demand zone
Same level is a 4H support, giving stronger confluence
Liquidity was taken below the zone before the rejection
Strong bullish reaction + momentum shift on lower timeframes
Trade Plan
Entry: Inside the refined 1H demand zone
SL: Below the zone
TP: Next major swing high
Reasoning
Market grabbed liquidity, tapped a clean zone, and showed immediate strength. Structure is now pushing upward with clear bullish intention.
Trade ideas

XAUUSD BUY ON D TFLooks like we had already hit a fib level, and we're in a Bullish flag thoughts on this mark up for the Day time frame? I see GOLD staying bullish till the end of the year still.

XAU about to go downXAUUSD is currently developing a valid high-quality harmonic confluence.
This potential reversal zone is further reinforced by multiple structural elements:
Overhead supply zone
A prior bearish order block
Liquidity resting above B, adding inducement
All confluences point to a high-probability bearish reaction if price reaches the D-completion zone.

Gold Analysis and Trading Strategies | Monday✅ Technical Outlook (4-Hour Structure)
● After reaching the historical high of 4381, gold entered a corrective phase, forming a segmented structure of “decline → bottoming → rebound.”
Each segment has lasted for roughly one week.
Currently, after touching 4245, gold has entered the second corrective wave, and from a cycle perspective, this adjustment is not fully completed yet.
● Over the past two days, gold has repeatedly found support around the 4000 psychological level, showing signs of rebound. This indicates that buyers are actively defending this area and that short-term bullish interest remains.
● Short-term moving averages (MA5, MA10, MA20) are currently clustered around the 4080–4100 region, forming strong pressure and signaling that the short-term trend remains bearish.
However, the long-term moving averages are slowly turning upward, suggesting that downside support remains valid and that deeper declines may be limited.
● The Bollinger Bands continue to narrow, indicating a range-bound and repetitive price structure.
The lower band is gradually aligning with previous lows, which together limit the downside space for further price declines.
✅ Daily Chart Structure
● Gold remains in a consolidation phase, with the overall Bollinger Bands displaying a gradual narrowing pattern, suggesting that a one-directional move is unlikely in the near term.
● The lower band is steadily rising and aligning with prior lows → limiting further downside risk.
● The upper band remains near 4100–4130, serving as the main short-term resistance zone for rebounds.
🔴 Resistance Levels: 4100–4130
🟢 Support Levels: 4005–4000
🎯 Trading Strategy Reference
🔰 Strategy 1 (Sell on Rebound)
● Short around 4100–4105 in batches
Targets: 4050–4020
Breakdown target: 4000
🔰 Strategy 2 (Buy on Pullback)
● Buy around 4000–4005 in batches
Targets: 4020–4030
Breakout target: 4050
📌 Outlook for Next Week
Overall, gold remains in a structure of weak consolidation — supported but with limited rebound strength.
The price is expected to continue oscillating within the 4000–4100 USD range next week.
● If Federal Reserve officials sound more “hawkish”:
Rate-cut expectations decline → USD strengthens → Gold may retest the 4000 support.
● If Fed officials turn more “dovish”:
Rate-cut expectations rise → Gold may retest the 4100 resistance zone.
● If geopolitical tensions escalate:
Safe-haven demand may push gold to break above the upper boundary of the range.
Next Monday’s short-term focus remains the 4000–4100 range.
Wait for a breakout, then follow the direction accordingly.
Watch for support and entry point for long positions: 4020.Negative news has been priced in; be wary of consumer data.
In the short term, from now until the next three months, gold is an overcrowded trade. Any information next week will be a risk for gold; only renewed hopes for an interest rate cut can boost prices. The meeting is scheduled for December 9-10, during which one or two additional data points may be released. Nevertheless, if expectations for a rate cut do not increase, gold prices are likely to remain stagnant.
The market expects investment demand to remain stagnant until the Fed clearly outlines its path. We need to be cautious whether a longer pause could catalyze a larger outflow of funds from the precious metals market.
After two rounds of pullbacks and sharp rises on Friday, gold prices consolidated slightly around 4065 at the close. Currently, there's no clear distinction between upward and downward momentum, and the market is likely to remain range-bound. A clear direction is unlikely in the first half of next week, and we'll have to wait for data releases before making new trades. One key level to watch next week is the area around 4030, which is the potential entry point for our entry strategy on the second day of next week.
On the hourly chart, gold is currently holding above 4020. If a pullback doesn't break this level next week, we can wait for a pullback to enter long positions. Similarly, if there's an initial rise, we'll still look at the resistance at 4100. Without a clear trend, we can focus on range trading for now. Market conditions are volatile, so please follow our real-time trading strategies.
Short-term trading strategy:
Buy around 4025-4030, stop loss below 4020, take profit at the 4080-4100 resistance level.

Bearish BiasI would say this week seems to be Abit shitty. But never the less we can always strangle the xauusd by buy and sell together and wait for the right zone. Just to play the big player out.

Gold's price movement is unclear. Focus on today's NY market NFThe gold market is in a tug-of-war between bulls and bears, with focus on today's US NFP employment data.
Gold rebounded after hitting a low on Tuesday, with bulls launching a counterattack at the 4000 level. The upward trend continued on Wednesday, but it wasn't very strong; instead, it was a step-like, oscillating rise, indicating that the market remains in a wide-range consolidation phase. It needs time to build a new upward trend. Currently, bulls and bears are still locked in a tug-of-war, and short-term intraday traders should pay attention to the shifts in the bullish and bearish rhythms.
After opening higher in the Asian session today, gold then encountered resistance around 4110 and fell, reaching a low of 4040 before rebounding. This precisely tested the 4040 support level from Tuesday's pullback. Since the 4040 support is currently effective, we should continue to monitor the strength of the rebound, using 4040 as a stop-loss level. We should watch whether it can break above 4110. If it fails to do so, it presents a shorting opportunity. If it breaks above, it could reach 4130. However, a break below 4040 could trigger a short-term accelerated decline.
Key Levels:
First Support: 4040, Second Support: 4030, Third Support: 4000
First Resistance: 4085, Second Resistance: 4110, Third Resistance: 4130
Gold Intraday Trading Strategy:
Buy: 4045-4050, Stop Loss: 4040, Take Profit: 4070-4080;
Sell: 4095-4100, Stop Loss: 4110, Take Profit: 4080-4070;
More Analysis →

Gold signal BuyIf Market come 4080 and gives rejection on 15 minute timeframe take buy entry and stoploss on downside of candle low

Gold Analysis – Demand to Supply Zone Strategy (1H timeframe) FOREXCOM:XAUUSD
Description
In the 1-hour timeframe, the last candle has shown a clear reaction to the demand zone. This suggests that gold is currently suitable for buying until it reaches the supply zone.
Once a confirmation candle forms in the supply zone, it will provide a strong signal for selling opportunities.
Key Points
• Timeframe: 1H
• Current Bias: Buy from demand zone → Target supply zone
• Next Step: Wait for confirmation candle in supply zone → Sell setup
Conclusion
Gold is currently in a buy phase toward the supply zone. After confirmation in the supply area, a potential reversal and sell opportunity may emerge.
#Gold #XAUUSD #TechnicalAnalysis #SupplyDemand #Tradingidea

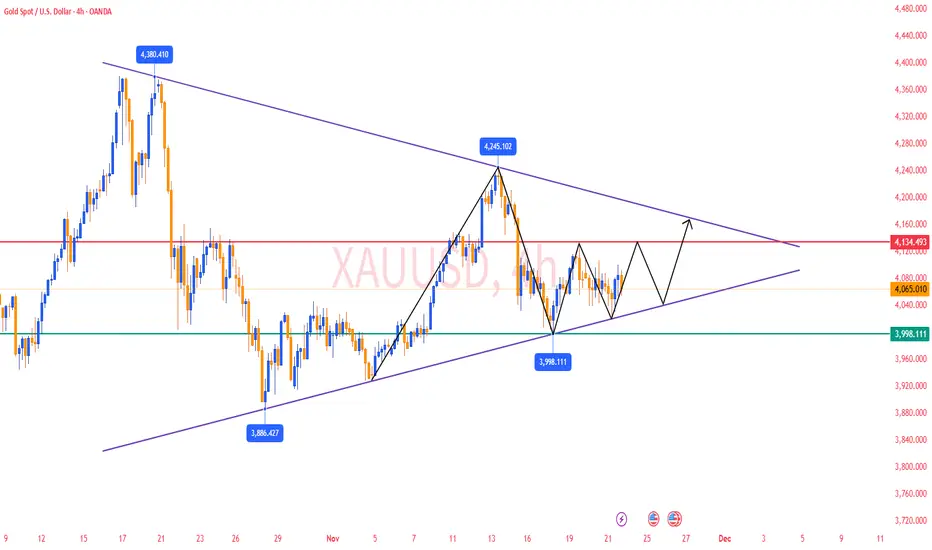
DeGRAM | GOLD held the support line📊 TECHNICAL ANALYSIS
● The chart shows Gold (XAU/USD) trading within a rising support line, with multiple bounces (green arrows) near the $4,050–4,100 area and recent test of that trend-line. The upper descending resistance line (red arrows) marks a ceiling near $4,230-4,300 where prior highs were rejected.
● A short-term upward move is expected — price is likely to hold above the rising support trend-line and rebound toward the $4,138 horizontal resistance, with potential push toward $4,200+ if momentum sustains. The failure to hold the trend-line would risk revisiting support near $4,046.
💡 FUNDAMENTAL ANALYSIS
● Gold is benefitting from expectations of a rate cut by the Federal Reserve amidst weak US economic data and a recent government shutdown, which depresses the US dollar and real yields.
● Additionally, geopolitical uncertainty and strong central-bank purchases underpin safe-haven demand for gold, reinforcing the bullish technical outlook.
✨ SUMMARY
● Bias: Long from ~$4,050–4,100 area holding.
● Key trigger: Support hold + rebound toward ~$4,138 then ~$4,200-4,300.
● Risk: Break below ~$4,046 trend-line opens ~$4,000-$3,980.
● Fundamental tailwinds: rate-cut hopes + safe-haven demand = structural support.
-------------------
Share your opinion in the comments and support the idea with a like. Thanks for your support!

XAUUSD(GOLD): View Remain The Same Major Swing Sell! Gold dropped to $4030 today, filling up the liquidity gap. However, it reversed nicely. Looking at smaller time frames, we notice heavy selling pressure, which is likely to push the price down towards our target one or two, if fundamentals support the view. Furthermore, we believe the price still has a high chance of going around our top entry around $4380. That area remains a key level if the trend is bearish in the longer term. We advise you to wait for further correction before making any decisions.
Good luck and trade safely!
Team Setupsfx_🏆❤️

Gold Still in Distribution, FOCUS ON SELL Setups at 4,10x–4,14x 🔍 Market Context
Risk sentiment remains fragile as investors reassess the global rate and stimulus story.
Goldman Sachs notes that rising worries about the size of Japan’s fiscal stimulus are bringing financial risk premia back, putting pressure on long-term JGBs and the JPY. Capital tends to rotate into USD and yield-bearing assets in this environment, which limits the upside for gold in the short term.
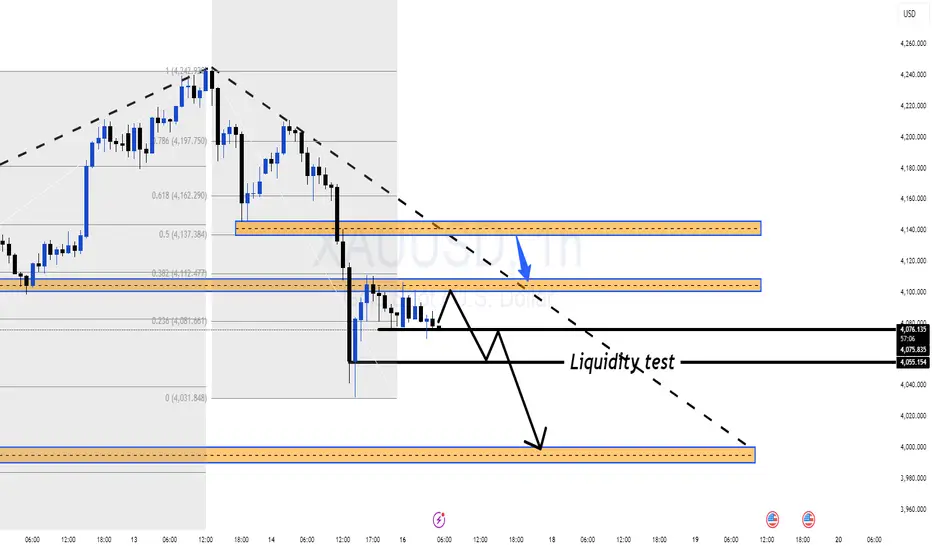
📊 XAU/USD Technical Structure (H1)
After topping around 4,242 USD, gold broke its short-term uptrend and is now moving in a descending structure.
Price is currently capped below the 0.5–0.382 Fibonacci area around 4,11x, which overlaps with a strong supply / Sell Liquidity zone on the chart.
Below price, we have a series of liquidity / support pockets:
4,098 – 4,077 – 4,048 USD: short-term downside liquidity levels.
OBS BUY ZONE around 4,00x: major demand zone where price previously launched a strong rally.
Current price action shows sellers still in control – every bounce into 4,10x–4,14x is being rejected quickly, which fits a “sell the rally” approach.
🎯 Trend-Following Trade Ideas (for reference)
Zones below are technical areas to watch, not signals or financial advice.
Scenario 1 – Shallow Pullback Sell
Sell Zone 1: 4,102 – 4,104
SL: 4,110
TP levels:
TP1: 4,098
TP2: 4,077
TP3: 4,048
Idea: Price makes a minor intraday pullback into local supply, then resumes selling pressure toward lower liquidity pockets.
Scenario 2 – Deeper Pullback into Fib/Trendline Confluence
Sell Zone 2: 4,142 – 4,144
(confluence of descending trendline + Fibonacci combo)
SL: 4,150
TP levels:
TP1: 4,133
TP2: 4,105
TP3: 4,088
TP4: 4,060
Idea: If the market grabs more upside liquidity first, the 4,14x zone offers a better R:R area to align with the H1 downtrend.
⚜️ MMFLOW TRADING View
As long as price stays below 4,14x and H1 structure keeps printing lower highs, gold remains in a distribution phase.
Pullbacks into the 4,10x–4,14x liquidity band are treated as opportunities to optimize SELL entries, while the 4,00x OBS BUY ZONE is the key area to reassess any potential larger bottoming process.
“In a downtrend, our job isn’t to call the bottom – it’s to use every weak bounce to sell from a better position.”
Gold is expected to continue its decline next week!
On Friday, gold prices retreated from a three-week high, and a strange phenomenon occurred: the US dollar index and gold fell together. Recent strange occurrences include the end of the US government shutdown triggering a retreat in safe-haven demand, directly weakening some of gold's safe-haven appeal, yet gold continued to rise instead of falling. Then, the decline in the US dollar index, which should have supported gold prices, resulted in both gold and the dollar falling on Friday. While the reopening of the US government provided a short-term boost to market sentiment, the temporary funding agreement failed to resolve the fundamental issues. The bill only extends the federal government's operations until January 30, 2026, with some departments receiving funding until September 30, 2026. The risk of a government shutdown remains for the next few weeks, keeping market sentiment fragile and hindering a sustained recovery in risk appetite. Spot gold faced significant selling pressure. It fell as low as $4032 during the session, closing around $4085, a daily drop of approximately 2.07%, erasing most of the week's gains after retreating from Thursday's three-week high of $4245. Gold prices retreated from a three-week high as momentum waned. The dollar stabilized after Federal Reserve officials signaled caution regarding further monetary easing. Technically, a sustained break below $4,050 could trigger a pullback towards the $4,000 level.
According to the CME FedWatch Tool, the market is currently pricing in a 49% probability of a December rate cut, a significant drop from 94% a month ago. Traders will be watching for speeches from Federal Reserve officials later today, which could further influence interest rate expectations. The U.S. Bureau of Labor Statistics announced a revised timeline Friday afternoon. The agency also stated that a September jobs report will be released on November 21 (next Friday). The Census Bureau said it will release its delayed September construction spending, inventory, and international trade data early next week. The Bureau of Economic Analysis has not yet indicated when it will release its preliminary third-quarter GDP figures. Other government reports showing September retail sales, wholesale prices, and trade data are likely to be released relatively quickly, as statistical agencies had already collected most of this information before the government shutdown and only need to process it. The positive impact of the end of the US government shutdown has diminished some of gold's safe-haven appeal. Meanwhile, a series of cautious comments from Federal Reserve officials prompted traders to lower their expectations for a December rate cut. The cooling prospect of short-term easing has pushed the dollar higher after its recent weakness, putting additional pressure on the non-yielding metal. Traders are currently awaiting delayed US economic data to gain a clearer picture of the Fed's monetary policy outlook. At the same time, renewed concerns about overvaluation in the artificial intelligence sector have weighed on global stock markets and dampened risk appetite, which could limit gold's downside as it moves towards a weekly rally.
Gold Weekly Analysis:
Gold experienced significant volatility this week. It surged in the first half of the week, but then nearly returned to its starting point in the last two days due to news events. Gold tested the 4245 level at the end of the week, and the end of the US government shutdown and hawkish comments from Federal Reserve officials led to a sharp correction, reaching a low of around 4032 before rebounding and consolidating. From a daily chart perspective, gold closed lower this week, with a nearly $180 swing on Friday, indicating significant downward pressure and a easing of bullish sentiment. However, I believe the bulls haven't completely lost control, and this could be seen as a short-term correction driven by fundamental factors. The key support level to watch is around 4000; if this level holds, the market may continue to consolidate. A decisive break below this level would target 3930 and the previous low of 3886. If we consider a 1:1 ratio on the daily chart, the downside target is around 3756. Without significant negative news, I believe the short-term outlook is somewhat challenging. However, if the price retests the support around 3885, bullish sentiment could vanish, and the overall trend will likely shift towards a correction. Therefore, the key levels to watch are 4000 and 3885. Holding these levels would open up further upside potential; otherwise, the bullish momentum may temporarily end.
From a daily chart perspective, yesterday's Asian session saw a strong rally to around 4211 before retreating. Influenced by selling after the shutdown, the US session saw a sharp drop to around 4032, a decline of approximately $180, resulting in a bearish close for the day. Based on the current trend, Monday should be viewed as bearish. Daily resistance is around 4155; if there's a rebound next week, this would be an ideal entry point for shorting. However, the overnight high was around 4111, so any downward movement will likely occur below this level. 1-hour resistance is around 4110; if this level holds on Monday, shorting is a viable strategy. The initial downside target is around 4065-4055, with a further target of 4032-4000 if it breaks below. Consider going long if the 4000 level holds, and if it breaks below, look for opportunities to go short on rallies. In summary, today's short-term trading strategy for gold is primarily to sell on rallies, with buying on dips as a secondary approach. Key resistance levels to watch are 4097-4100, and key support levels are 4030-4000. Traders must follow the trend closely. Manage your position size and stop-loss orders carefully, strictly adhere to stop-loss orders, and never hold losing positions.

Gold next move (gold looks fragile)(24-11-2025)Go through the analysis carefully and do trade accordingly.
Anup 'BIAS for the day (24-11-2025)
Current price- 4075
"if Price stays below 4095, then next target is 4065, 4050 and 4025 and and above that 4100, 4115 ".
-POSSIBILITY-1
Wait (as geopolitical situation are worsening )
-POSSIBILITY-2
Wait (as geopolitical situation are worsening)
Best of luck
Never risk more than 1% of principal to follow any position.
Support us by liking and sharing the post.

Gold maintains a bullish market structure overallGold maintains a bullish market structure overall; however, price action suggests it has entered a corrective phase within the current trading range. There is a possibility that price could move lower to test nearby support levels before determining its next direction.
On Friday, gold declined by approximately 3% amid a broad market sell-off triggered by hawkish comments from a U.S. Federal Reserve official, which reduced expectations of a potential interest rate cut in December.
If bulls successfully defend key support and a strong rejection or bullish reversal pattern forms, gold could resume its upward momentum. Should this scenario play out, price may rally and target the 4115 – 4160 zone.
You may find more details in the chart,
Trade wisely best of Luck Buddies.
Ps; Support with like and comments for better analysis Thanks for Support.

Gold Consolidation resuming the bullish trend.Gold is trading inside an ascending channel and currently rebounding from the lower boundary.
Price has recently broken above a minor resistance and is showing bullish momentum.
Gold prices rose on Wednesday as renewed geopolitical tensions increased risk aversion, lifting demand for safe-haven assets. Investors are also awaiting the minutes from the Federal Reserve’s latest policy meeting and the delayed U.S. jobs report for further clues on the central bank’s interest-rate trajectory.
From a technical perspective, gold remains bullish, continuing its push to the upside. Yesterday, price recovered strongly and moved up to test resistance. Investors are now watching for a bullish breakout—if price breaks above the 4100 level, a sharp rebound toward 4122–4152 is likely.
For now, focus remains on the current trading range. There is still a possibility that price may pull back to retest support before resuming the bullish trend.
You may find more details in the chart.
Trade wisely best of Luck Buddies.
Ps; Support with like and comment for better analysis Thanks for Supporting.

Lingrid | GOLD Potential Channel Retest. Long From SupportOANDA:XAUUSD is climbing back above the broken range structure and retested the 4,150 zone while maintaining bullish pressure from the recent breakout. The chart shows price riding along the upward trendline and forming a higher-low structure beneath the descending trendline. A clean hold above 4,150 keeps the path open for continuation toward channel border at 4,285 as long as buyers defend the retest. Overall, momentum leans bullish with a projected extension into the resistance zone.
⚠️ Risks:
A H4 close back below 4,150 would weaken the bullish continuation setup.
Strong USD data this week could trigger a deeper corrective pullback.
A rejection from the descending red trendline may stall upside momentum and force consolidation.
If this idea resonates with you or you have your own opinion, traders, hit the comments. I’m excited to read your thoughts!

Gold next move (NFP TRADE PLAN)(20-11-2025)Go through the analysis carefully, and do trade accordingly.
Anup 'BIAS for the day (20-11-2025)
Current price- 4080
1st scenario (high probability)
4020-4030 area for buying for target 4050,4100,4150,4250
1st scenario (moderate probability)
4120-25 area for selling for target 4100,4090,4080,4050.
Best of luck
Never risk more than 1% of principal to follow any position.
Support us by liking and sharing the post.

XAUUSD Repricing MoveXAUUSD Repricing Move
Gold continues to trade inside a broader corrective cycle, with price action showing a clear transition from prior strength into a short-term distribution phase. The chart highlights repeated breaks in market structure and shifts in order flow, signalling a controlled decline built on institutional rebalancing.
After the recent downside sweep, price is now hovering around a key reaction zone where liquidity has already been absorbed. Sellers dominated the previous swing, but the latest candles show a slowdown in bearish momentum, indicating that the market may be preparing for a corrective repricing attempt.
The volume footprint on the left side of the chart reflects previous heavy activity from major participants, and the current area sits beneath an inefficiency pocket that remains unmitigated. This opens the door for a short-term bullish rotation if buyers defend this accumulation region. The marked arrow in your chart aligns with a potential internal shift where gold could attempt a short retracement toward the mid-range of the prior move.
Momentum indicators embedded in the structure show reduced volatility, meaning the market may be positioning itself for a liquidity-driven bounce rather than continuing straight lower. The next sessions will reveal whether this zone becomes a launch point for a recovery leg or if the broader trend resumes its downward trajectory.

gold end weekHi.
boring week we had.
but :
It's the time to reach Daily Moving average 45.
if we dont see it today, I promise you we will have gold over 4500.
Stay safe

Gold.Gold.
RARE and IMPORTANT breakout about to occur.
5 more trading before it gets CONFIRMED.
Have a great weekend!

GOLD $GC Levels and Patterns AnalysisTraders and Investors,
Gold (XAUUSD) has been consolidating mostly but still has been giving a lot of great short term and swing trade opportunities.
I have updated the important levels and zones which can act as support and resistance. They should guide us a bit for the best possible trade opportunities.
There as possible W pattern forming. It has not formed or completed yet. It must first break the trend line and confirm the break. BTW, that trend line can also give us a good opportunities around it. Next, the price has to break the mid point of potential W pattern. Once it has done that, it can complete the W pattern.
Trade what you see, wait for the confirmations and manage the risk as always.
Follow for more. Please support this analysis by liking, commenting, and sharing with friends, colleagues, traders, and trading communities. Thanks👍🙂

Gold weekly chart with buy and sell levelsNo big update this week heading away for a few days.
As always wait for levels these levels will come into play all week
