October 1st. Best Trading Day of the Year?NOTE: This is a post on Mindset and emotion. It is NOT a Trade idea or strategy designed to make you money. If anything, I’m posting this to help you preserve your capital, energy and will so you can execute your own trading system with calm, patience and confidence.
I was told yesterday that Octo
About SPDR S&P 500 ETF Trust
SPY Fund Summary
The investment seeks to provide investment results that, before expenses, generally correspond to the price and yield performance of the S&P 500 Index. The Trust seeks to achieve its investment objective by holding a portfolio of the common stocks that are included in the Index), with the weight of each stock in the Portfolio substantially corresponding to the weight of such stock in the Index.
The investment seeks to provide investment results that, before expenses, generally correspond to the price and yield performance of the S&P 500 Index. The Trust seeks to achieve its investment objective by holding a portfolio of the common stocks that are included in the Index), with the weight of each stock in the Portfolio substantially corresponding to the weight of such stock in the Index.
Related funds
SpyNext week marks end of the quarter and the week after is a black out week with no earnings. Any pullback or major correction has that 2week window. Once new earning season kicks off you usually don't see a significant correction before tech earnings.
Here's the indexes and where we stand
Most i

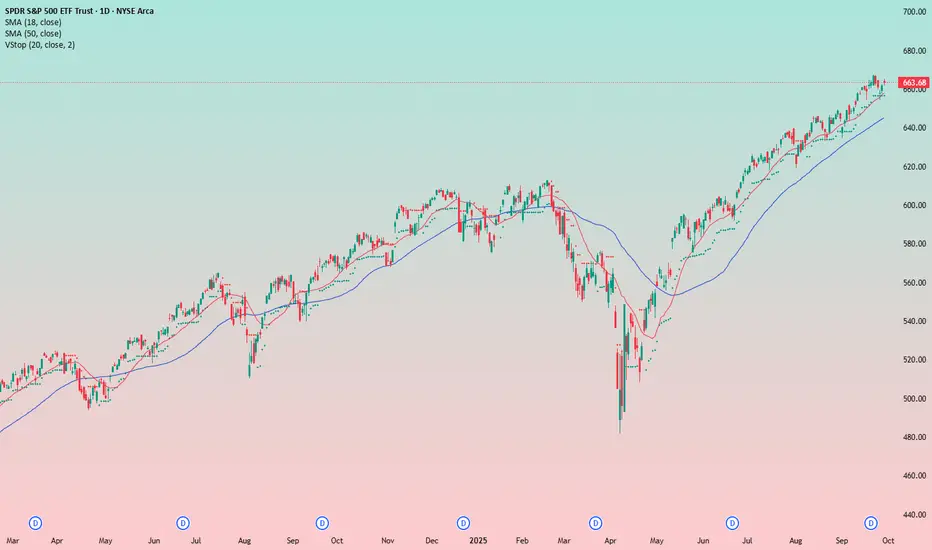
SPY WEEKLY 26 SEP 2025 This is the price action analysis for SPY . I have clearly discussed the levels and have touched on psychology side as well. If you have any doubts, feel free to leave a message.
NOTE: DONT TRADE AS OPTIONS AS MARKET IS ALL TIME HIGH

SPY: Month of October Month of October update 🎃
Hey everyone!
Here are my thoughts on the month of October and the annual close that is fast approaching.
Hope you find this helpful, as always leave a comment or questions if you have any!
Thank you and safe trades!

Waiting for the Stock Market to FallI’m expecting a decline in the stock market. Long positions are relevant only in the commodity sector — no stock longs!
At the moment, I’m not entering any positions. I’m watching the market, monitoring major players (who, by the way, are closing their positions and moving into cash), and keeping
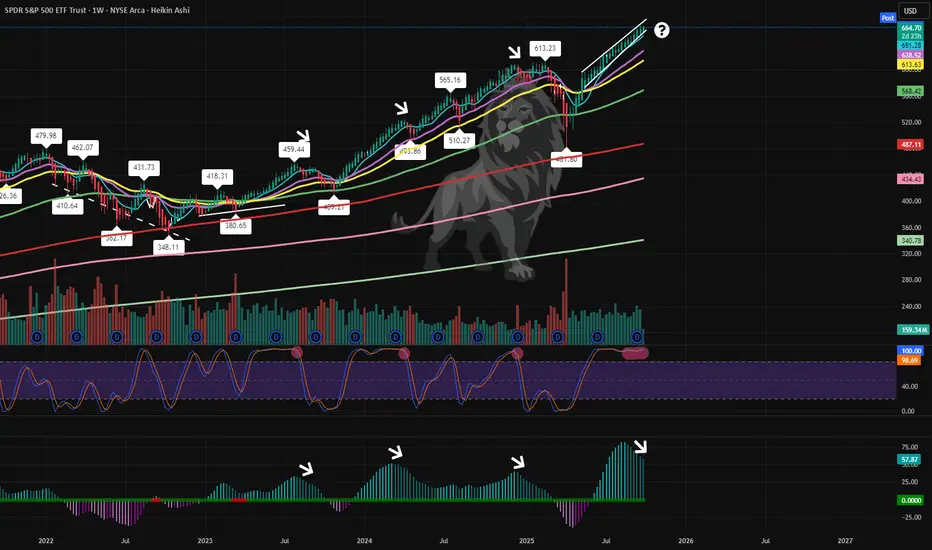
SPY weekly divergenceCheck out the chart on SPY weekly. As you can see, TTM has started to show that volatility has started to come out of the move (light cyan to dark (lower indicator)) all while SPY has continued to push higher. All times before this has signaled local weakness and a subsequent pullback ahead.
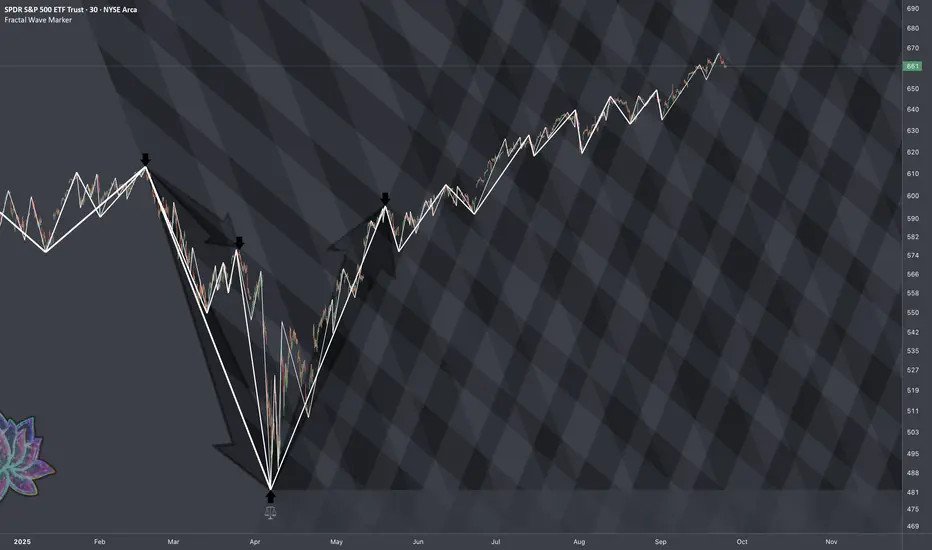
$SPY: Systematic Behavior 3 Frames of Reference:
An angle from the top (beginning of decline) to a point of resistance where the price got further dumped to form a bottom. This emphasizes some boundary that needs to be broken in order to proceed to transition phase.
Also would be nice to have the angle of entire tariff
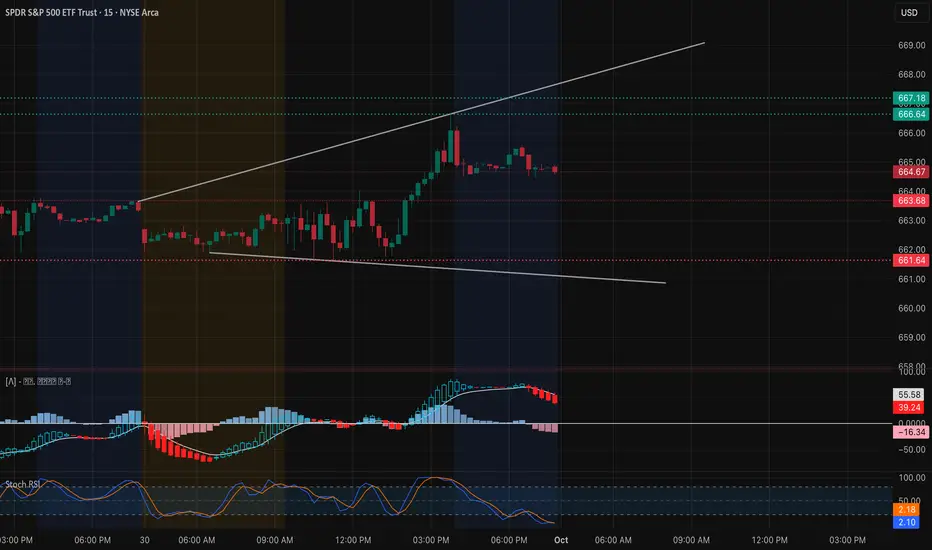
SPY at a Critical Level! Key Trade Setups for Oct. 1 Market Structure (15m & 1h)
SPY closed around 664.6, holding inside an ascending channel. Price made a strong push into the 666–667 zone before cooling off. On the 15m chart, MACD is rolling down and Stoch RSI is oversold, suggesting near-term weakness, but the 1h structure is still bullish as long
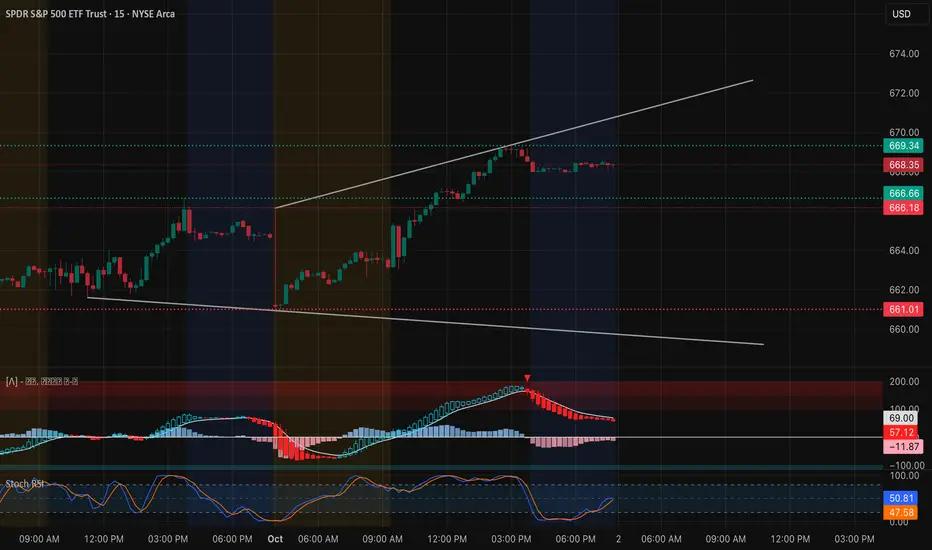
SPY Stalling at $669 – Gamma Ceiling in Play (Oct 2) Intraday (15-Min Chart)
SPY ripped higher into the 668–669 zone, testing the upper channel before momentum started cooling. On the 15-min chart, MACD has rolled over into red, while Stoch RSI is mid-range after pulling back from overbought.
* Immediate resistance: $669.3 intraday high.
* Support zon
Are We About To See A HUGE Change In The Market...Stock Market Forecast | QQQ SPY CME_MINI:NQ1! CME_MINI:ES1! SP:SPX NASDAQ:NDX
Mag 7 | TSLA NVDA AAPL AMZN META MSFT GOOGL

See all ideas
Displays a symbol's price movements over previous years to identify recurring trends.
Frequently Asked Questions
An exchange-traded fund (ETF) is a collection of assets (stocks, bonds, commodities, etc.) that track an underlying index and can be bought on an exchange like individual stocks.
Since ETFs work like an individual stock, they can be bought and sold on exchanges (e.g. NASDAQ, NYSE, EURONEXT). As it happens with stocks, you need to select a brokerage to access trading. Explore our list of available brokers to find the one to help execute your strategies. Don't forget to do your research before getting to trading. Explore ETFs metrics in our ETF screener to find a reliable opportunity.
No, SPY doesn't pay dividends to its holders.