$SPY / $SPX Scenarios — Tuesday, Sept 30, 2025🔮 AMEX:SPY / SP:SPX Scenarios — Tuesday, Sept 30, 2025 🔮
🌍 Market-Moving Headlines
📉 Q3 closeout: Last trading day of September = quarter-end rebalancing flows in equities and bonds.
💵 Fed watch: Multiple Fed speakers across the day keep policy tone in focus.
💻 Mega-cap drift: NASDAQ:AAPL , NASDAQ:MSFT , NASDAQ:NVDA leadership remains sensitive to yields + growth data.
📊 Key Data & Events (ET)
⏰ 🚩 9:00 AM — S&P Case-Shiller Home Price Index (Jul, 20-city)
⏰ 🚩 10:00 AM — JOLTS Job Openings (Aug)
⏰ 🚩 10:00 AM — Consumer Confidence (Sep, Conf. Board)
⏰ 9:45 AM — Chicago PMI (Sep)
🗣️ Fed Speakers:
• 6:00 AM — Philip Jefferson (Fed Vice Chair)
• 9:00 AM — Susan Collins (Boston Fed)
• 1:30 PM — Austan Goolsbee (Chicago Fed)
• 3:30 PM — Austan Goolsbee (Chicago Fed, TV appearance)
⚠️ Disclaimer: Educational/informational only — not financial advice.
📌 #trading #stockmarket #SPY #SPX #Fed #Powell #JOLTS #ConsumerConfidence #CaseShiller #PMI #Dollar #bonds #megacaps
SPY trade ideas
SPY and VIX - what I'm watching forA break below yesterday's low is a likely sell on SPY. VIX also in heavy consolodation but has not broken out yet.

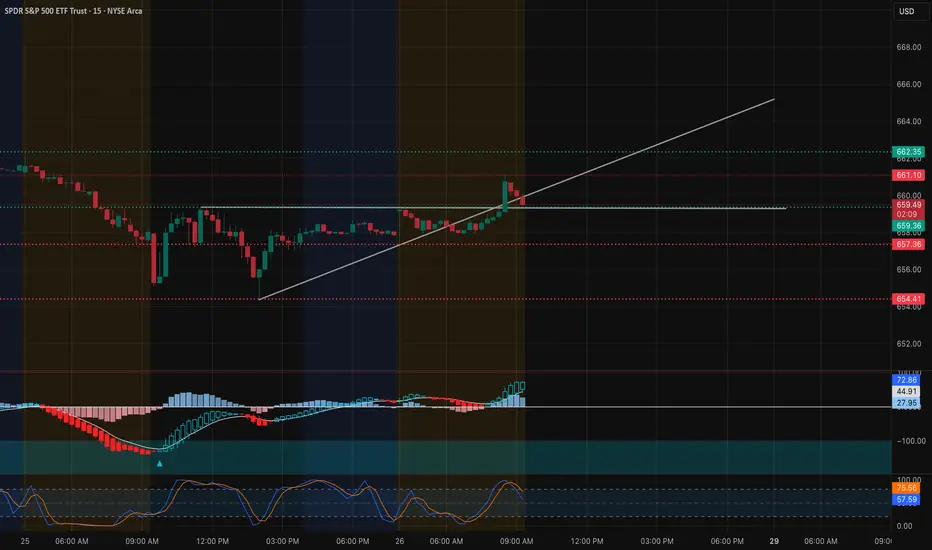
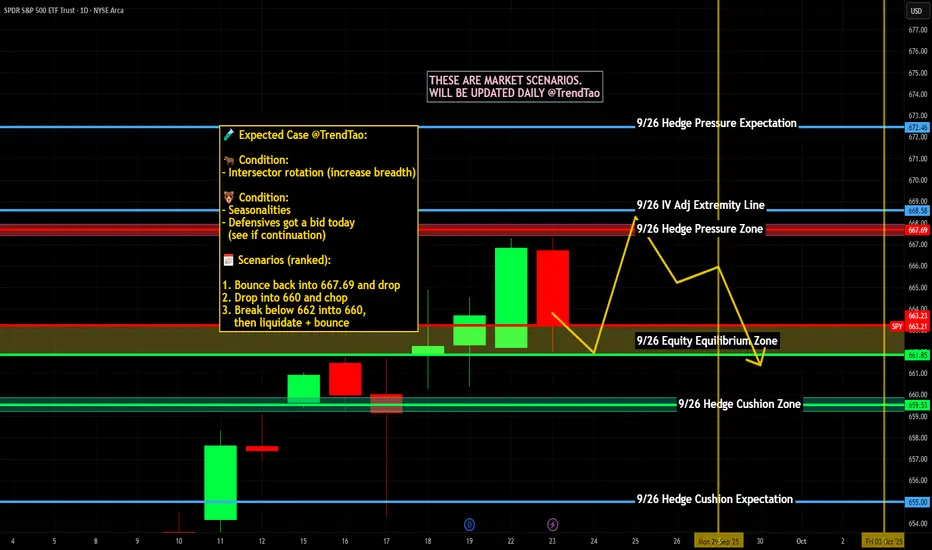
SPY Technical Analysis – Sep 26 Morning SetupSPY is opening the session with early upward pressure but still sitting in a bigger, mixed range. Here’s a structured read based on the two 15-minute charts you shared.
1. Price Action & Market Structure
* Trend bias: Pre-market push lifted price from ~657 to 662.3, breaking the overnight range and creating a small bullish structure break (CHoCH).
* Immediate reaction: After tagging ~662.3 the candle pulled back toward 659–660, so the move is being tested rather than cleanly extending.
* Key intraday pivot: 659.5–660 zone now acts as first key support. Holding here keeps the morning bullish idea alive; losing it invites a retest of the lower demand pocket at 656.5–657.
2. Supply & Demand / Order Flow
* Demand: 657–656.5 (HVL base and yesterday’s lower support).
* Supply: 661–662.3 (today’s pre-market high and first call resistance). Above that, next notable supply is near 664–665 where bigger call walls cluster.
3. Indicator Check
* 9 EMA / 21 EMA: Price is still above both, showing near-term momentum, but the recent red candle is testing the 9 EMA.
* MACD: Positive histogram and lines still crossed bullish, supporting continuation if support holds.
* Stochastic: Entering overbought territory; a short-term pause or retest is normal.
4. Options & GEX Context
* Call Walls / GEX:
* 1st call resistance: 661 (56% concentration)
* 2nd: 664 (36%)
* 3rd: 665 (49%)
* Put Walls / Support:
* 1st put wall: 656.5 (highest negative NET GEX)
* 2nd: 654 (stronger downside magnet if 656.5 breaks)
* Put/Call ratio: Puts ~62% vs Calls ~38%, still tilted bearish on a larger frame.
Interpretation: Near-term intraday gamma pressure favors a chop between ~657 and ~662 until one side gives way. A decisive 15-minute close over 662.3 could squeeze to 664-665.
5. Trading Scenarios
Bullish Path
* Entry idea: Bounce from 659.5–660 with volume reclaim.
* Targets: 662.3 then 664–665.
* Stop: Below 657.
Bearish Path
* Entry idea: Clean 15-min close under 659 with selling volume.
* Targets: 656.5 first, then 654.
* Stop: Above 661.
Scalpers can watch 1-minute retests at these pivots for confirmation.
6. Quick Take
SPY is trying to build a morning reversal off the 657 base, but gamma positioning and overnight resistance at 662.3 keep the upside capped until proven otherwise. Early risk-reward favors patience: wait for either a strong 15-minute close above 662.3 for a push toward 664-665, or a failure below 659 to ride a fade toward 656.5/654.
SPY SEP 25,2025 READ NOTESSpy can still hit $676 but as a trader my job is to understand the risk then put Stop loss & then trade.
So, I am long with stocks only:
SL @$653 with a target of $676.
The level is pretty average & most of the traders who learnt price action from me won't even call this a level. If you don't understand a level, then don't trade it(simple).
I initiated the long trade when I posted the chart in the morning.
If it hits my SL then il accept and move on. I am waiting for this week to close &will publish the video analysis tomorrow after market close.
NOTE: DO NOT TRADE OPTIONS

SPY CORRECTION SOON?Technical Outlook:
- Head and Shoulders (forming)
- Overbought RSI (above 70)
- Signaling Bearish Divergence
Fundamental Outlook:
Economic weakness looms as rising inflation meets sluggish growth, fueling stagflation fears. With markets on edge, a spooky September sell-off could be triggered by tightening conditions and fading investor confidence.

SPY Pre-Market Trade Plan (Bearish Bias) 9/25Been receiving lots of positive feedback on pre-market trade plans so here is another one for 9/25. Trade Idea with a bearish central thesis. Invalidates if we break and close above to purple box (stop).

SPY touching the Upper ChannelSPY touching the Upper Channel. Let's see if retracts down to touch the lower channel

SPY: Week, Month, Year and Calculus Hey everyone,
Coming in with an idea to outline my thoughts into next week, where we are in relation to current monthly levels and a bit of discussion on some history in the making.
Hope you find it informative and as always let me know your questions below! I always appreciate comments!
Take care and save trades!

WHERE IS THE STOCK MARKET PULL BACK? (September 20, 2025)S&P 500 has been on an absolute tear these past five months but we know things can't go straight up forever so in this video we talk about the possibility of where the stock market can pull back and how much longer can we keep pushing?

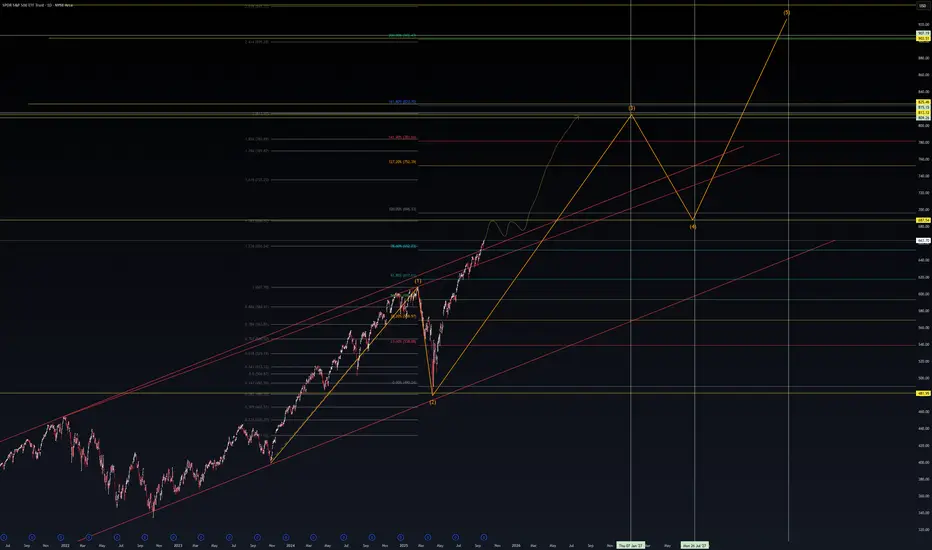
SPY Long-Term Elliott Wave Roadmap📊 SPY Long-Term Elliott Wave Roadmap
SPY continues to respect its long-term bullish channel with clear Elliott Wave structure.
Currently finishing Wave (3) with upside momentum into the 800+ zone.
Expecting a corrective Wave (4) dip toward 680–700.
The final Wave (5) extension projects into the 900+ zone, aligning with major Fibonacci levels.
This roadmap suggests:
✅ Structural bias remains bullish
⚠️ Volatility spikes likely during Wave (4) retracement
⏳ Timeline projects into 2026–2027 for cycle completion
Markets don’t move in straight lines—this is about the macro roadmap.
What’s your take—does SPY see 900+ before the next secular reset?
#SPY #SP500 #ElliottWave #TradingView #Markets
SPY Sep 23 – Bulls Pushing Toward 668–670, Gamma Still in PlayPrice Action & Setup (1-Hour Chart)
SPY has been grinding higher after last week’s consolidation, now trading around 666.7 and pressing the upper end of the short-term channel. Immediate supports line up at 665 and 662, with deeper backup near 657. As long as SPY holds above 665, the structure favors another push to the 668–670 zone.
Momentum Read
MACD remains strongly positive with rising histogram, showing momentum is still alive. Stoch RSI is elevated (near 90), which could lead to short pauses or small pullbacks, but no reversal signals yet.
GEX (Options Flow) Confluence
Gamma exposure is bullish:
* Highest positive GEX / Call resistance: ~668–669
* 2nd Call Wall: near 667
* Next Call Wall: around 670
* Major Put Support: 661 with a secondary wall near 655
Holding above 665 forces dealers to hedge higher, which can keep the squeeze alive toward 668–670.
Trading Plan
* Upside continuation: Enter long on a confirmed hourly close above 667.2. Target 668–670. Stop just below 665.
* Dip buy: A pullback to 665 or 662 that holds on volume can be a low-risk reload.
* Quick short: Only if 661 breaks with heavy volume, aiming for 657 and 655.
Option Angle
Short-dated calls in the 668–670 strike range remain attractive if SPY stays over 665. Protective puts near 661 can work if breakdown signals appear.
Bottom Line
Bulls hold the upper hand as long as SPY stays above 665. A clean push over 667 could quickly extend to 668–670, with gamma hedging likely to assist.
Disclaimer: This is for educational discussion only and not financial advice. Always do your own research and manage risk.

Solving Trading with Math: The Ultimate Pure Math StrategyThis video will be part 1 of using math to solve trading problems.
About this video
This video focuses on day trading using Algebra to determine your target price from opening breakout range.
In the next tutorial, I can show you how to apply this strategy to swing trading.
Overall Purpose
The overall purpose is to show you the actual, real life application of pure mathmatical principles in real life, especially as it pertains to trading.
If you were one of those people who said "I'll never use this math in real life applications", consider yourself corrected :P.
Thanks everyone, hopefully you enjoy and find this helpful!
Safe trades as always.

$SPY / $SPX Scenarios — Wednesday, Sept 24, 2025🔮 AMEX:SPY / SP:SPX Scenarios — Wednesday, Sept 24, 2025 🔮
🌍 Market-Moving Headlines
📉 Month-end positioning: Flows light as traders prep for Thursday’s 🚩 GDP + Jobless Claims.
💻 Mega-cap drift: Tech leadership remains central with $AAPL/ NASDAQ:NVDA volatility post-Powell.
💵 Rates + housing: Home affordability narrative continues to weigh on broader risk tone.
📊 Key Data & Events (ET)
⏰ 🚩 10:00 AM — New Home Sales (Aug)
⏰ 4:10 PM — San Francisco Fed President Mary Daly speech
⚠️ Disclaimer: Educational/informational only — not financial advice.
📌 #trading #stockmarket #SPY #SPX #Fed #housing #Powell #economy #Dollar #bonds #megacaps
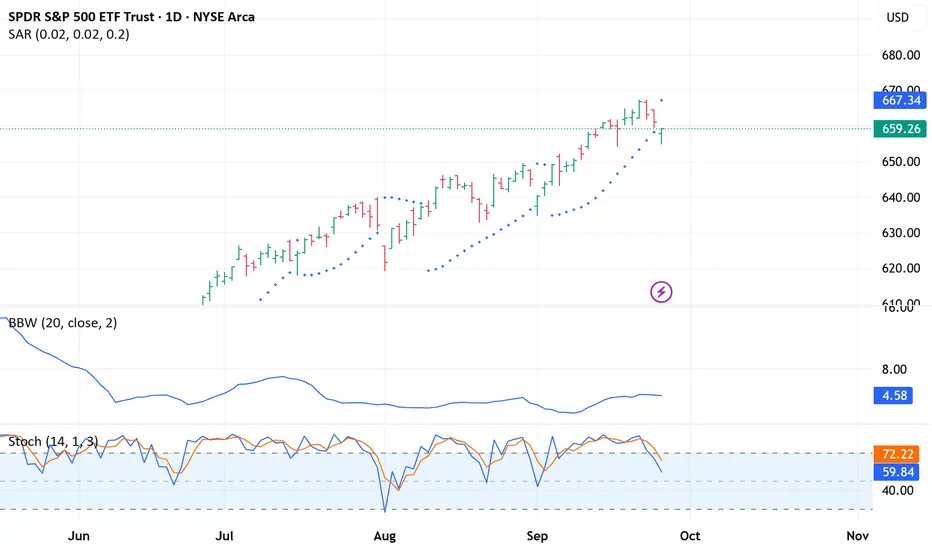
SPY - The Sell Signal that is ALWAYS a BuyOnce again, the Parabolic indicator triggers sell. Probably the most useless indicator on the planet for the S&P. ANy little dip is quickly bought up. Why is now any different?
$SPY / $SPX Scenarios — Thursday, Sept 25, 2025🔮 AMEX:SPY / SP:SPX Scenarios — Thursday, Sept 25, 2025 🔮
🌍 Market-Moving Headlines
📉 Data-heavy morning: Multiple macro releases hit at 8:30 AM, setting tone across bonds, USD, and equities.
💬 Fed chorus: Packed lineup of Fed speakers keeps policy narrative in focus.
💻 Tech + rates tension: AMEX:XLK flows remain sensitive to bond yield direction post-FOMC.
🛢️ Energy lens: Oil volatility continues to act as an inflation wildcard.
📊 Key Data & Events (ET)
⏰ 🚩 8:30 AM — Initial Jobless Claims (weekly)
⏰ 🚩 8:30 AM — GDP (Q2, third estimate)
⏰ 🚩 8:30 AM — Durable Goods Orders (Aug)
⏰ 10:00 AM — Existing Home Sales (Aug)
🗣️ Fed Speakers:
• 8:20 AM — Austan Goolsbee (Chicago Fed)
• 9:00 AM — John Williams (NY Fed) & Jeff Schmid (Kansas City Fed)
• 10:00 AM — Michelle Bowman (Fed Vice Chair for Supervision)
• 1:00 PM — Michael Barr (Fed Gov.)
• 1:40 PM — Lorie Logan (Dallas Fed)
• 3:30 PM — Mary Daly (San Francisco Fed)
⚠️ Disclaimer: Educational/informational only — not financial advice.
📌 #trading #stockmarket #SPY #SPX #GDP #joblessclaims #durablegoods #housing #Fed #Powell #Dollar #bonds #megacaps
SPY Trapped Between 670 Resistance & 662 Support📖 Crown Point Research
1. Date & Time
📌 Date: 24th September 2025
📌 Time: 08:45 PM IST
2. Fundamental News
“US Treasury yields eased slightly, but Fed officials kept policy guidance hawkish. Headlines are mixed: tech optimism vs inflation caution. Market moves remain primarily technical.”
3. Public Sentiment & Human Behavior
• Retail: Chasing intraday bounces expecting a reversal.
• Institutions: Distributed supply at resistance, rotated flows cautiously.
• Social Signal: Headlines read “soft landing confidence,” but structure shows fragile micro pullbacks.
4. Current Structure
Macro :
• Resistance: 668–670
• Support: 655–652
• Stage: Macro Maturity → candles show fragile tops
Micro :
• Resistance: 665–667
• Support: 661.5–662
• Behaviour: Controlled pullback underway.
5. Projection (Paths)
Primary Path (65%):
Retest 665–667, then continuation lower toward 661.5–662.0.
Alternate Path (25%):
Hold above 665 → extension into 670
Low Path (10%):
Breakout beyond 670 → only possible with strong global positive catalyst (policy/economic shock).
Overrides:
Bullish Override : If positive news , Breakout extends beyond 670 toward 675
Bearish Override (3/3 pillars align): If negative news, Collapse accelerates toward 657–655 directly, bypassing pullback supports.
6. Pullback Levels
• Shallow: 664.5–665.0
• Medium: 667.0 barrier
• Deep: 670–671
7. Final View
Bias: Bearish until 667 is reclaimed with conviction.
• Path remains toward 662 with extension possible to 655 if bearish override triggers.
8. Essence (Philosophy Line)
“Until barriers flip with institutional strength, downside paths remain dominant.”
9. Disclaimer
⚠️ “This analysis is shared for educational and research purposes only. It is not financial advice, trading advice, or investment recommendation. Market decisions are entirely your own responsibility.”

Let's keep an eye out. Who else is seeing the same thing.
I am a bit worried at how people think this is a great 👍🏾 market. People buying in now wanting to catch some of these gains, its too late. The Fear&Greed Index reading around 63% more Greed 🐷🐖, how?
Some people might be left holding the 🎒 in 2026.
1. Let's pray
2. Take some profits, let the rest ride
3. Look forward a pullback & dollar cost
4. If you got it, hedge/look for shorts
Hope you all had a green 💚 year, give God his glory and give our 10% to charity.
Take care.

Next Leg down startingThe S&P 500 has been trading inside this rising channel for the last 3 and a half years. As you can see it has bounced off the bottom of the rising channel 4 different times and it is now back at the top of the channel. Price action gapped above the channel overnight but immediately sold off pre-market back inside the channel and completely reversed the move despite strong earnings from MSFT and META. This is very bearish and signals a move back down to the bottom of the channel once again and given that its already bounced off the bottom of the channel 4 different times, a 5th hit would have a high probability of breaking below the channel, which I would give a greater than 70% probability of playing out. If this happens, we will see much lower prices in this coming bear market.

SPY Sep 22 TA – “Grinding Higher or Ready for a Breather?”
1️⃣ Big Picture on the 1-Hour Chart
* Price action: SPY closed near 663.40, still tracking inside an upward channel. Buyers continue to defend the midline, keeping the short-term uptrend alive.
* Key levels:
* Resistance: 665.1 → 667.5 (recent high and strong call wall)
* Support: 659.5 → 657 (mid-channel & HVL from options data)
* Indicators:
* MACD is positive but flattening, signaling fading momentum.
* Stoch RSI is elevated near 85, which may point to a near-term pause or light pullback.
Overall trend stays bullish but a little extended; a sideways consolidation wouldn’t surprise.
2️⃣ GEX / Options Flow
* Strong call walls at 665–667.5 and a key gamma shelf around 659.5.
* Below, 655 and 650 show heavy put walls, with a large gamma pocket that could accelerate a dip if 657 breaks.
* IVR stands at 13.3, suggesting option premiums remain moderate and potentially attractive for quick strategies.
This options picture supports the idea of SPY chopping between 657 and 665 early in the week unless a fresh catalyst pushes it through 667.
3️⃣ Trading Thoughts & Suggestions
* Scalp / day trade: A clean break above 665–667.5 with strong volume could target 670 and beyond. Tight stop under 663.
* Support bounce: If early weakness brings price toward 659.5–657 and it holds, watch for a rebound back to 663+.
* Fade setup: A hard rejection at 665–667.5 may open a move back toward 657.
4️⃣ Bottom Line
SPY remains in a healthy uptrend, but momentum is slowing. Bulls want to see a sustained move over 667 to keep the rally alive, while bears look for a break below 657 to shift control.
Disclaimer: This is just market opinion for educational discussion. It’s not financial advice. Always manage your own risk before trading.

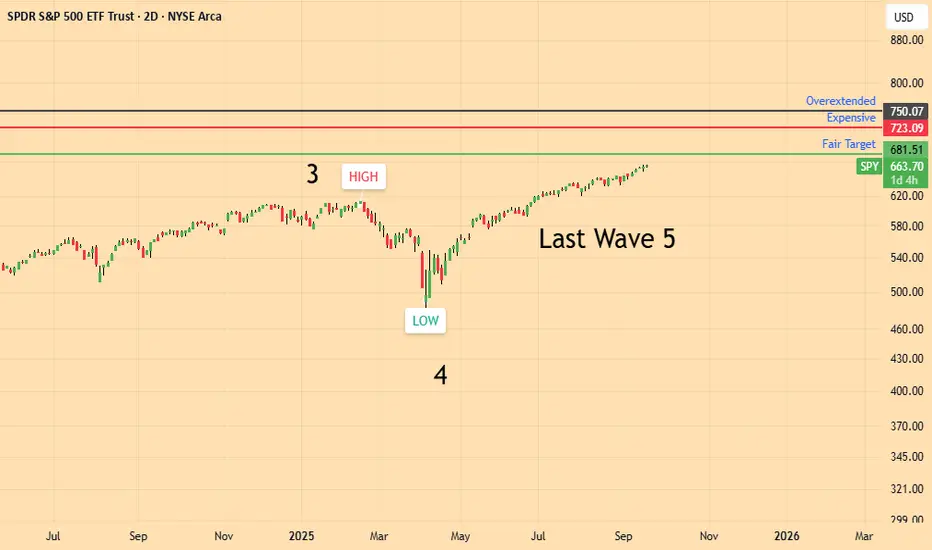
SPY still bullish but this is the last moveGiven the High in Feb25 at 619.22 ; the Low in Apr25 at 481.8, we have the following Fibon* extension targets
Target 0.382 = 681.51 Fair
Target 0.618 = 723.09 Expensive
Target 0.764 = 750.07 Overextended
In case SPY reaches 750.07 and declines afterwoods the correction can reach :
Target 0.618 = 570.55 Oversold
Target 0.382 = 633.38 Fair
In case SPY reaches 723.09 and declines afterwoods the correction can reach :
Target 0.618 = 562.63 Oversold
Target 0.382 = 619.20 Fair
SPY is likely to reach 681.51 in this Wave which we label Elliott Wave 5
Given the fair targets of the upcoming corrections at 633.38 or 619.20 it makes little sense to buy, unless one seeks to catch the latest upward move
It is not possible to predict how long this wave with last and how much time it will take to reverse
*calculated with the natural logarithms of datas
SPY: Bearish Continuation & Short Trade
SPY
- Classic bearish setup
- Our team expects bearish continuation
SUGGESTED TRADE:
Swing Trade
Short SPY
Entry Point - 663.63
Stop Loss - 664.95
Take Profit - 661.51
Our Risk - 1%
Start protection of your profits from lower levels
Disclosure: I am part of Trade Nation's Influencer program and receive a monthly fee for using their TradingView charts in my analysis.
❤️ Please, support our work with like & comment! ❤️

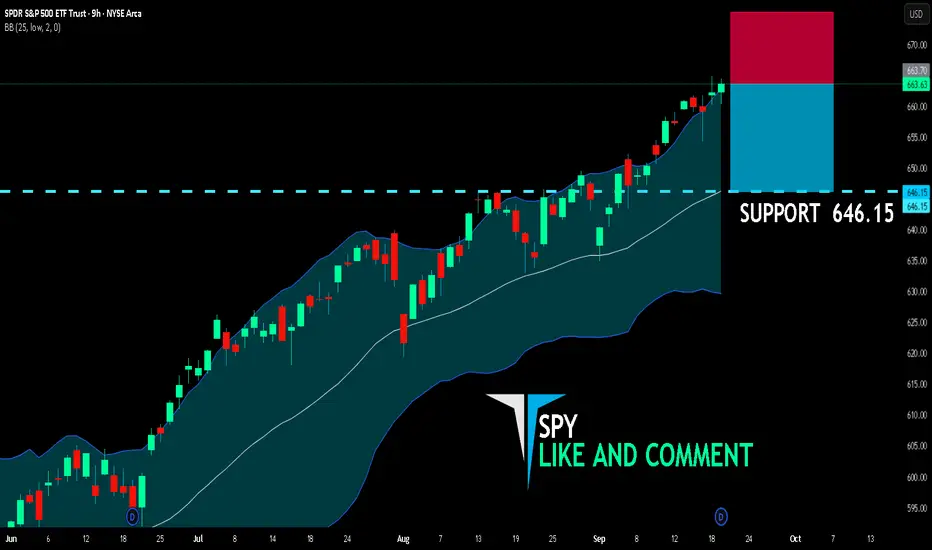
SPY SHORT FROM RESISTANCE
SPY SIGNAL
Trade Direction: short
Entry Level: 663.70
Target Level: 646.15
Stop Loss: 675.36
RISK PROFILE
Risk level: medium
Suggested risk: 1%
Timeframe: 9h
Disclosure: I am part of Trade Nation's Influencer program and receive a monthly fee for using their TradingView charts in my analysis.
✅LIKE AND COMMENT MY IDEAS✅
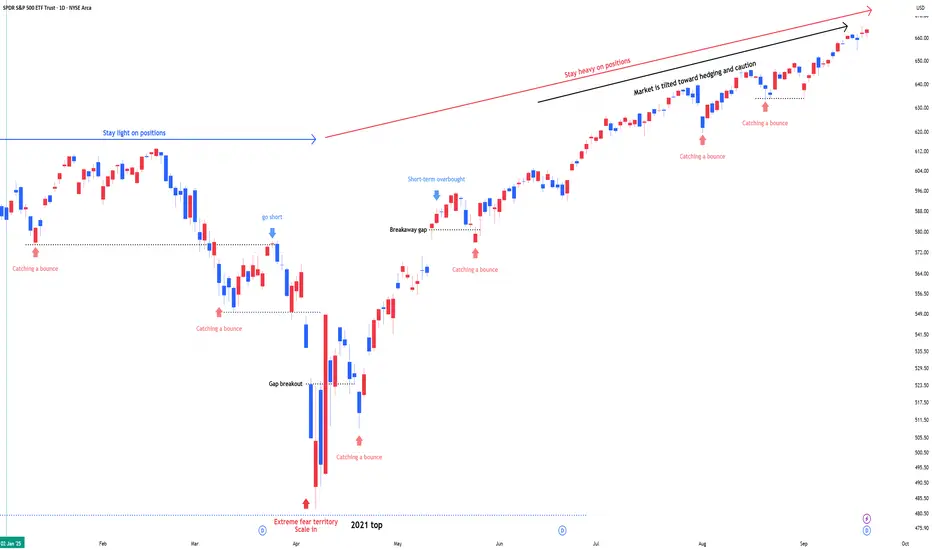
SPY : Stay heavy on positions (2x leverage)- System metrics show the market transitioning into the initial phase of overheating.
In stay light on positions zones, I hold SPY(+QQQ) and reduce exposure.
In stay heavy on positions zones, I increase allocation using a mix of SSO(+QLD) and TQQQ.
** This analysis is based solely on the quantification of crowd psychology.
It does not incorporate price action, trading volume, or macroeconomic indicators.