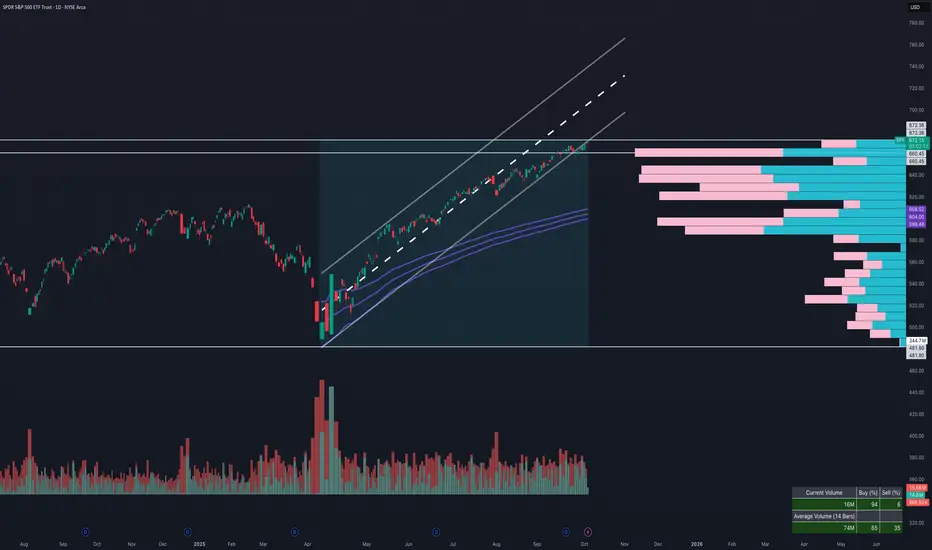
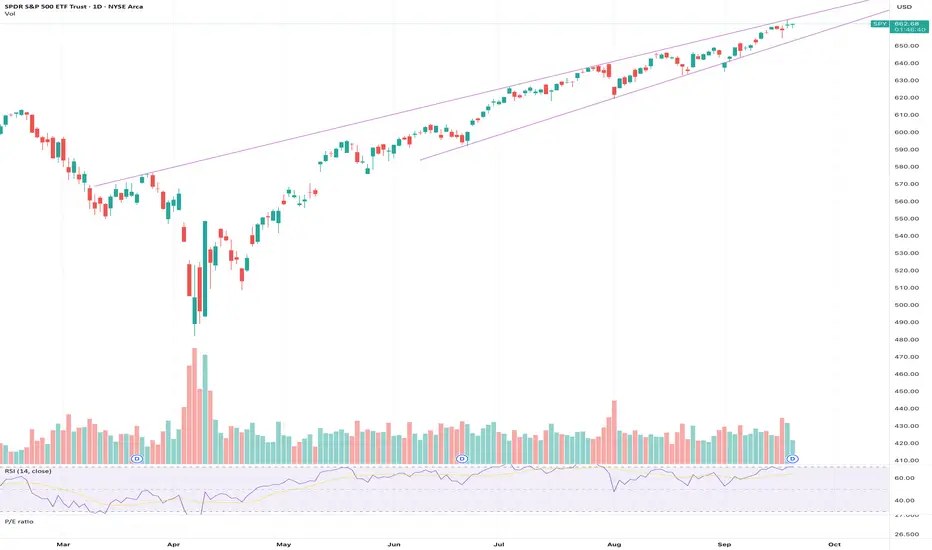
SPY on daily - trend still up but with fading volumeShows anchored vwap from April Lows around ~600 and has a gap on the same price.
SPY Currently at the lows of April channel and slightly outside.
I have also added volume profile to show where SPY bounced from the thick volume around 635.
If you want more finer charts like these with channels and vwaps / volume profile and at 3 different timeframes then message me on X - vickg81.
SPY trade ideas
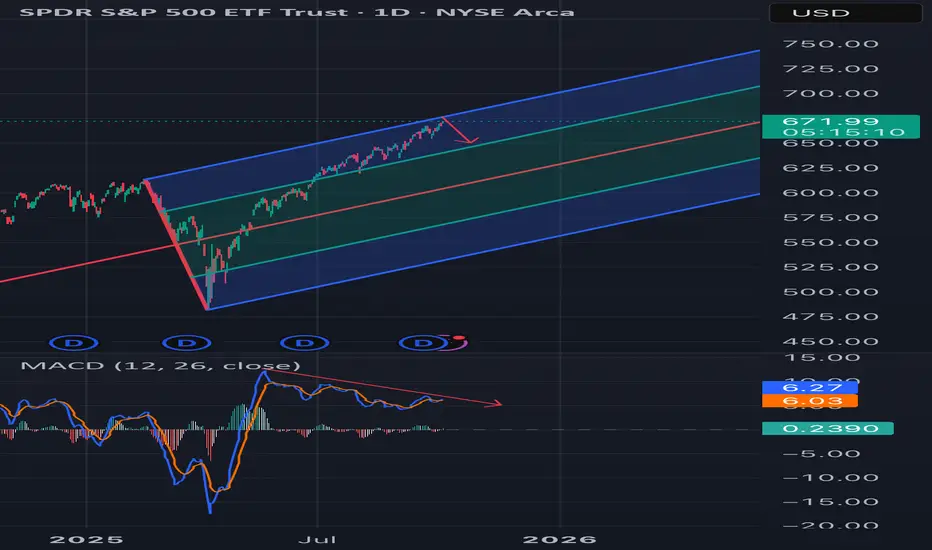
Spy idea This disgrace will not go much higher 675 680 at most near resistance , huge Macd divergence . no economic data for the next two weeks . Market is going up on nothing rate cuts priced in already . I expect the market to correct soon and very quickly . Not an advice
Elliott Wave Forecast: SPDR S&P 500 (SPY)’s Path to Record PeaksThe Short-Term Elliott Wave analysis for the SPDR S&P 500 ETF (SPY), starting from August 2, indicates an ongoing impulsive rally. From the August 2 low, the ETF surged in wave ((i)) to 647.04, followed by a dip in wave ((ii)) concluding at 634.92. The ETF then climbed in wave ((iii)) to 667.34. A corrective pullback in wave ((iv)) formed a zigzag Elliott Wave pattern. From the wave ((iii)) peak, wave (a) declined to 661.98, wave (b) rallied to 664.65, and wave (c) dropped to 654.42, completing wave ((iv)).
The ETF has since resumed its upward trajectory in wave ((v)), exhibiting an impulsive structure with internal extensions. From the wave ((iv)) low, wave (i) reached 662.37, and a brief pullback in wave (ii) ended at 657.88. The ETF then nested higher, with wave i peaking at 665.8 and wave ii correcting to 660.93. Wave iii ascended to 670.74, followed by a wave iv pullback to 666.78. As long as the pivot low at 654.42 holds, the ETF should continue its upward momentum in the near term.

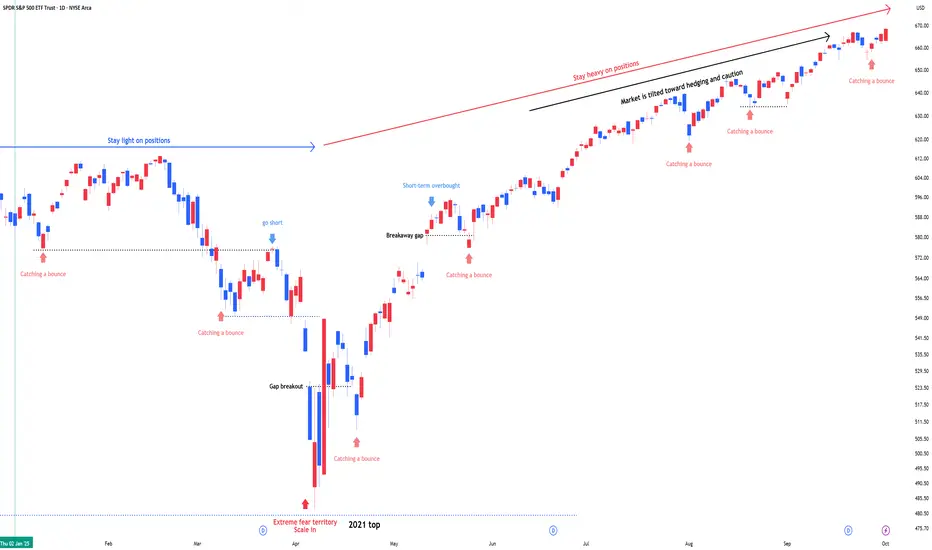
SPY : Stay heavy on positionsSPY : Stay heavy on positions (2x leverage)
Entering a risk-on, high-volatility zone.
In stay light on positions zones, I hold SPY(+QQQ) and reduce exposure.
In stay heavy on positions zones, I increase allocation using a mix of SSO(+QLD) and TQQQ.
** This analysis is based solely on the quantification of crowd psychology.
It does not incorporate price action, trading volume, or macroeconomic indicators.
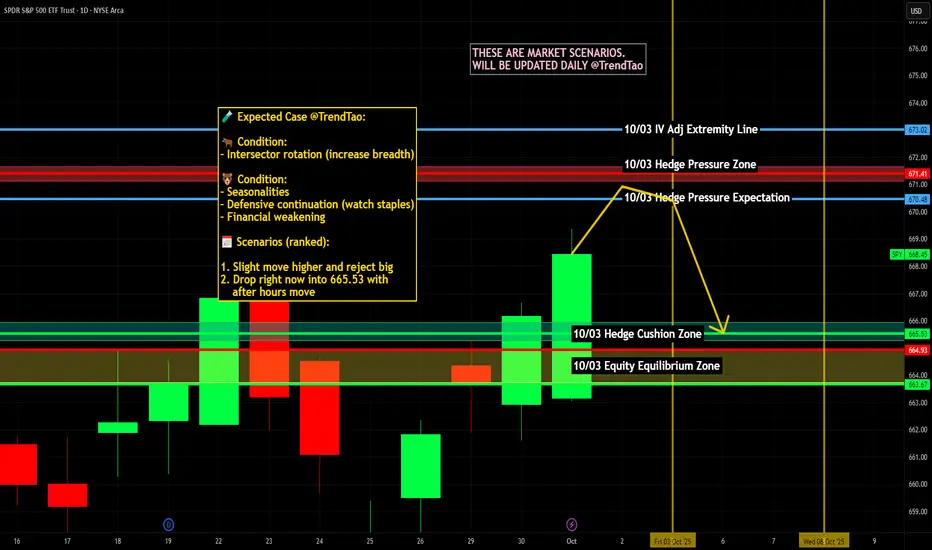
$SPY / $SPX Scenarios — Thursday, Oct 2, 2025🔮 AMEX:SPY / SP:SPX Scenarios — Thursday, Oct 2, 2025 🔮
🌍 Market-Moving Headlines
🚩 Shutdown watch: Traders brace for possible delays in major data releases; only essential reports like jobless claims likely to print.
📉 Post-ADP/ISM digestion: Markets recalibrate after Wednesday’s jobs + factory data ahead of Friday’s 🚩 NFP.
💵 Fed chatter: Dallas Fed’s Logan adds to policy tone as markets parse shutdown + labor signals.
📊 Key Data & Events (ET)
⏰ 🚩 8:30 AM — Initial Jobless Claims (weekly) (will publish even under shutdown)
⏰ 10:00 AM — Factory Orders (Aug) (at risk of delay if shutdown persists)
⏰ 10:30 AM — Fed Speaker: Lorie Logan (Dallas Fed)
⚠️ Disclaimer: Educational/informational only — not financial advice.
📌 #trading #stockmarket #SPY #SPX #joblessclaims #factoryorders #Fed #shutdown #bonds #Dollar #economy
SPY VS. Economic DownturnTechnicals
- Double Top
- Bearish Divergence
- RSI approaching Overbought territory (68 on the daily)
Fundamentals
- Inflation Rising
- Unemployment Rising
- Job Openings Decreasing
- Government Shutdown (Friday's Non-Farm Payrolls report Cancelled)
- Q4 Earnings (Big Tech AI CapEx spend needs to show proof of ROI)

SPY MONEY PRINTER GO BRRR|LONG|
✅SPY with the FED lowering rates, liquidity injections perspective fuel risk assets. Price has broken out above the key level, signaling bullish order flow. SMC outlook suggests momentum could push into new all-time highs as money printer effects unfold. Time Frame 1H.
LONG🚀
✅Like and subscribe to never miss a new idea!✅

TANKTOBER!SPY eyeing a break below 6600—shutdown looms, Powell’s silence speaks volumes. Holding shorts, rolling puts into November 655s if we gap. #SharpShooterStocks #Trading #SPY #Shutdown2025

SPYBASED ON OUR AI FEDRATE MODEL HIGHER LONG TERM PROJECTIONS HAVE BEEN POSTED ON THE CHART.
THERE IS $7.7 TRILLIONS parked in #MONEY market funds. The #FED is going to cut rates next month. THIS COULD BE THE SOURCE OF 🚀 TO PUSH #SPY #SPX much higher.

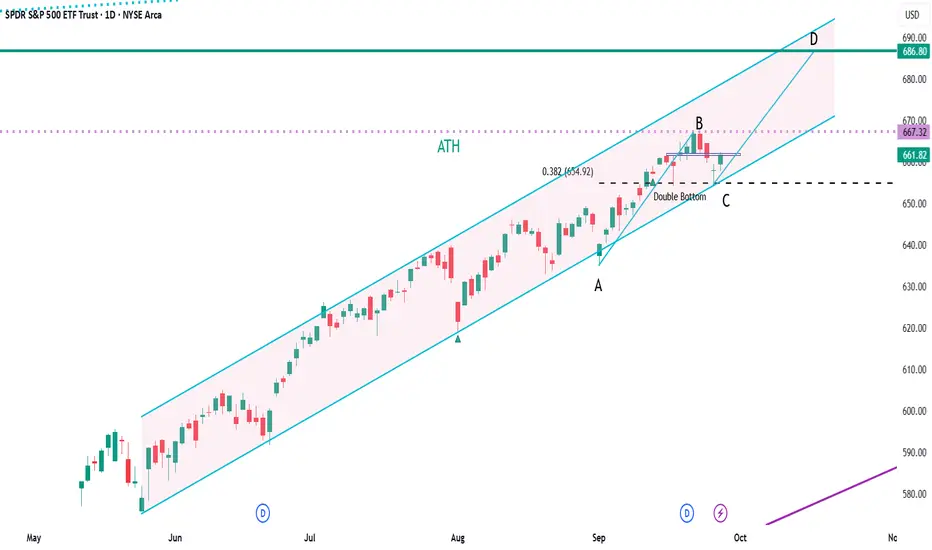
SPY Daily OutlookThe index continues to trade inside a well-defined rising channel. After setting a new ATH at point B, price retraced into a double bottom at C near the 654 support zone — aligning with the 0.328 retracement/last week's low. The rebound from that level keeps the bullish structure intact.
⚡ Key Levels to Watch:
Support: 654 (double bottom / fib confluence)
Resistance: 667–670 (prior high & channel midline)
Upside target: 685-690 (channel top / point D projection)
As long as 654 holds, the path of least resistance favors a move toward 690. A decisive break below 654, however, would signal weakness and open the door to deeper downside.
Still AliveStill here, don't worry, will post an update soon on what I've been up to. But for now, we're at an inflection point, with ChatGPT saying we could see 655 and further 652 by Monday if markets react badly to PCE. Otherwise a nice healthy bounce to 662 and try for 667 -> 672 by next Friday. And we both peg Tuesday Sept 30th/Weds Oct 1st as up days, me with about 70% confidence.... ChatGPT with about 85%. *rolls eyes*

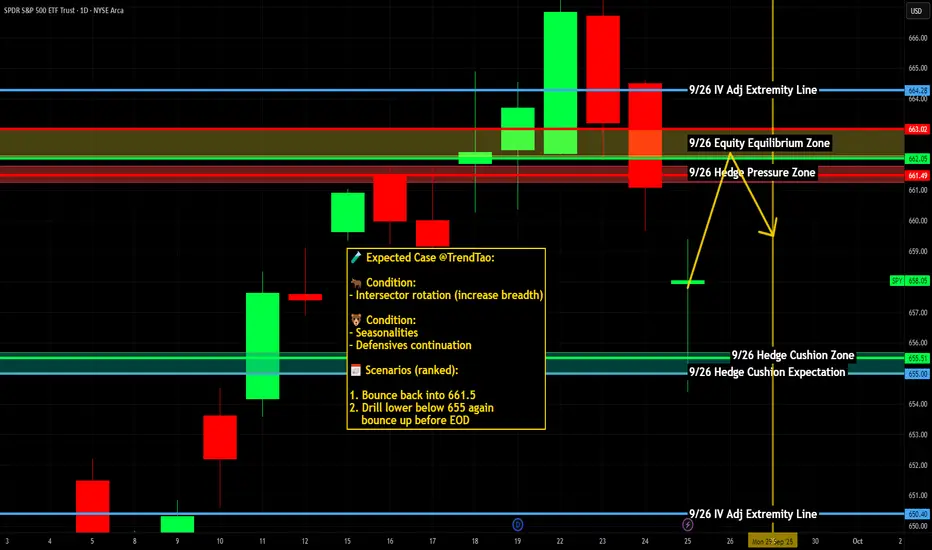
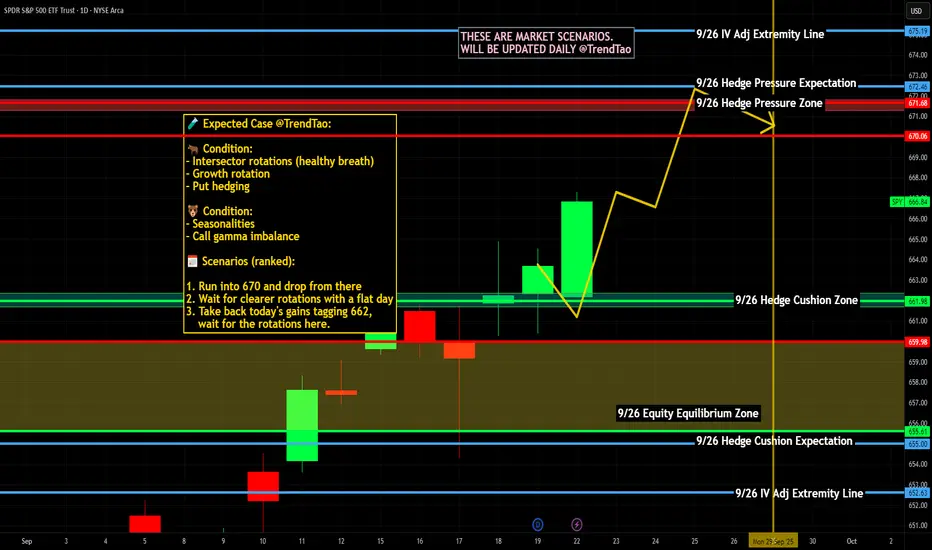
$SPY / $SPX Scenarios — Friday, Sept 26, 2025🔮 AMEX:SPY / SP:SPX Scenarios — Friday, Sept 26, 2025 🔮
🌍 Market-Moving Headlines
📉 Month-end flows: Positioning shuffle as traders square books into Q3-end.
💵 Fed lens: Multiple Fed appearances keep policy tone in focus post-SEP.
💻 Tech + growth watch: AMEX:XLK flows remain sensitive to yields + inflation gauges.
🛢️ Commodities check: Oil and dollar volatility continue to set cross-asset tone.
📊 Key Data & Events (ET)
⏰ 🚩 8:30 AM — Personal Income & Spending (Aug)
⏰ 🚩 8:30 AM — PCE Price Index (Aug) + Core PCE (YoY & MoM)
⏰ 10:00 AM — Consumer Sentiment (Final, Sep)
🗣️ Fed Speakers:
• 7:30 AM — Tom Barkin (Richmond Fed, TV appearance)
• 9:00 AM — Tom Barkin (speech)
• 1:00 PM — Michelle Bowman (Fed Vice Chair for Supervision)
⚠️ Disclaimer: Educational/informational only — not financial advice.
📌 #trading #stockmarket #SPY #SPX #PCE #inflation #Fed #Powell #joblessclaims #consumer #Dollar #bonds #megacaps
$SPY - Important Point To Watch Watching the S&P here closely. Catalyst-heavy window ahead with two more FOMC decisions (Oct 28–29 and Dec 9–10) sandwich Q3 earnings (banks kick off mid-Oct mega-cap tech late Oct/early Nov). These can drive volatility and directional breaks.

SPY S&P 500 etf Oversold on the RSI ! 2025 Price Target ! The SPDR S&P 500 ETF Trust (SPY) is flashing a major buy signal, with its Relative Strength Index (RSI) currently sitting at 28.33 — firmly in oversold territory. Historically, every time SPY has entered oversold levels on the RSI, institutional buyers have stepped in aggressively, driving sharp rebounds in the following weeks and months.
The last time SPY dipped below the 30 RSI threshold was during market pullbacks in 2022 and 2023 — both of which were followed by significant rallies as institutions capitalized on discounted valuations. The current setup is no different. With earnings growth stabilizing, inflation cooling, and the Federal Reserve signaling a potential shift toward rate cuts in the second half of the year, the backdrop for a recovery is aligning perfectly.
Technically, SPY is also approaching key support levels that have held strong in past market corrections. The combination of an oversold RSI and strong institutional appetite at these levels creates a compelling case for a bounce.
My price target for SPY by year-end is $640, representing over 15% upside from current levels. With sentiment stretched to the downside and technical indicators flashing green, SPY looks primed for a sharp and sustained rebound. Now could be the perfect time to position for the next leg higher.

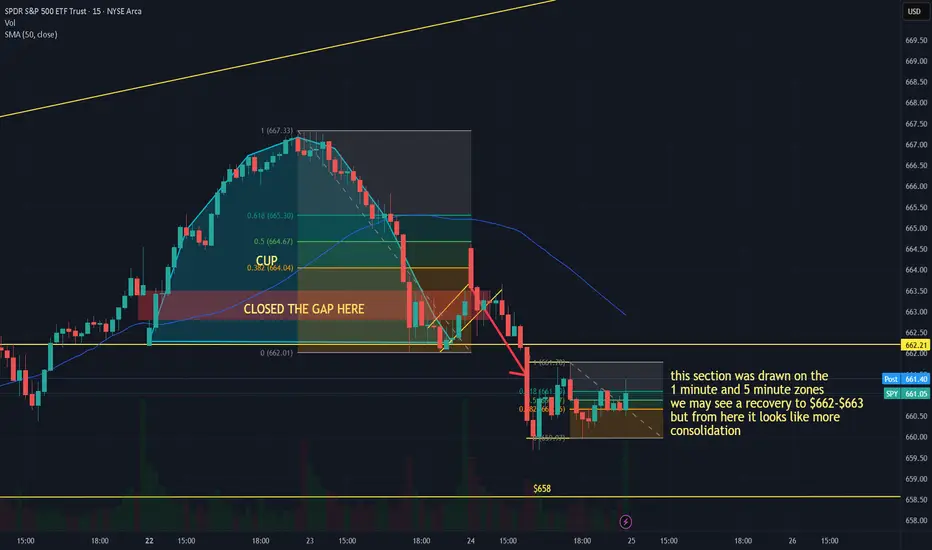
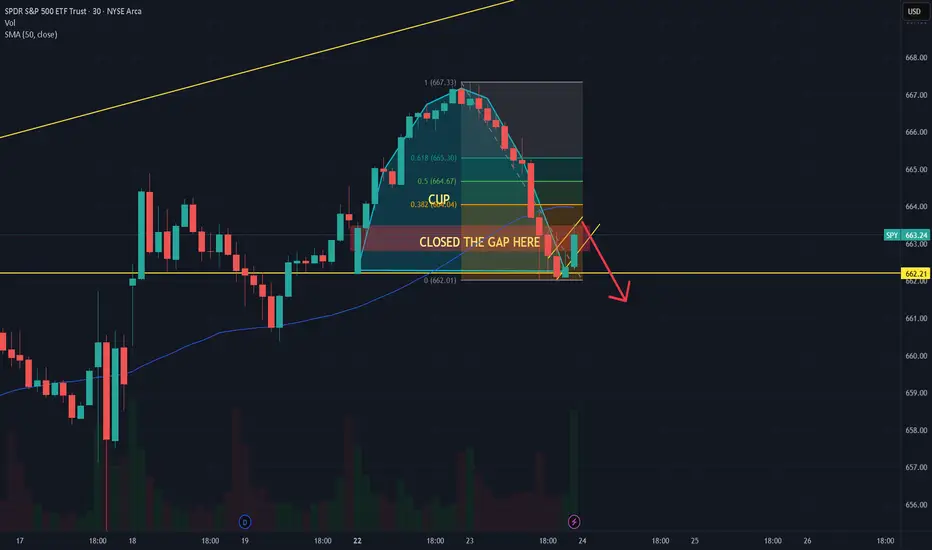
$SPY REVERSE CUP AND HANDLE part 2.I guess the reverse cup and handle I had drawn out on the 5 minute and one minute chart worked out too bad I did not have a put option in place. I would have recovered some of my losses chasing the rabbit on $ORCL. I'm not going to lie this market has me shook. I seriously prefer crypto. Participating in a market that is this effected by someone talking is ridiculous. What I am trying to learn is price action. I am also learning to use the 50 day Moving Average indicator. I am not fully comfortable. I have been able to use FIB retracement tool along with some other indicators whether it be a chat pattern or the MVA.
So, if you zoom in to the area where consolidation is taking place using the FIB retracement and support and resistance lines it may touch $662-$663. If it breaks out with a strong green candle we may have a recovery, but it breaks out lower below support with a strong red candle you will see a breakdown further down to previous supports $658, $654, $652.70 To close a big gap,
The reason I also say it may touch $662-$663 is because we should be tracking that the candles have to either bounce off of or tread about the 50-day MVA. So, either way there is money to be made but once this month and the holidays are through expect this to breakout much higher to $700 if trump gets his way. AKA Printer go BRRRRR. He's a master market manipulator and Perma bull
In the meantime, sit and wait for a good breakout I may have to exit my current position at a loss. Scary times we are living in. Get your life right with The Lord Jesus Christ.
AS ALWAYS THIS IS NOT FINANCIAL ADVICE, PURELY USING MY SELF-TAUGHT TECHNICAL ANALYSIS OF THE SITUATION. GODBLESS YOU ALL AND I PRAY YOU ALL HIT YOUR GOALS THIS MONTH.
Reverse Cup and Handle On SPY.So, I am looking at spy on the 1 minute and I see this beautiful arch It got a cup, and the handle is either forming or formed. So, I double check on the 30, 1 hour the 4 hour and the daily. The Daily is kind of eh. So, I can see it going down on the 1 minute if the Handle has formed and touching 660, But on other time frames like the daily using a 50-day moving average along with a support and resistance line you can see it go as low as $650, Since I am usually a crypto bro and Now I am trying my hand in stocks. It's not even the volatility that I struggle with its the Market reaction to the news. You can see something like a reverse cup and handle form and if trump says, " All American citizens should be on the lookout for SPYies." All of a sudden, the AMEX:SPY will do the opposite of what should happen when a cup and handle is forming. Although I regret putting in my position to soon and not looking at the chart first I put in a long call for $675- to $680 now I feel like. I should stick back to paper trading crypto at least I was more successful. I guess it's just a learning curve for me. But we shall see hopefully some good new tomorrow lol.
THIS IS NOT FINANCIAL ADVICE, BE ADVISED THIS IS MY OPINION AND JUST BASSED OFF OF WHAT I LEARN FROM LEARNING TRADING STRATGIES ON YOUTUBE. GODBLESS YOU ALL AND GOODLUCK. I need to do better.
Lesson learned this week.
Dont chase the rabbit
Look at the chart first before you put in a trade. I am about to blow up my account in a bit. SMH Went from $260 to $830 in a month doing swing trades. Not im back down to $300, chasing the rabbit and spending money moving. Ugh wish me luck its hard out here for a PAMP.
$SPY / $SPX Scenarios — Tuesday, Sept 23, 2025 🔮 AMEX:SPY / SP:SPX Scenarios — Tuesday, Sept 23, 2025 🔮
🌍 Market-Moving Headlines
📉 Post-Fed digestion: Equities and bonds still recalibrating after last week’s SEP + Powell tone.
💻 Mega-cap watch: Tech + AI flows continue to drive AMEX:XLK sentiment.
🌐 Central bank chatter: A busy Fed speaker slate gives extra volatility into month-end.
📊 Key Data & Events (ET)
⏰ 9:00 AM — Fed Vice Chair for Supervision Michelle Bowman speech
⏰ 🚩 9:45 AM — S&P Global Flash PMIs (Sep) — Services & Manufacturing
⏰ 10:00 AM — Atlanta Fed President Raphael Bostic speech
⏰ 🚩 12:35 PM — Fed Chair Jerome Powell speech
⚠️ Disclaimer: Educational/informational only — not financial advice.
📌 #trading #stockmarket #SPY #SPX #Powell #Fed #PMI #economy #Dollar #bonds #megacaps
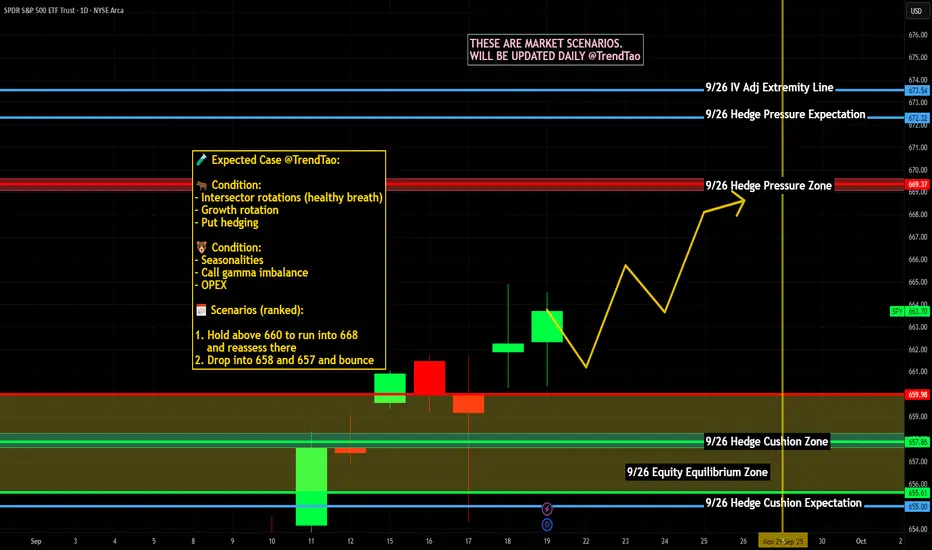
$SPY / $SPX Scenarios — Week of Sept 22 → Sept 26, 2025🔮 AMEX:SPY / SP:SPX Scenarios — Week of Sept 22 → Sept 26, 2025 🔮
🌍 Market-Moving Headlines
📉 Post-Fed positioning: Traders continue to recalibrate after last week’s cut + SEP; rates & USD tone drive risk.
💻 Mega-cap watch: NASDAQ:AAPL NASDAQ:MSFT NASDAQ:NVDA guidance/AI chatter keeps AMEX:XLK leadership in focus.
🛢️ Energy & FX: Oil swings and a firm dollar remain cross-asset headwinds.
📊 Key Data & Events (ET)
Tue 9/23
⏰ 9:45 AM — S&P Global Flash PMIs (Sep) (Mfg & Services).
Wed 9/24
⏰ 10:00 AM — New Home Sales (Aug).
Thu 9/25
⏰ 🚩 8:30 AM — Initial Jobless Claims (weekly).
⏰ 🚩 8:30 AM — GDP (Q2, Third Estimate).
⏰ 8:30 AM — Durable Goods Orders (Aug).
⏰ 10:00 AM — Existing Home Sales (Aug).
Fri 9/26
⏰ 🚩 8:30 AM — Personal Income & Outlays (Aug) incl. PCE/Core PCE.
⏰ 10:00 AM — UMich Consumer Sentiment (Final, Sep).
⚠️ Disclaimer: Educational/informational only — not financial advice.
📌 #trading #stockmarket #SPY #SPX #PCE #GDP #PMI #joblessclaims #housing #consumer #Fed #Dollar #oil #megacaps
SPY Trading Opportunity! SELL!
My dear friends,
Please, find my technical outlook for SPY below:
The instrument tests an important psychological level 663.63
Bias - Bearish
Technical Indicators: Supper Trend gives a precise Bearish signal, while Pivot Point HL predicts price changes and potential reversals in the market.
Target - 661.35
Recommended Stop Loss - 664.75
About Used Indicators:
Super-trend indicator is more useful in trending markets where there are clear uptrends and downtrends in price.
Disclosure: I am part of Trade Nation's Influencer program and receive a monthly fee for using their TradingView charts in my analysis.
———————————
WISH YOU ALL LUCK

SPY Top of RangeThe index kissed the top of it's 6-month ascending triangle range. With the big news this week for investors being what will the fed do with rates we've seen investors eagerly assume that several more cuts are baked in this year and early next.
While more cuts are most certainly on the way, the real question is if the market is overly optimistic to the tune of being deaf toward any form of downside news. Will cuts lead to inflation? Will inflation cause a greater pinch on Main Street that eventually bleeds into Wall Street? Will Russia "accidentally" attack Poland? Will Trump decide to raise Tariffs on China, Mexico or Canada again? The likelihood of something in the geo-political spectrum happening is fairly high and with many leading equities already stretching their P/E to absurd heights (thank you AI) the potential upside from here is much lower than the potential downside, or at least the risk-off side.
All it takes is one article from a Mag7 insider to say that they are trimming GPU purchases by 50% to curtail costs to match revenues and this turkey is goosed.
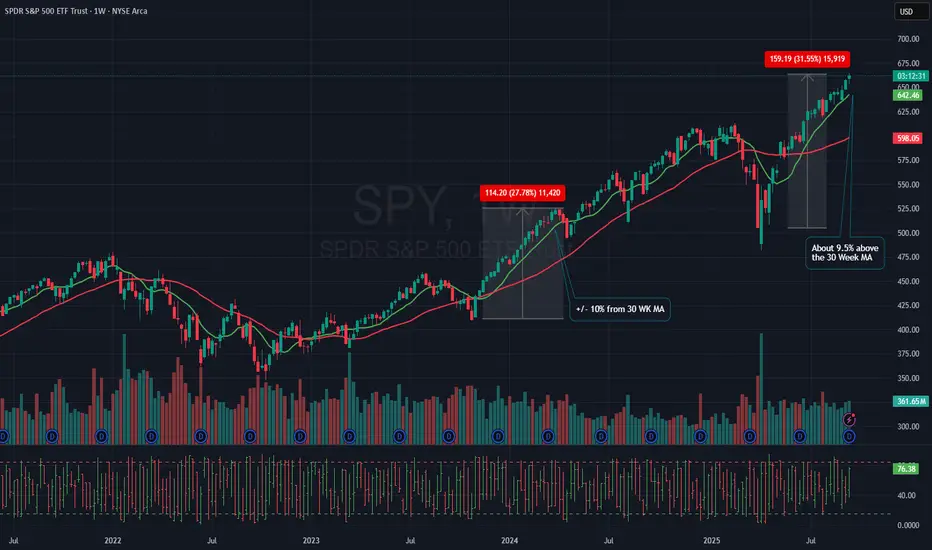
Potential $SPY Pullback AnalysisOverview
This section examines the possibility of a pullback in SPY, based on recent price movements and historical trends.
Current Price Stretch Relative to Moving Average
SPY is currently trading approximately 9.5% above its 30-week moving average. This level of extension is notable, as it approaches the threshold observed during previous pullbacks.
Historical Context
Looking back, the last significant instance when SPY was stretched about 10% above its 30-week moving average resulted in a pullback toward the end of March 2024. This comparison provides context for the current market situation.
Observational Note
It is worth noting that a confirmed closing price for the current week has not yet been established. This analysis is not a prediction, but rather an observation intended to increase awareness of market conditions.
SPY Fly or Die Looks like Q1 2024 is going to be a pivot point. Looking at the weekly tf, The price action curve has stayed consistent over the years. Im not a big fan of alot of indicators but we can see the bullish pressure building and bump and run pattern forming, Measured move from prior LL to Prior HH giving us a target of 700. Also 127 fib ext.
I would love to see the curve tested one more time but if there is a strong break to the top side Im going long on spy
please share your thoughts

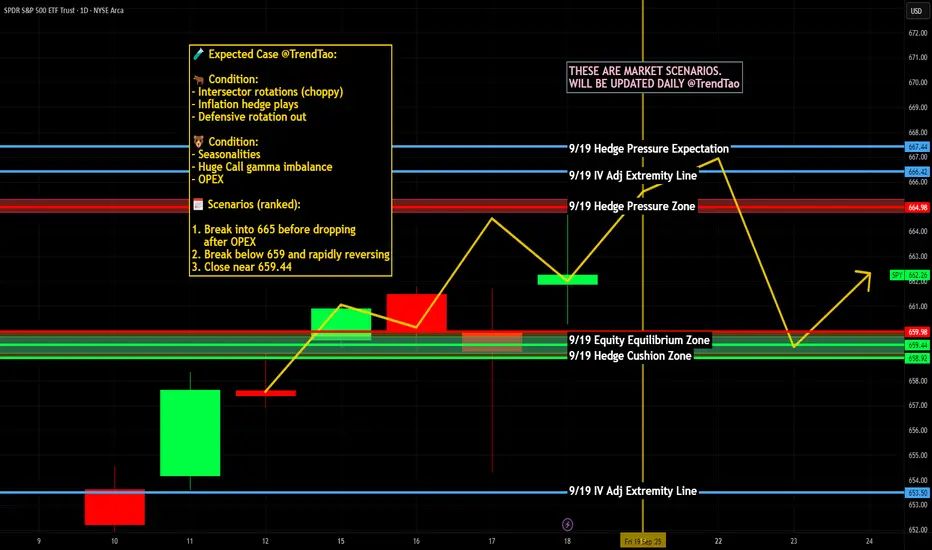
$SPY / $SPX Scenarios — Friday, Sept 19, 2025🔮 AMEX:SPY / SP:SPX Scenarios — Friday, Sept 19, 2025 🔮
🌍 Market-Moving Headlines
📉 Week-end positioning: Traders de-risk after a heavy Fed + macro week; watch flows into bonds and equities.
💬 Consumer & labor narrative: Markets digest Fed messaging alongside claims + LEI signals.
🌐 Global spillover: Europe and Asia equities feed into U.S. tone with light U.S. catalysts on deck.
📊 Key Data & Events (ET)
⏰ 10:00 AM — State Employment & Unemployment (Aug)
⚠️ Disclaimer: Educational/informational only — not financial advice.
📌 #trading #stockmarket #SPY #SPX #Fed #Powell #labor #economy #bonds #Dollar #risk